
|
|||||
|
 | |
| |
| |
| |
| |
| |
|
Gene: TBX2 |
Gene summary for TBX2 |
| Gene information | Species | Human | Gene symbol | TBX2 | Gene ID | 6909 |
| Gene name | T-box transcription factor 2 | |
| Gene Alias | VETD | |
| Cytomap | 17q23.2 | |
| Gene Type | protein-coding | GO ID | GO:0000122 | UniProtAcc | A0A024QZ86 |
Top |
Malignant transformation analysis |
| Identification of the aberrant gene expression in precancerous and cancerous lesions by comparing the gene expression of stem-like cells in diseased tissues with normal stem cells |
| Entrez ID | Symbol | Replicates | Species | Organ | Tissue | Adj P-value | Log2FC | Malignancy |
| 6909 | TBX2 | LZE7T | Human | Esophagus | ESCC | 3.45e-05 | 3.77e-01 | 0.0667 |
| 6909 | TBX2 | P4T-E | Human | Esophagus | ESCC | 1.20e-22 | 6.08e-01 | 0.1323 |
| 6909 | TBX2 | P9T-E | Human | Esophagus | ESCC | 1.70e-12 | 4.07e-01 | 0.1131 |
| 6909 | TBX2 | P16T-E | Human | Esophagus | ESCC | 5.43e-11 | 1.36e-01 | 0.1153 |
| 6909 | TBX2 | P26T-E | Human | Esophagus | ESCC | 4.01e-11 | 8.41e-02 | 0.1276 |
| 6909 | TBX2 | P27T-E | Human | Esophagus | ESCC | 9.94e-09 | 1.82e-01 | 0.1055 |
| 6909 | TBX2 | P28T-E | Human | Esophagus | ESCC | 1.90e-43 | 8.77e-01 | 0.1149 |
| 6909 | TBX2 | P30T-E | Human | Esophagus | ESCC | 7.83e-04 | 2.49e-01 | 0.137 |
| 6909 | TBX2 | P44T-E | Human | Esophagus | ESCC | 1.26e-02 | 7.82e-02 | 0.1096 |
| 6909 | TBX2 | Pt13.b | Human | Liver | HCC | 2.05e-08 | 2.36e-01 | 0.0251 |
| 6909 | TBX2 | S014 | Human | Liver | HCC | 9.01e-12 | 8.13e-01 | 0.2254 |
| 6909 | TBX2 | S015 | Human | Liver | HCC | 1.06e-08 | 8.47e-01 | 0.2375 |
| 6909 | TBX2 | S016 | Human | Liver | HCC | 1.74e-22 | 7.87e-01 | 0.2243 |
| Page: 1 |
| Tissue | Expression Dynamics | Abbreviation |
| Esophagus | 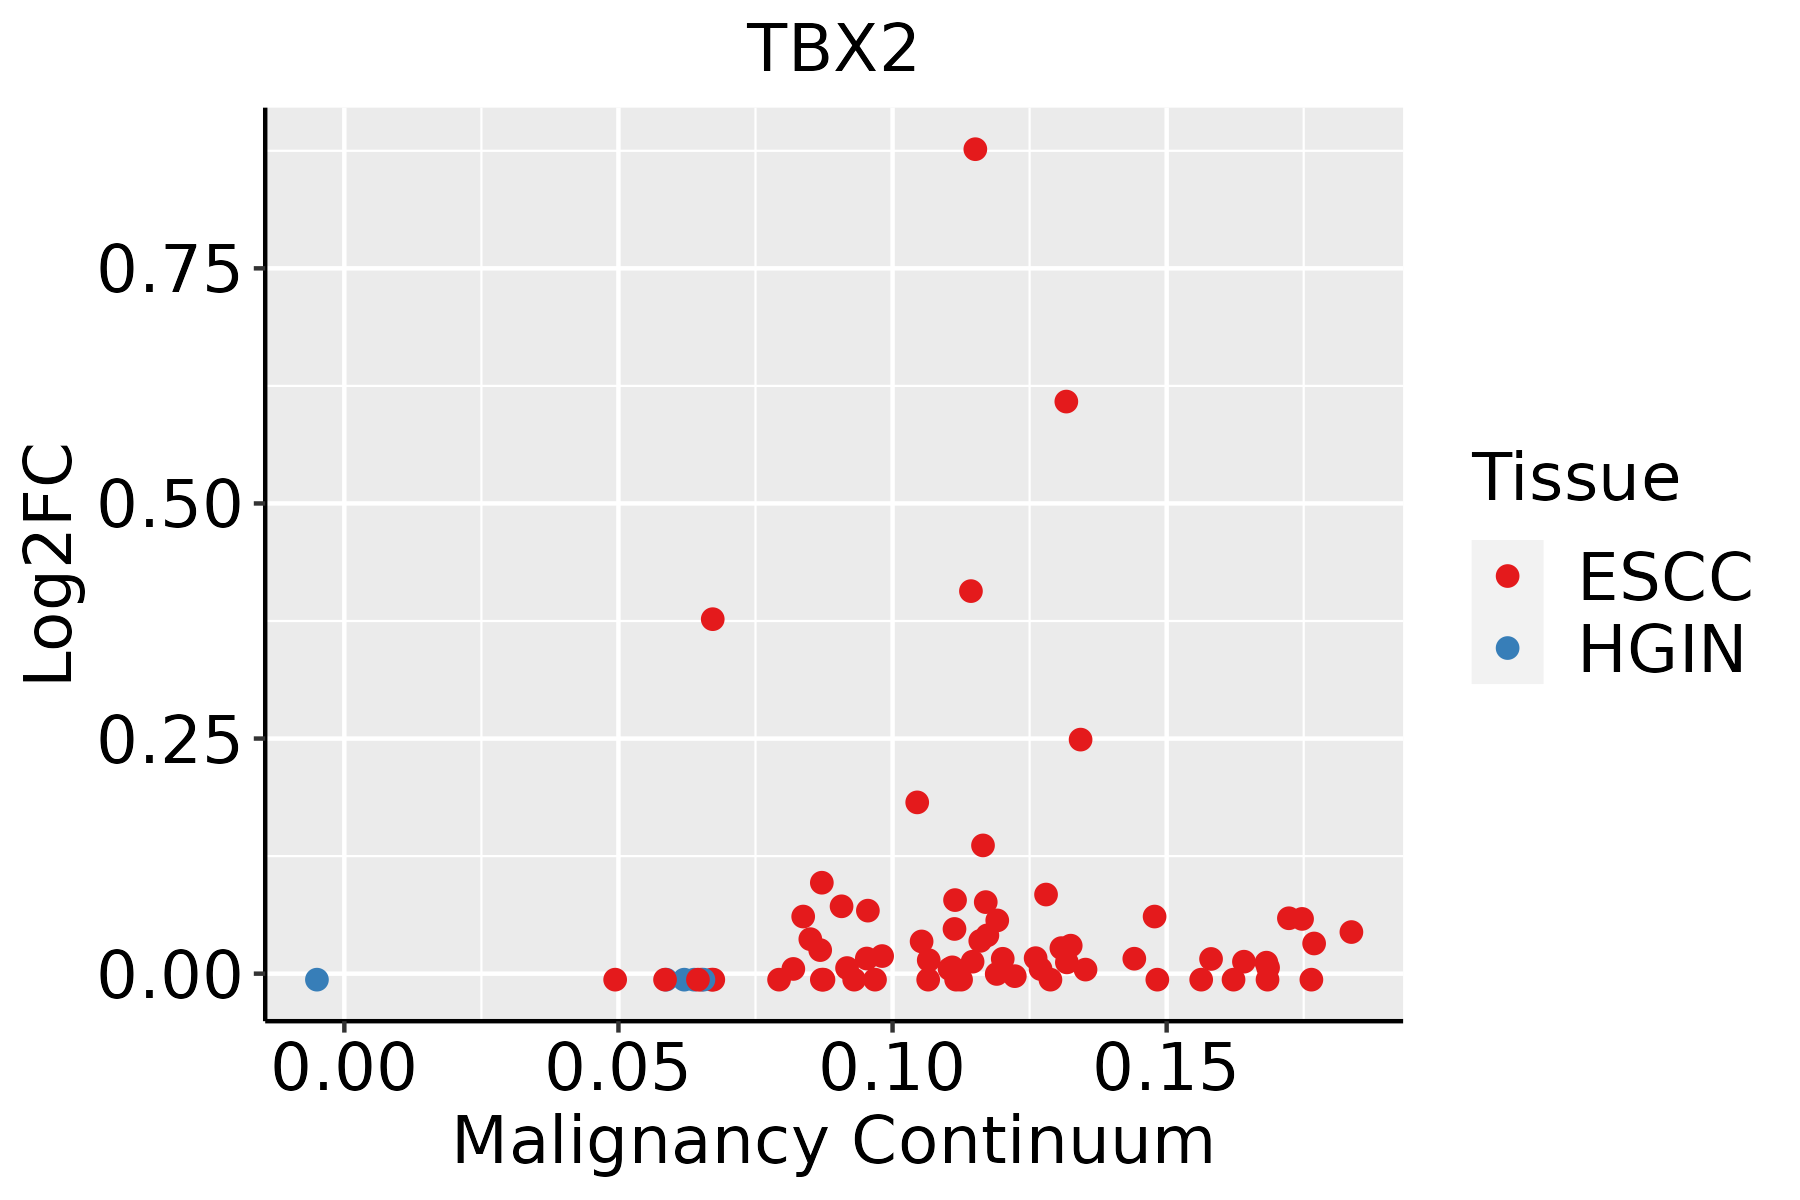 | ESCC: Esophageal squamous cell carcinoma |
| HGIN: High-grade intraepithelial neoplasias | ||
| LGIN: Low-grade intraepithelial neoplasias | ||
| Liver | 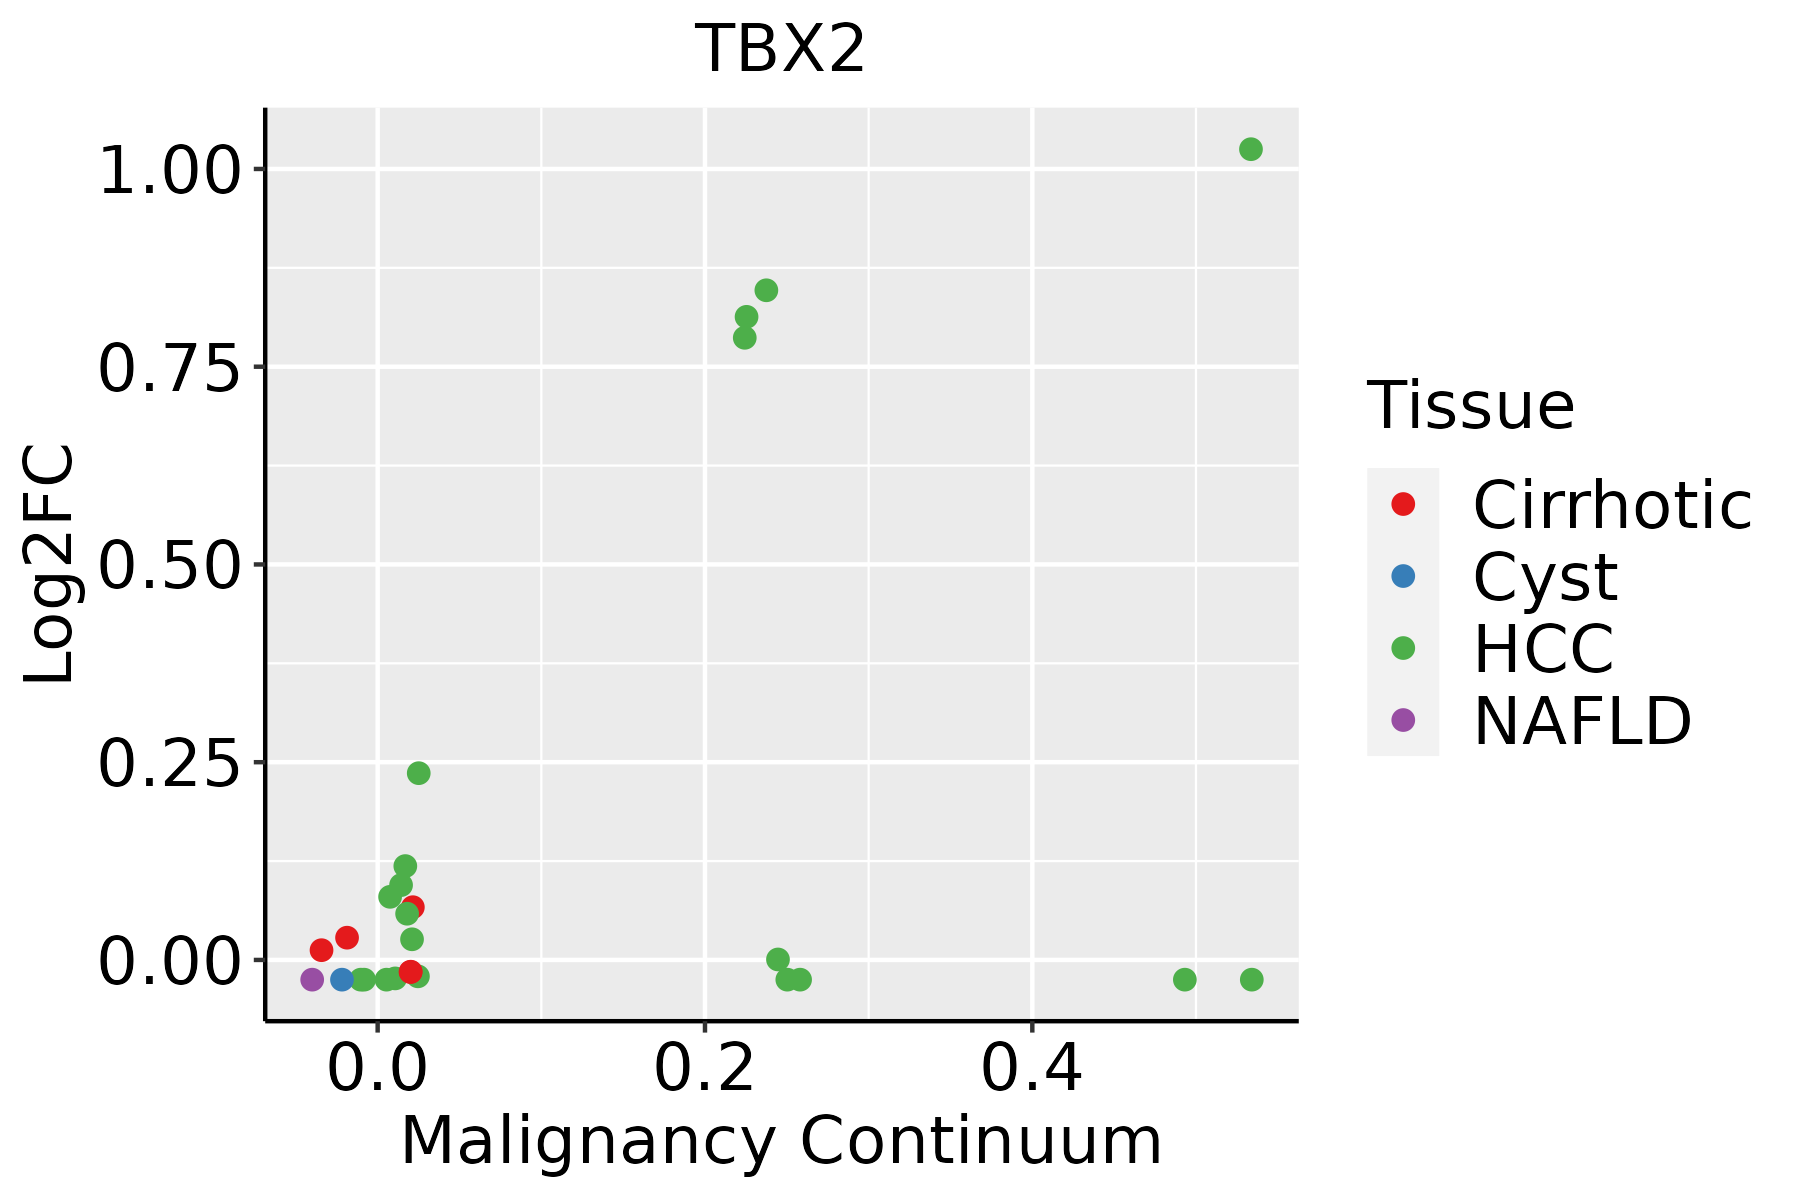 | HCC: Hepatocellular carcinoma |
| NAFLD: Non-alcoholic fatty liver disease |
| ∗log2FC in expression of this searched gene in stem-like cells from each diseased tissue sample relative to stem-like cells in normal samples in each tissue plotted against the malignancy continuum. Samples are colored based on if they are from different disease stage. |
Top |
Malignant transformation related pathway analysis |
| Find out the enriched GO biological processes and KEGG pathways involved in transition from healthy to precancer to cancer |
| Tissue | Disease Stage | Enriched GO biological Processes |
| Colorectum | AD |  |
| Colorectum | SER |  |
| Colorectum | MSS |  |
| Colorectum | MSI-H |  |
| Colorectum | FAP |  |
| ∗Top 15 enriched GO BP terms are showed in the bar plot of each disease state in each tissue. Each row represents a significant GO biological process which is colored according to the -log10(p.adjust). |
| Page: 1 2 3 4 5 6 7 8 9 |
| GO ID | Tissue | Disease Stage | Description | Gene Ratio | Bg Ratio | pvalue | p.adjust | Count |
| GO:0048732111 | Esophagus | ESCC | gland development | 269/8552 | 436/18723 | 7.81e-12 | 2.95e-10 | 269 |
| GO:000756820 | Esophagus | ESCC | aging | 201/8552 | 339/18723 | 2.64e-07 | 3.94e-06 | 201 |
| GO:002261216 | Esophagus | ESCC | gland morphogenesis | 78/8552 | 118/18723 | 5.83e-06 | 6.03e-05 | 78 |
| GO:006056210 | Esophagus | ESCC | epithelial tube morphogenesis | 187/8552 | 325/18723 | 9.95e-06 | 9.44e-05 | 187 |
| GO:00072197 | Esophagus | ESCC | Notch signaling pathway | 106/8552 | 172/18723 | 1.74e-05 | 1.55e-04 | 106 |
| GO:00488638 | Esophagus | ESCC | stem cell differentiation | 122/8552 | 206/18723 | 5.95e-05 | 4.59e-04 | 122 |
| GO:003087914 | Esophagus | ESCC | mammary gland development | 85/8552 | 137/18723 | 8.11e-05 | 6.01e-04 | 85 |
| GO:00075699 | Esophagus | ESCC | cell aging | 81/8552 | 132/18723 | 2.00e-04 | 1.27e-03 | 81 |
| GO:00485687 | Esophagus | ESCC | embryonic organ development | 228/8552 | 427/18723 | 7.28e-04 | 3.79e-03 | 228 |
| GO:006056010 | Esophagus | ESCC | developmental growth involved in morphogenesis | 131/8552 | 234/18723 | 9.28e-04 | 4.73e-03 | 131 |
| GO:00487367 | Esophagus | ESCC | appendage development | 98/8552 | 172/18723 | 1.83e-03 | 8.37e-03 | 98 |
| GO:00601737 | Esophagus | ESCC | limb development | 98/8552 | 172/18723 | 1.83e-03 | 8.37e-03 | 98 |
| GO:00454454 | Esophagus | ESCC | myoblast differentiation | 52/8552 | 84/18723 | 1.98e-03 | 8.90e-03 | 52 |
| GO:00604856 | Esophagus | ESCC | mesenchyme development | 156/8552 | 291/18723 | 3.76e-03 | 1.53e-02 | 156 |
| GO:006053716 | Esophagus | ESCC | muscle tissue development | 211/8552 | 403/18723 | 3.84e-03 | 1.56e-02 | 211 |
| GO:00330025 | Esophagus | ESCC | muscle cell proliferation | 134/8552 | 248/18723 | 4.80e-03 | 1.86e-02 | 134 |
| GO:00604435 | Esophagus | ESCC | mammary gland morphogenesis | 28/8552 | 43/18723 | 7.98e-03 | 2.84e-02 | 28 |
| GO:0060021 | Esophagus | ESCC | roof of mouth development | 50/8552 | 85/18723 | 1.00e-02 | 3.42e-02 | 50 |
| GO:00903984 | Esophagus | ESCC | cellular senescence | 54/8552 | 93/18723 | 1.08e-02 | 3.67e-02 | 54 |
| GO:00350512 | Esophagus | ESCC | cardiocyte differentiation | 86/8552 | 156/18723 | 1.09e-02 | 3.68e-02 | 86 |
| Page: 1 2 |
| Pathway ID | Tissue | Disease Stage | Description | Gene Ratio | Bg Ratio | pvalue | p.adjust | qvalue | Count |
| Page: 1 |
Top |
Cell-cell communication analysis |
| Identification of potential cell-cell interactions between two cell types and their ligand-receptor pairs for different disease states |
| Ligand | Receptor | LRpair | Pathway | Tissue | Disease Stage |
| Page: 1 |
Top |
Single-cell gene regulatory network inference analysis |
| Find out the significant the regulons (TFs) and the target genes of each regulon across cell types for different disease states |
| TF | Cell Type | Tissue | Disease Stage | Target Gene | RSS | Regulon Activity |
| TBX2 | PERI | Endometrium | ADJ | RGS5,NDUFA4L2,COX4I2, etc. | 3.14e-01 |  |
| TBX2 | PERI | Endometrium | AEH | RGS5,NDUFA4L2,COX4I2, etc. | 3.36e-01 |  |
| TBX2 | PERI | Endometrium | EEC | RGS5,NDUFA4L2,COX4I2, etc. | 4.12e-01 |  |
| TBX2 | PERI | Endometrium | Healthy | RGS5,NDUFA4L2,COX4I2, etc. | 1.84e-01 |  |
| TBX2 | PERI | Esophagus | ESCC | NOTCH3,CSPG4,RGS5, etc. | 3.82e-01 |  |
| TBX2 | SMC | Prostate | ADJ | RGS5,NDUFA4L2,COL18A1, etc. | 4.04e-01 |  |
| TBX2 | PERI | Prostate | ADJ | RGS5,NDUFA4L2,COL18A1, etc. | 7.06e-02 | |
| TBX2 | PERI | Prostate | Healthy | RGS5,NDUFA4L2,COL18A1, etc. | 2.32e-01 |  |
| TBX2 | PERI | Prostate | Tumor | RGS5,NDUFA4L2,COL18A1, etc. | 2.94e-01 |  |
| ∗The dot plots of a searched regulon are shown for all cell subpopulations in each disease state of each tissue based on the regulon specific score inferred using pySCENIC and by calculating the average expression. |
| Page: 1 |
Top |
Somatic mutation of malignant transformation related genes |
| Annotation of somatic variants for genes involved in malignant transformation |
| Hugo Symbol | Variant Class | Variant Classification | dbSNP RS | HGVSc | HGVSp | HGVSp Short | SWISSPROT | BIOTYPE | SIFT | PolyPhen | Tumor Sample Barcode | Tissue | Histology | Sex | Age | Stage | Therapy Types | Drugs | Outcome |
| TBX2 | SNV | Missense_Mutation | novel | c.268N>T | p.Arg90Cys | p.R90C | Q13207 | protein_coding | deleterious(0) | probably_damaging(0.995) | TCGA-E2-A155-01 | Breast | breast invasive carcinoma | Female | <65 | I/II | Chemotherapy | cytoxan | SD |
| TBX2 | SNV | Missense_Mutation | rs373091690 | c.1858N>T | p.Arg620Cys | p.R620C | Q13207 | protein_coding | deleterious(0) | probably_damaging(0.98) | TCGA-FU-A3HZ-01 | Cervix | cervical & endocervical cancer | Female | <65 | I/II | Chemotherapy | cisplatin | CR |
| TBX2 | SNV | Missense_Mutation | novel | c.1978N>T | p.Pro660Ser | p.P660S | Q13207 | protein_coding | tolerated(0.33) | benign(0.195) | TCGA-VS-A94Z-01 | Cervix | cervical & endocervical cancer | Female | <65 | I/II | Chemotherapy | cisplatin | CR |
| TBX2 | SNV | Missense_Mutation | rs373091690 | c.1858C>T | p.Arg620Cys | p.R620C | Q13207 | protein_coding | deleterious(0) | probably_damaging(0.98) | TCGA-5M-AAT6-01 | Colorectum | colon adenocarcinoma | Female | <65 | III/IV | Unknown | Unknown | PD |
| TBX2 | SNV | Missense_Mutation | c.560N>G | p.Tyr187Cys | p.Y187C | Q13207 | protein_coding | deleterious(0.01) | probably_damaging(1) | TCGA-AA-3492-01 | Colorectum | colon adenocarcinoma | Female | >=65 | I/II | Unknown | Unknown | SD | |
| TBX2 | SNV | Missense_Mutation | novel | c.1405G>A | p.Ala469Thr | p.A469T | Q13207 | protein_coding | tolerated(0.11) | possibly_damaging(0.501) | TCGA-AA-A010-01 | Colorectum | colon adenocarcinoma | Female | <65 | I/II | Chemotherapy | folinic | CR |
| TBX2 | SNV | Missense_Mutation | novel | c.268N>T | p.Arg90Cys | p.R90C | Q13207 | protein_coding | deleterious(0) | probably_damaging(0.995) | TCGA-AA-A022-01 | Colorectum | colon adenocarcinoma | Female | >=65 | I/II | Unknown | Unknown | SD |
| TBX2 | SNV | Missense_Mutation | c.754N>G | p.Thr252Ala | p.T252A | Q13207 | protein_coding | deleterious(0) | probably_damaging(0.967) | TCGA-AY-6197-01 | Colorectum | colon adenocarcinoma | Male | <65 | I/II | Unknown | Unknown | SD | |
| TBX2 | SNV | Missense_Mutation | rs373091690 | c.1858C>T | p.Arg620Cys | p.R620C | Q13207 | protein_coding | deleterious(0) | probably_damaging(0.98) | TCGA-CA-5256-01 | Colorectum | colon adenocarcinoma | Female | <65 | I/II | Chemotherapy | oxaliplatin | CR |
| TBX2 | SNV | Missense_Mutation | c.1387G>A | p.Gly463Arg | p.G463R | Q13207 | protein_coding | deleterious(0.04) | benign(0.066) | TCGA-CK-4951-01 | Colorectum | colon adenocarcinoma | Female | >=65 | I/II | Unknown | Unknown | PD |
| Page: 1 2 3 4 5 6 7 |
Top |
Related drugs of malignant transformation related genes |
| Identification of chemicals and drugs interact with genes involved in malignant transfromation |
| (DGIdb 4.0) |
| Entrez ID | Symbol | Category | Interaction Types | Drug Claim Name | Drug Name | PMIDs |
| 6909 | TBX2 | TRANSCRIPTION FACTOR, TRANSCRIPTION FACTOR COMPLEX | atenolol | ATENOLOL | 31327267 |
| Page: 1 |

Copyright 2023-Present -The University of Texas Health Science Center at Houston |