
|
|||||
|
 | |
| |
| |
| |
| |
| |
|
Gene: TBX1 |
Gene summary for TBX1 |
| Gene information | Species | Human | Gene symbol | TBX1 | Gene ID | 6899 |
| Gene name | T-box transcription factor 1 | |
| Gene Alias | CAFS | |
| Cytomap | 22q11.21 | |
| Gene Type | protein-coding | GO ID | GO:0000165 | UniProtAcc | O43435 |
Top |
Malignant transformation analysis |
| Identification of the aberrant gene expression in precancerous and cancerous lesions by comparing the gene expression of stem-like cells in diseased tissues with normal stem cells |
| Entrez ID | Symbol | Replicates | Species | Organ | Tissue | Adj P-value | Log2FC | Malignancy |
| 6899 | TBX1 | P2T-E | Human | Esophagus | ESCC | 8.25e-07 | 7.15e-02 | 0.1177 |
| 6899 | TBX1 | P5T-E | Human | Esophagus | ESCC | 1.55e-02 | 6.88e-02 | 0.1327 |
| 6899 | TBX1 | P8T-E | Human | Esophagus | ESCC | 1.37e-08 | 1.08e-01 | 0.0889 |
| 6899 | TBX1 | P10T-E | Human | Esophagus | ESCC | 2.92e-70 | 1.28e+00 | 0.116 |
| 6899 | TBX1 | P12T-E | Human | Esophagus | ESCC | 4.90e-11 | 1.32e-01 | 0.1122 |
| 6899 | TBX1 | P15T-E | Human | Esophagus | ESCC | 1.31e-02 | 9.46e-02 | 0.1149 |
| 6899 | TBX1 | P16T-E | Human | Esophagus | ESCC | 2.64e-07 | 7.15e-02 | 0.1153 |
| 6899 | TBX1 | P20T-E | Human | Esophagus | ESCC | 1.51e-02 | 9.69e-02 | 0.1124 |
| 6899 | TBX1 | P21T-E | Human | Esophagus | ESCC | 2.79e-22 | 5.63e-01 | 0.1617 |
| 6899 | TBX1 | P22T-E | Human | Esophagus | ESCC | 1.75e-10 | 1.44e-01 | 0.1236 |
| 6899 | TBX1 | P23T-E | Human | Esophagus | ESCC | 2.89e-02 | 9.12e-02 | 0.108 |
| 6899 | TBX1 | P24T-E | Human | Esophagus | ESCC | 3.69e-05 | 7.04e-02 | 0.1287 |
| 6899 | TBX1 | P26T-E | Human | Esophagus | ESCC | 1.47e-13 | 1.64e-01 | 0.1276 |
| 6899 | TBX1 | P27T-E | Human | Esophagus | ESCC | 1.56e-11 | 9.43e-02 | 0.1055 |
| 6899 | TBX1 | P28T-E | Human | Esophagus | ESCC | 5.33e-08 | 1.08e-01 | 0.1149 |
| 6899 | TBX1 | P30T-E | Human | Esophagus | ESCC | 3.85e-06 | 1.98e-01 | 0.137 |
| 6899 | TBX1 | P31T-E | Human | Esophagus | ESCC | 1.30e-19 | 2.33e-01 | 0.1251 |
| 6899 | TBX1 | P47T-E | Human | Esophagus | ESCC | 2.08e-05 | 7.10e-02 | 0.1067 |
| 6899 | TBX1 | P52T-E | Human | Esophagus | ESCC | 1.17e-02 | 5.79e-02 | 0.1555 |
| 6899 | TBX1 | P56T-E | Human | Esophagus | ESCC | 6.66e-05 | 3.70e-01 | 0.1613 |
| Page: 1 2 |
| Tissue | Expression Dynamics | Abbreviation |
| Esophagus | 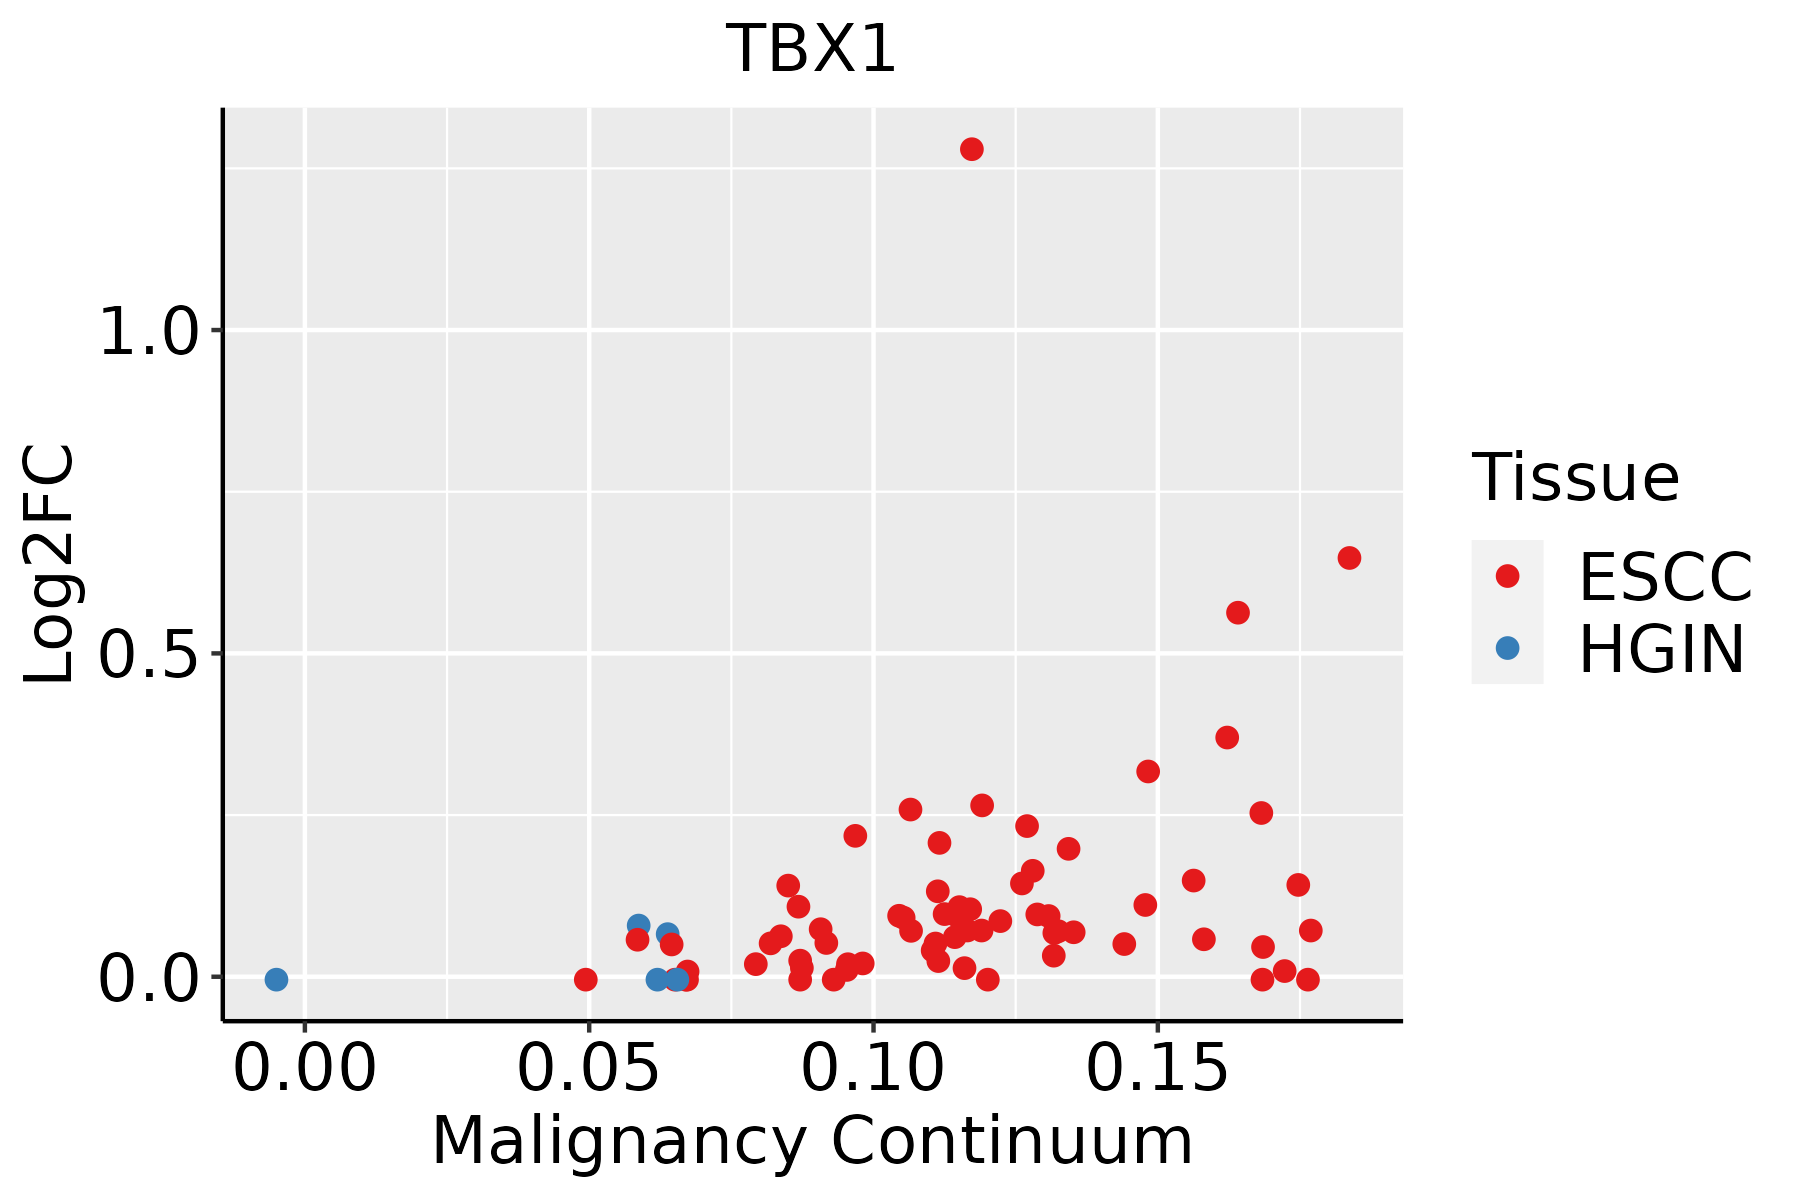 | ESCC: Esophageal squamous cell carcinoma |
| HGIN: High-grade intraepithelial neoplasias | ||
| LGIN: Low-grade intraepithelial neoplasias | ||
| Oral Cavity | 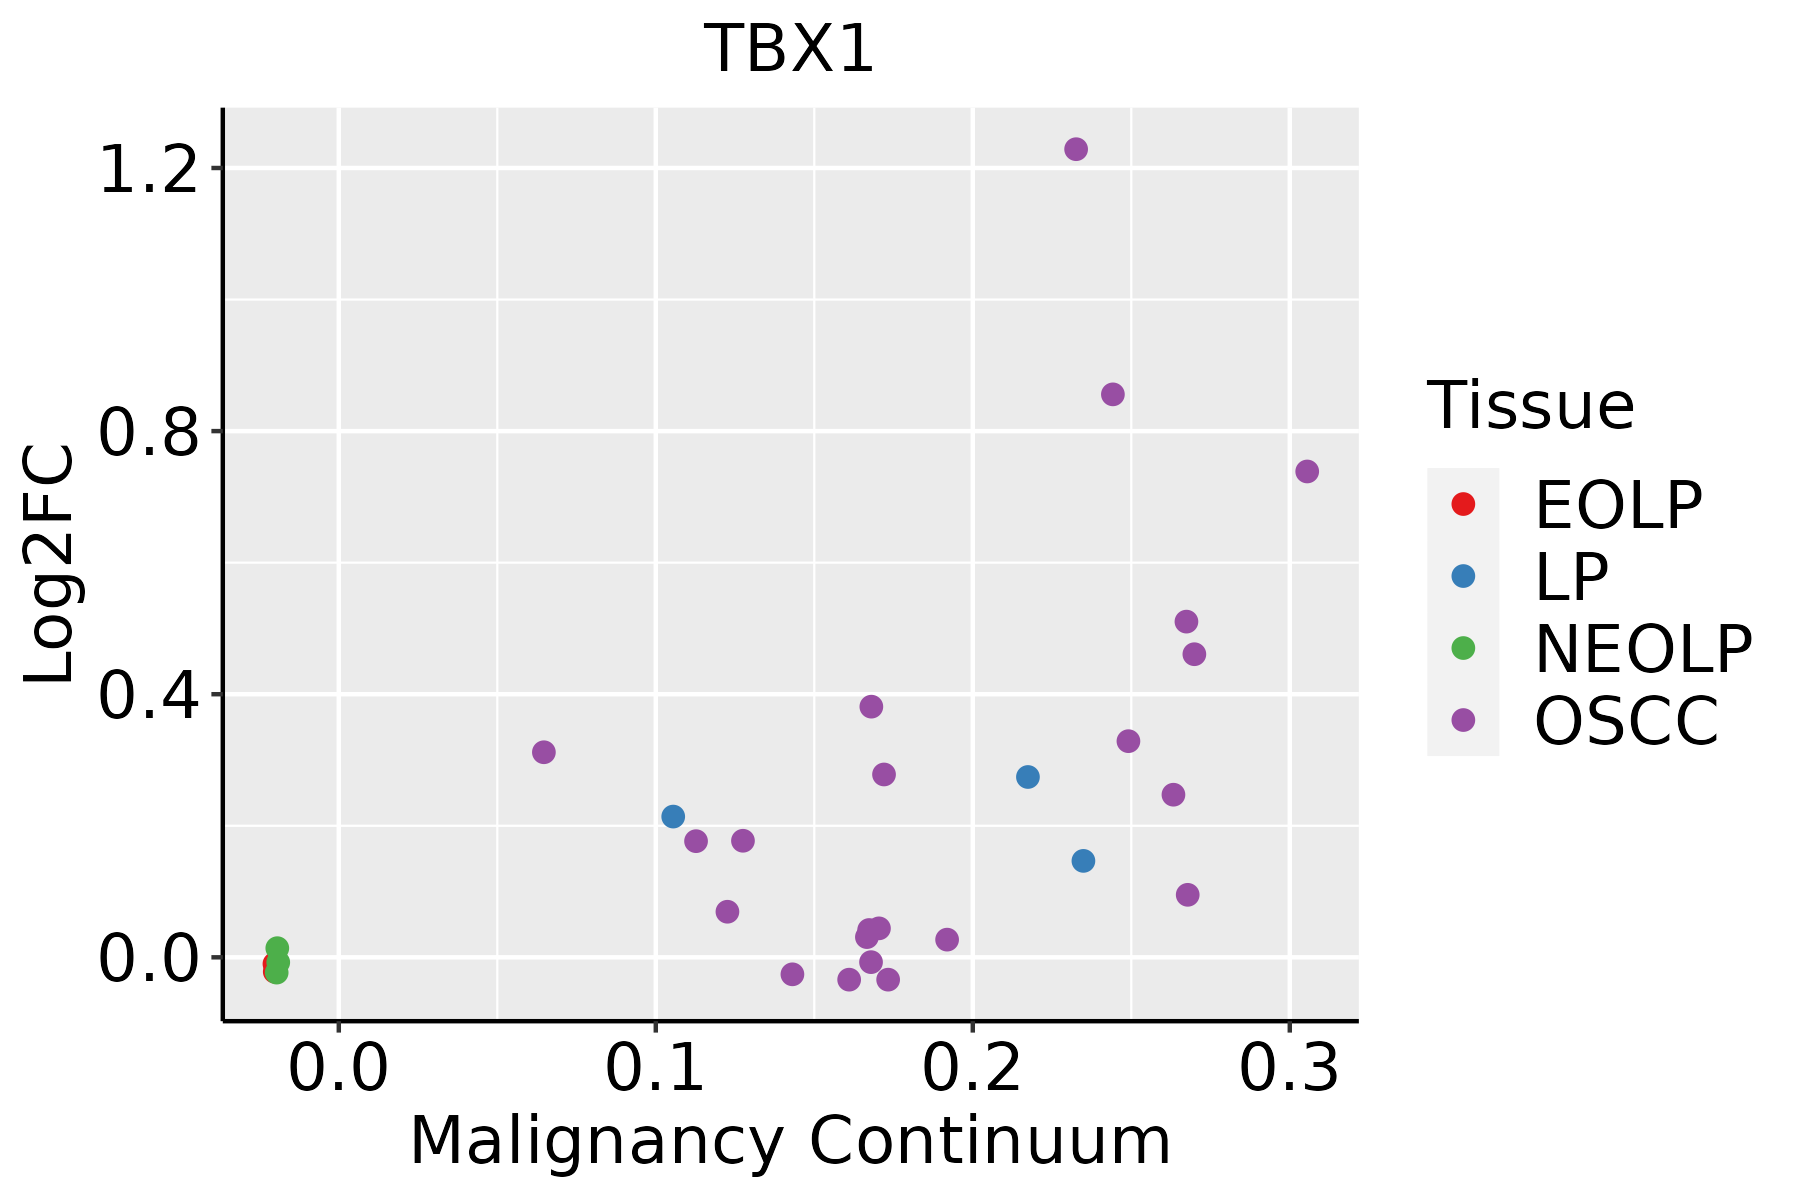 | EOLP: Erosive Oral lichen planus |
| LP: leukoplakia | ||
| NEOLP: Non-erosive oral lichen planus | ||
| OSCC: Oral squamous cell carcinoma |
| ∗log2FC in expression of this searched gene in stem-like cells from each diseased tissue sample relative to stem-like cells in normal samples in each tissue plotted against the malignancy continuum. Samples are colored based on if they are from different disease stage. |
Top |
Malignant transformation related pathway analysis |
| Find out the enriched GO biological processes and KEGG pathways involved in transition from healthy to precancer to cancer |
| Tissue | Disease Stage | Enriched GO biological Processes |
| Colorectum | AD |  |
| Colorectum | SER |  |
| Colorectum | MSS |  |
| Colorectum | MSI-H |  |
| Colorectum | FAP |  |
| ∗Top 15 enriched GO BP terms are showed in the bar plot of each disease state in each tissue. Each row represents a significant GO biological process which is colored according to the -log10(p.adjust). |
| Page: 1 2 3 4 5 6 7 8 9 |
| GO ID | Tissue | Disease Stage | Description | Gene Ratio | Bg Ratio | pvalue | p.adjust | Count |
| GO:0048732111 | Esophagus | ESCC | gland development | 269/8552 | 436/18723 | 7.81e-12 | 2.95e-10 | 269 |
| GO:0030522110 | Esophagus | ESCC | intracellular receptor signaling pathway | 170/8552 | 265/18723 | 8.58e-10 | 2.09e-08 | 170 |
| GO:00603242 | Esophagus | ESCC | face development | 34/8552 | 44/18723 | 1.90e-05 | 1.67e-04 | 34 |
| GO:00488638 | Esophagus | ESCC | stem cell differentiation | 122/8552 | 206/18723 | 5.95e-05 | 4.59e-04 | 122 |
| GO:005067318 | Esophagus | ESCC | epithelial cell proliferation | 238/8552 | 437/18723 | 1.19e-04 | 8.20e-04 | 238 |
| GO:00485386 | Esophagus | ESCC | thymus development | 33/8552 | 45/18723 | 1.54e-04 | 1.02e-03 | 33 |
| GO:005067817 | Esophagus | ESCC | regulation of epithelial cell proliferation | 206/8552 | 381/18723 | 5.51e-04 | 3.02e-03 | 206 |
| GO:00487628 | Esophagus | ESCC | mesenchymal cell differentiation | 133/8552 | 236/18723 | 5.94e-04 | 3.22e-03 | 133 |
| GO:00485687 | Esophagus | ESCC | embryonic organ development | 228/8552 | 427/18723 | 7.28e-04 | 3.79e-03 | 228 |
| GO:00101711 | Esophagus | ESCC | body morphogenesis | 30/8552 | 43/18723 | 1.21e-03 | 5.88e-03 | 30 |
| GO:000166720 | Esophagus | ESCC | ameboidal-type cell migration | 250/8552 | 475/18723 | 1.22e-03 | 5.97e-03 | 250 |
| GO:00603253 | Esophagus | ESCC | face morphogenesis | 21/8552 | 28/18723 | 1.57e-03 | 7.33e-03 | 21 |
| GO:00604856 | Esophagus | ESCC | mesenchyme development | 156/8552 | 291/18723 | 3.76e-03 | 1.53e-02 | 156 |
| GO:006053716 | Esophagus | ESCC | muscle tissue development | 211/8552 | 403/18723 | 3.84e-03 | 1.56e-02 | 211 |
| GO:004838412 | Esophagus | ESCC | retinoic acid receptor signaling pathway | 22/8552 | 31/18723 | 3.90e-03 | 1.58e-02 | 22 |
| GO:00325261 | Esophagus | ESCC | response to retinoic acid | 63/8552 | 107/18723 | 4.05e-03 | 1.62e-02 | 63 |
| GO:00487052 | Esophagus | ESCC | skeletal system morphogenesis | 120/8552 | 220/18723 | 4.90e-03 | 1.89e-02 | 120 |
| GO:00603232 | Esophagus | ESCC | head morphogenesis | 22/8552 | 32/18723 | 7.12e-03 | 2.58e-02 | 22 |
| GO:20000274 | Esophagus | ESCC | regulation of animal organ morphogenesis | 71/8552 | 125/18723 | 7.97e-03 | 2.84e-02 | 71 |
| GO:0060021 | Esophagus | ESCC | roof of mouth development | 50/8552 | 85/18723 | 1.00e-02 | 3.42e-02 | 50 |
| Page: 1 2 3 |
| Pathway ID | Tissue | Disease Stage | Description | Gene Ratio | Bg Ratio | pvalue | p.adjust | qvalue | Count |
| Page: 1 |
Top |
Cell-cell communication analysis |
| Identification of potential cell-cell interactions between two cell types and their ligand-receptor pairs for different disease states |
| Ligand | Receptor | LRpair | Pathway | Tissue | Disease Stage |
| Page: 1 |
Top |
Single-cell gene regulatory network inference analysis |
| Find out the significant the regulons (TFs) and the target genes of each regulon across cell types for different disease states |
| TF | Cell Type | Tissue | Disease Stage | Target Gene | RSS | Regulon Activity |
| TBX1 | CD8TEXINT | Esophagus | ADJ | PLPP7,MTIF3,MTIF2, etc. | 2.62e-01 |  |
| TBX1 | LYMEND | Esophagus | ADJ | TFF3,PROX1,TFPI, etc. | 3.19e-01 | |
| TBX1 | LYMEND | Esophagus | ESCC | TFF3,PROX1,TFPI, etc. | 2.14e-01 |  |
| TBX1 | LYMEND | Esophagus | Healthy | TFF3,PROX1,TFPI, etc. | 9.59e-02 |  |
| TBX1 | SPI | Oral cavity | ADJ | JAG2,THAP7,C22orf29, etc. | 3.04e-02 |  |
| TBX1 | SPI | Oral cavity | EOLP | JAG2,THAP7,C22orf29, etc. | 4.45e-01 |  |
| TBX1 | SPI | Oral cavity | NEOLP | JAG2,THAP7,C22orf29, etc. | 3.12e-01 |  |
| TBX1 | LYMEND | Oral cavity | ADJ | TFF3,TC2N,PROX1, etc. | 1.85e-01 | |
| TBX1 | LYMEND | Oral cavity | Healthy | TFF3,TC2N,PROX1, etc. | 1.37e-01 |  |
| TBX1 | LYMEND | Oral cavity | LP | TFF3,TC2N,PROX1, etc. | 2.48e-01 |  |
| ∗The dot plots of a searched regulon are shown for all cell subpopulations in each disease state of each tissue based on the regulon specific score inferred using pySCENIC and by calculating the average expression. |
| Page: 1 2 |
Top |
Somatic mutation of malignant transformation related genes |
| Annotation of somatic variants for genes involved in malignant transformation |
| Hugo Symbol | Variant Class | Variant Classification | dbSNP RS | HGVSc | HGVSp | HGVSp Short | SWISSPROT | BIOTYPE | SIFT | PolyPhen | Tumor Sample Barcode | Tissue | Histology | Sex | Age | Stage | Therapy Types | Drugs | Outcome |
| TBX1 | insertion | Frame_Shift_Ins | novel | c.1359_1360insACACACACACACACACACA | p.His454ThrfsTer169 | p.H454Tfs*169 | O43435 | protein_coding | TCGA-DS-A1OC-01 | Cervix | cervical & endocervical cancer | Female | <65 | I/II | Chemotherapy | gemcitabine | SD | ||
| TBX1 | SNV | Missense_Mutation | c.517G>A | p.Ala173Thr | p.A173T | O43435 | protein_coding | deleterious(0) | probably_damaging(0.983) | TCGA-G4-6320-01 | Colorectum | colon adenocarcinoma | Male | >=65 | III/IV | Chemotherapy | oxaliplatin | SD | |
| TBX1 | SNV | Missense_Mutation | c.259G>A | p.Glu87Lys | p.E87K | O43435 | protein_coding | tolerated(0.38) | benign(0.007) | TCGA-G4-6586-01 | Colorectum | colon adenocarcinoma | Female | >=65 | I/II | Unknown | Unknown | SD | |
| TBX1 | SNV | Missense_Mutation | novel | c.645G>T | p.Lys215Asn | p.K215N | O43435 | protein_coding | deleterious(0) | probably_damaging(0.997) | TCGA-AJ-A3EL-01 | Endometrium | uterine corpus endometrioid carcinoma | Female | <65 | I/II | Unknown | Unknown | SD |
| TBX1 | SNV | Missense_Mutation | c.472C>A | p.Leu158Met | p.L158M | O43435 | protein_coding | deleterious(0.03) | possibly_damaging(0.592) | TCGA-AP-A059-01 | Endometrium | uterine corpus endometrioid carcinoma | Female | >=65 | I/II | Unknown | Unknown | SD | |
| TBX1 | SNV | Missense_Mutation | novel | c.412N>T | p.Arg138Trp | p.R138W | O43435 | protein_coding | deleterious(0) | probably_damaging(1) | TCGA-AP-A1DV-01 | Endometrium | uterine corpus endometrioid carcinoma | Female | <65 | I/II | Unknown | Unknown | SD |
| TBX1 | SNV | Missense_Mutation | novel | c.801N>T | p.Glu267Asp | p.E267D | O43435 | protein_coding | deleterious(0.01) | benign(0.36) | TCGA-AP-A1DV-01 | Endometrium | uterine corpus endometrioid carcinoma | Female | <65 | I/II | Unknown | Unknown | SD |
| TBX1 | SNV | Missense_Mutation | rs144848597 | c.796G>A | p.Glu266Lys | p.E266K | O43435 | protein_coding | tolerated(0.21) | possibly_damaging(0.537) | TCGA-AX-A05Z-01 | Endometrium | uterine corpus endometrioid carcinoma | Female | <65 | III/IV | Chemotherapy | adriamycin | SD |
| TBX1 | SNV | Missense_Mutation | novel | c.505C>T | p.Arg169Cys | p.R169C | O43435 | protein_coding | deleterious(0) | probably_damaging(1) | TCGA-AX-A2HD-01 | Endometrium | uterine corpus endometrioid carcinoma | Female | >=65 | III/IV | Unknown | Unknown | SD |
| TBX1 | SNV | Missense_Mutation | novel | c.598C>T | p.Pro200Ser | p.P200S | O43435 | protein_coding | deleterious(0) | probably_damaging(0.998) | TCGA-AX-A2HD-01 | Endometrium | uterine corpus endometrioid carcinoma | Female | >=65 | III/IV | Unknown | Unknown | SD |
| Page: 1 2 |
Top |
Related drugs of malignant transformation related genes |
| Identification of chemicals and drugs interact with genes involved in malignant transfromation |
| (DGIdb 4.0) |
| Entrez ID | Symbol | Category | Interaction Types | Drug Claim Name | Drug Name | PMIDs |
| Page: 1 |

Copyright 2023-Present -The University of Texas Health Science Center at Houston |