Schematic overview of the cellular and molecular mechanisms involved in the cancer progression, including the proposed cellular and molecular mechanisms in cancer cells trajectory. AT1: alveolar type 1 cells; AT2: alveolar type 2 cells; AAH: atypical adenomatous hyperplasia; AIS: adenocarcinoma in situ; MIA: minimally invasive adenocarcinoma; IA: invasive adenocarcinoma; EMT: epithelial-mesenchymal transition

Home

Download

Statistics

Help

Contact

Center for Computational Systems Medicine
leaf

Gene summary

leaf

Malignant transformation analysis

leaf

Malignant transformation related pathway analysis

leaf

Cell-cell communication analysis

leaf

Single-cell gene regulatory network inference analysis

leaf

Somatic mutation of malignant transformation related genes

leaf

Related drugs of malignant transformation related genes

Gene: TBRG4

Gene summary for TBRG4

check button Gene summary.

Gene informationSpeciesHuman
Gene symbol

TBRG4

Gene ID

9238

Gene nametransforming growth factor beta regulator 4
Gene AliasCPR2
Cytomap7p13
Gene Typeprotein-coding
GO ID

GO:0000959

UniProtAcc

B3KRS4


Top

Malignant transformation analysis

check button Identification of the aberrant gene expression in precancerous and cancerous lesions by comparing the gene expression of stem-like cells in diseased tissues with normal stem cells
check button Malignant transformation involving gene list.
Entrez IDSymbolReplicatesSpeciesOrganTissueAdj P-valueLog2FCMalignancy
9238TBRG4LZE2THumanEsophagusESCC9.12e-038.06e-010.082
9238TBRG4LZE4THumanEsophagusESCC1.28e-142.66e-010.0811
9238TBRG4LZE5THumanEsophagusESCC3.78e-021.35e-010.0514
9238TBRG4LZE7THumanEsophagusESCC2.32e-104.62e-010.0667
9238TBRG4LZE8THumanEsophagusESCC9.41e-062.09e-010.067
9238TBRG4LZE20THumanEsophagusESCC2.12e-041.21e-010.0662
9238TBRG4LZE24THumanEsophagusESCC1.33e-092.61e-010.0596
9238TBRG4LZE21THumanEsophagusESCC6.14e-063.21e-010.0655
9238TBRG4LZE6THumanEsophagusESCC9.20e-052.38e-010.0845
9238TBRG4P1T-EHumanEsophagusESCC9.13e-064.38e-010.0875
9238TBRG4P2T-EHumanEsophagusESCC2.21e-315.04e-010.1177
9238TBRG4P4T-EHumanEsophagusESCC5.41e-236.36e-010.1323
9238TBRG4P5T-EHumanEsophagusESCC1.47e-091.62e-010.1327
9238TBRG4P8T-EHumanEsophagusESCC2.73e-223.68e-010.0889
9238TBRG4P9T-EHumanEsophagusESCC1.70e-204.34e-010.1131
9238TBRG4P10T-EHumanEsophagusESCC8.22e-273.76e-010.116
9238TBRG4P11T-EHumanEsophagusESCC1.41e-187.49e-010.1426
9238TBRG4P12T-EHumanEsophagusESCC2.70e-244.54e-010.1122
9238TBRG4P15T-EHumanEsophagusESCC2.21e-265.91e-010.1149
9238TBRG4P16T-EHumanEsophagusESCC7.01e-356.33e-010.1153
Page: 1 2 3 4 5 6 

check button Transcriptomic changes along malignancy continuum.
TissueExpression DynamicsAbbreviation
EsophagusThe image shows the transcriptomic changes along malignancy continuum.log2FC in expression of this searched gene in stem-like cells from each diseased tissue sample relative to stem-like cells in normal samples in each tissue plotted against the malignancy continuum. Samples are colored based on if they are from different disease stage.
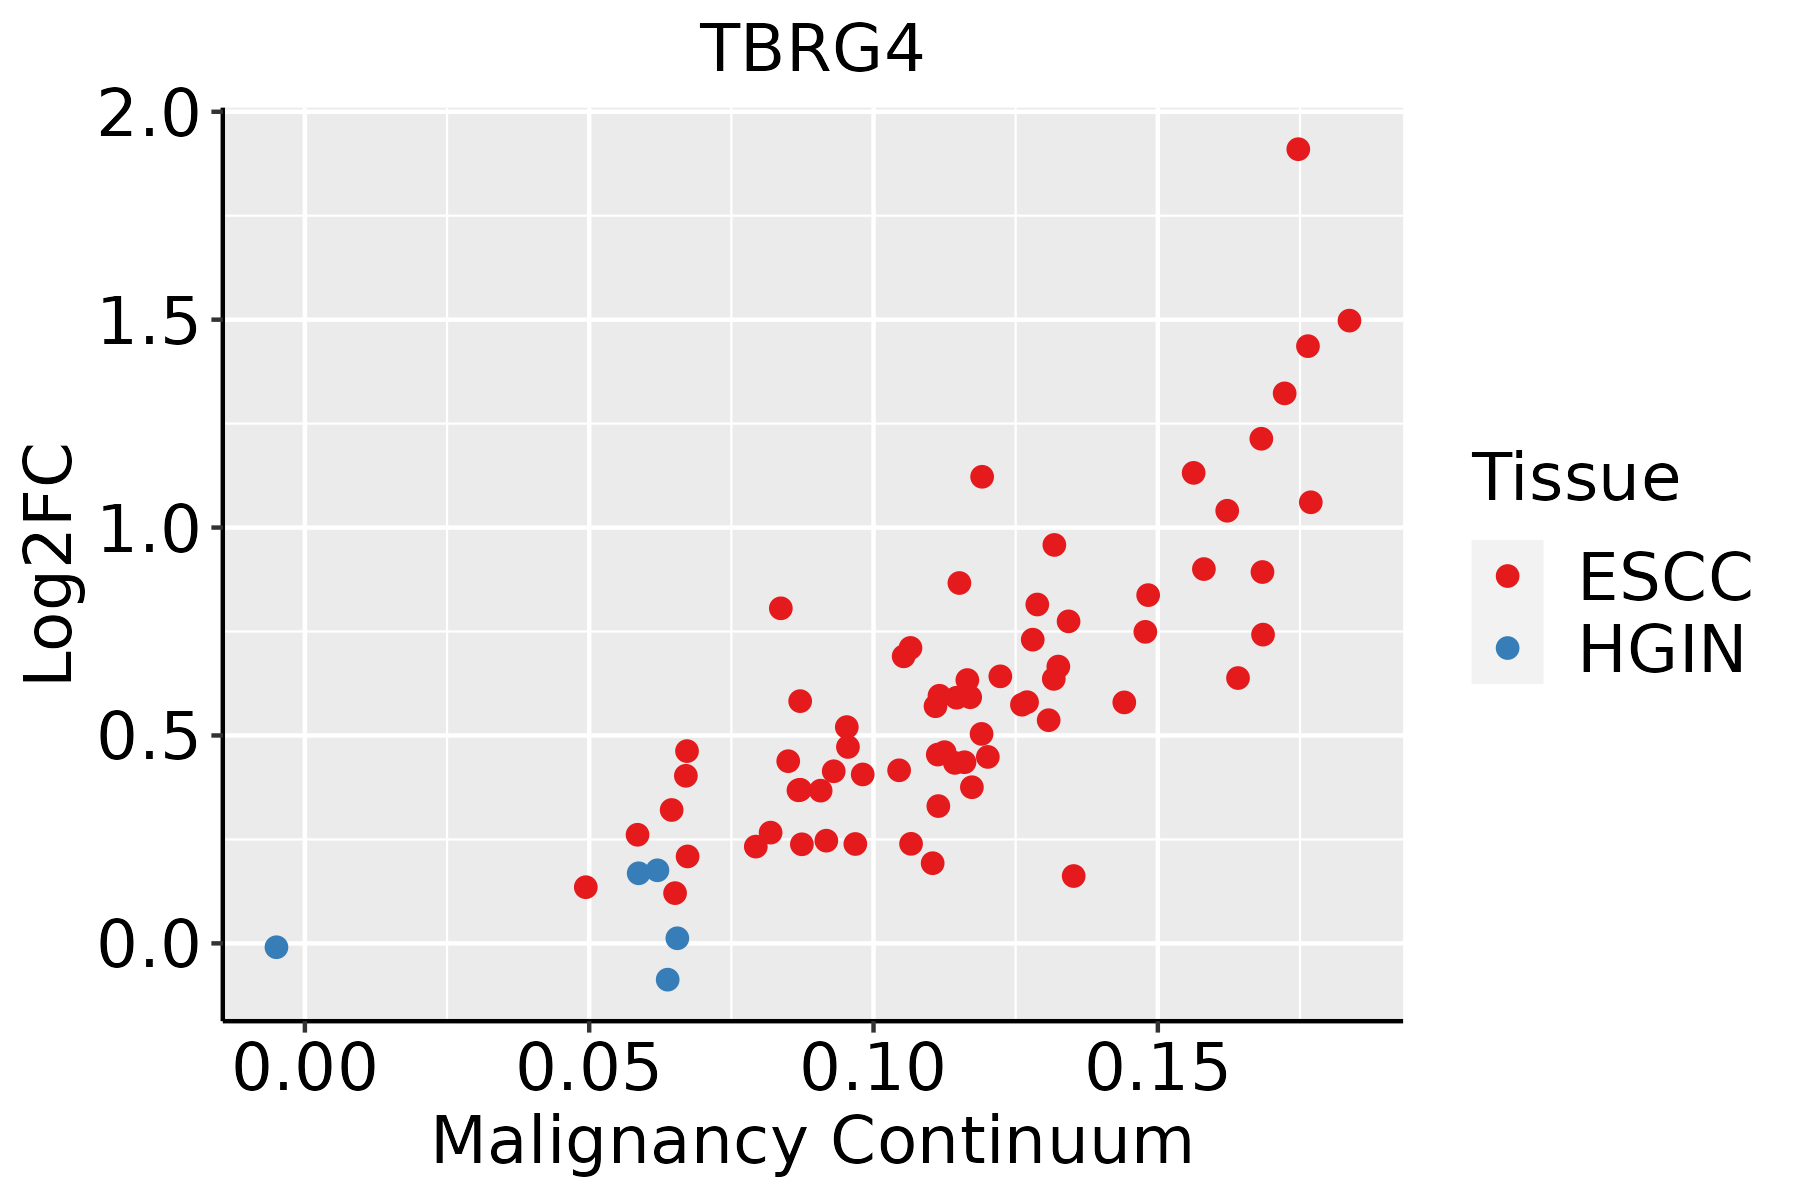
ESCC: Esophageal squamous cell carcinoma
HGIN: High-grade intraepithelial neoplasias
LGIN: Low-grade intraepithelial neoplasias
LiverThe image shows the transcriptomic changes along malignancy continuum.log2FC in expression of this searched gene in stem-like cells from each diseased tissue sample relative to stem-like cells in normal samples in each tissue plotted against the malignancy continuum. Samples are colored based on if they are from different disease stage.
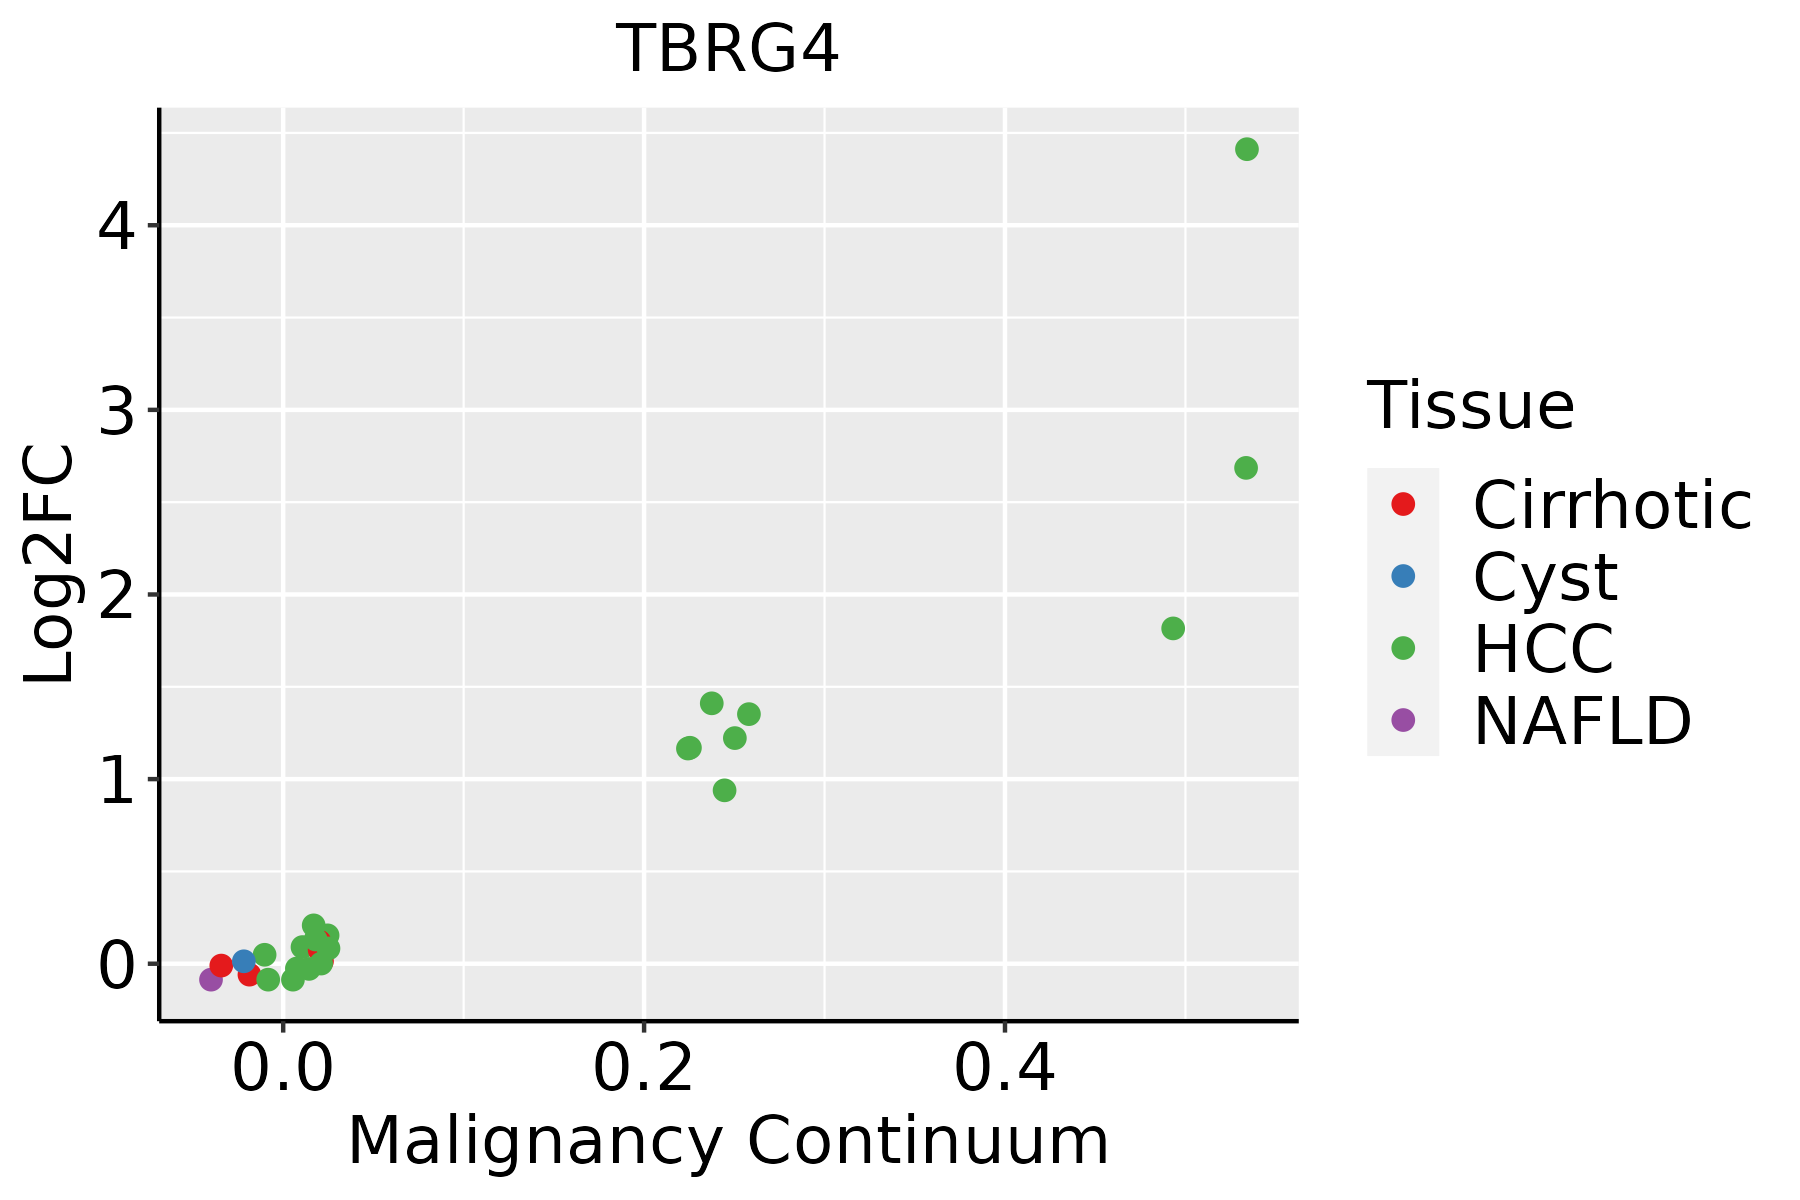
HCC: Hepatocellular carcinoma
NAFLD: Non-alcoholic fatty liver disease
Oral CavityThe image shows the transcriptomic changes along malignancy continuum.log2FC in expression of this searched gene in stem-like cells from each diseased tissue sample relative to stem-like cells in normal samples in each tissue plotted against the malignancy continuum. Samples are colored based on if they are from different disease stage.EOLP: Erosive Oral lichen planus
LP: leukoplakia
NEOLP: Non-erosive oral lichen planus
OSCC: Oral squamous cell carcinoma
SkinThe image shows the transcriptomic changes along malignancy continuum.log2FC in expression of this searched gene in stem-like cells from each diseased tissue sample relative to stem-like cells in normal samples in each tissue plotted against the malignancy continuum. Samples are colored based on if they are from different disease stage.AK: Actinic keratosis
cSCC: Cutaneous squamous cell carcinoma
SCCIS:squamous cell carcinoma in situ
ThyroidThe image shows the transcriptomic changes along malignancy continuum.log2FC in expression of this searched gene in stem-like cells from each diseased tissue sample relative to stem-like cells in normal samples in each tissue plotted against the malignancy continuum. Samples are colored based on if they are from different disease stage.ATC: Anaplastic thyroid cancer
HT: Hashimoto's thyroiditis
PTC: Papillary thyroid cancer
∗log2FC in expression of this searched gene in stem-like cells from each diseased tissue sample relative to stem-like cells in normal samples in each tissue plotted against the malignancy continuum. Samples are colored based on if they are from different disease stage.

Top

Malignant transformation related pathway analysis

check buttonFind out the enriched GO biological processes and KEGG pathways involved in transition from healthy to precancer to cancer
check button Figure of enriched GO biological processes.
TissueDisease StageEnriched GO biological Processes
ColorectumADGO analysis - Figure of enriched GO biological processes: Top 15 enriched GO BP terms are showed in the bar plot of each disease state in each tissue. Each row represents a significant GO biological process which is colored according to the -log10(p.adjust).
ColorectumSERGO analysis - Figure of enriched GO biological processes: Top 15 enriched GO BP terms are showed in the bar plot of each disease state in each tissue. Each row represents a significant GO biological process which is colored according to the -log10(p.adjust).
ColorectumMSSGO analysis - Figure of enriched GO biological processes: Top 15 enriched GO BP terms are showed in the bar plot of each disease state in each tissue. Each row represents a significant GO biological process which is colored according to the -log10(p.adjust).
ColorectumMSI-HGO analysis - Figure of enriched GO biological processes: Top 15 enriched GO BP terms are showed in the bar plot of each disease state in each tissue. Each row represents a significant GO biological process which is colored according to the -log10(p.adjust).
ColorectumFAPGO analysis - Figure of enriched GO biological processes: Top 15 enriched GO BP terms are showed in the bar plot of each disease state in each tissue. Each row represents a significant GO biological process which is colored according to the -log10(p.adjust).
∗Top 15 enriched GO BP terms are showed in the bar plot of each disease state in each tissue. Each row represents a significant GO biological process which is colored according to the -log10(p.adjust).
Page: 1 2 3 4 5 6 7 8 9 

check button Enriched GO biological processes.
GO IDTissueDisease StageDescriptionGene RatioBg Ratiopvaluep.adjustCount
GO:1903311110EsophagusESCCregulation of mRNA metabolic process210/8552288/187233.25e-215.56e-19210
GO:0006401110EsophagusESCCRNA catabolic process204/8552278/187233.39e-215.66e-19204
GO:014005313EsophagusESCCmitochondrial gene expression93/8552108/187231.96e-182.03e-1693
GO:0034655110EsophagusESCCnucleobase-containing compound catabolic process272/8552407/187232.92e-182.90e-16272
GO:0006402110EsophagusESCCmRNA catabolic process170/8552232/187238.70e-188.00e-16170
GO:004670018EsophagusESCCheterocycle catabolic process286/8552445/187231.12e-157.47e-14286
GO:004427019EsophagusESCCcellular nitrogen compound catabolic process288/8552451/187233.03e-151.79e-13288
GO:001943918EsophagusESCCaromatic compound catabolic process295/8552467/187231.09e-145.98e-13295
GO:190136118EsophagusESCCorganic cyclic compound catabolic process307/8552495/187239.99e-144.80e-12307
GO:006101319EsophagusESCCregulation of mRNA catabolic process115/8552166/187235.90e-101.49e-08115
GO:004348719EsophagusESCCregulation of RNA stability117/8552170/187237.91e-101.94e-08117
GO:004348819EsophagusESCCregulation of mRNA stability109/8552158/187232.40e-095.35e-08109
GO:00009592EsophagusESCCmitochondrial RNA metabolic process39/855249/187231.20e-061.49e-0539
GO:00009631EsophagusESCCmitochondrial RNA processing19/855220/187233.83e-064.14e-0519
GO:190136111LiverCirrhoticorganic cyclic compound catabolic process213/4634495/187231.58e-193.67e-17213
GO:001943911LiverCirrhoticaromatic compound catabolic process202/4634467/187236.93e-191.28e-16202
GO:190331111LiverCirrhoticregulation of mRNA metabolic process140/4634288/187231.07e-181.91e-16140
GO:004427011LiverCirrhoticcellular nitrogen compound catabolic process195/4634451/187232.99e-184.94e-16195
GO:004670011LiverCirrhoticheterocycle catabolic process192/4634445/187237.17e-181.12e-15192
GO:003465511LiverCirrhoticnucleobase-containing compound catabolic process171/4634407/187239.07e-159.33e-13171
Page: 1 2 3 4 5 6 

check button Enriched KEGG pathways.
Pathway IDTissueDisease StageDescriptionGene RatioBg Ratiopvaluep.adjustqvalueCount
Page: 1 

Top

Cell-cell communication analysis

check buttonIdentification of potential cell-cell interactions between two cell types and their ligand-receptor pairs for different disease states
LigandReceptorLRpairPathwayTissueDisease Stage
Page: 1 

Top

Single-cell gene regulatory network inference analysis

check buttonFind out the significant the regulons (TFs) and the target genes of each regulon across cell types for different disease states
TFCell TypeTissueDisease StageTarget GeneRSSRegulon Activity
∗The dot plots of a searched regulon are shown for all cell subpopulations in each disease state of each tissue based on the regulon specific score inferred using pySCENIC and by calculating the average expression.
Page: 1 

Top

Somatic mutation of malignant transformation related genes

check buttonAnnotation of somatic variants for genes involved in malignant transformation
Hugo SymbolVariant ClassVariant ClassificationdbSNP RSHGVScHGVSpHGVSp ShortSWISSPROTBIOTYPESIFTPolyPhenTumor Sample BarcodeTissueHistologySexAgeStageTherapy TypesDrugsOutcome
TBRG4SNVMissense_Mutationnovelc.1607N>Ap.Pro536Hisp.P536HQ969Z0protein_codingdeleterious(0.01)probably_damaging(0.915)TCGA-AR-A2LN-01Breastbreast invasive carcinomaFemale>=65I/IIHormone TherapyletrozoleSD
TBRG4SNVMissense_Mutationnovelc.533N>Gp.Lys178Argp.K178RQ969Z0protein_codingtolerated(1)benign(0.001)TCGA-BH-A42T-01Breastbreast invasive carcinomaFemale>=65I/IIUnknownUnknownSD
TBRG4SNVMissense_Mutationrs143689271c.811C>Tp.Arg271Trpp.R271WQ969Z0protein_codingdeleterious(0)probably_damaging(0.999)TCGA-D8-A1J8-01Breastbreast invasive carcinomaFemale>=65I/IIHormone TherapynolvadexSD
TBRG4insertionIn_Frame_Insnovelc.68_69insCACp.Met23delinsIleThrp.M23delinsITQ969Z0protein_codingTCGA-AR-A0TY-01Breastbreast invasive carcinomaFemale<65I/IIUnspecificPaclitaxelPD
TBRG4insertionFrame_Shift_Insnovelc.67_68insGAATTCAp.Met23ArgfsTer17p.M23Rfs*17Q969Z0protein_codingTCGA-AR-A0TY-01Breastbreast invasive carcinomaFemale<65I/IIUnspecificPaclitaxelPD
TBRG4insertionIn_Frame_Insnovelc.1570_1571insGTCp.Ala524delinsGlyProp.A524delinsGPQ969Z0protein_codingTCGA-B6-A0IN-01Breastbreast invasive carcinomaFemale<65I/IIUnknownUnknownPD
TBRG4insertionNonsense_Mutationnovelc.1568_1569insGGCTTCCTGATAGTGGACGTGAGTACCTCTTGGGCAGGp.Asp523GlufsTer4p.D523Efs*4Q969Z0protein_codingTCGA-B6-A0IN-01Breastbreast invasive carcinomaFemale<65I/IIUnknownUnknownPD
TBRG4deletionIn_Frame_Delc.606_659delGCTGCTGGCTGAGCTGCTCACACACCTGGAAAGGCGTTGGACAGAAATTGAAGAp.Glu202_Glu219delp.E202_E219delQ969Z0protein_codingTCGA-E2-A1LH-01Breastbreast invasive carcinomaFemale<65I/IIChemotherapyadriamycinSD
TBRG4SNVMissense_Mutationnovelc.337G>Cp.Glu113Glnp.E113QQ969Z0protein_codingtolerated(0.16)benign(0.08)TCGA-HM-A4S6-01Cervixcervical & endocervical cancerFemale<65III/IVChemotherapycisplatinCR
TBRG4SNVMissense_Mutationc.776N>Ap.Arg259Glnp.R259QQ969Z0protein_codingtolerated(0.05)probably_damaging(0.974)TCGA-A6-3809-01Colorectumcolon adenocarcinomaFemale>=65I/IIUnknownUnknownSD
Page: 1 2 3 4 5 6 7 

Top

Related drugs of malignant transformation related genes

check buttonIdentification of chemicals and drugs interact with genes involved in malignant transfromation
(DGIdb 4.0)
Entrez IDSymbolCategoryInteraction TypesDrug Claim NameDrug NamePMIDs
Page: 1