Schematic overview of the cellular and molecular mechanisms involved in the cancer progression, including the proposed cellular and molecular mechanisms in cancer cells trajectory. AT1: alveolar type 1 cells; AT2: alveolar type 2 cells; AAH: atypical adenomatous hyperplasia; AIS: adenocarcinoma in situ; MIA: minimally invasive adenocarcinoma; IA: invasive adenocarcinoma; EMT: epithelial-mesenchymal transition

Home

Download

Statistics

Help

Contact

Center for Computational Systems Medicine
leaf

Gene summary

leaf

Malignant transformation analysis

leaf

Malignant transformation related pathway analysis

leaf

Cell-cell communication analysis

leaf

Single-cell gene regulatory network inference analysis

leaf

Somatic mutation of malignant transformation related genes

leaf

Related drugs of malignant transformation related genes

Gene: TBRG1

Gene summary for TBRG1

check button Gene summary.

Gene informationSpeciesHuman
Gene symbol

TBRG1

Gene ID

84897

Gene nametransforming growth factor beta regulator 1
Gene AliasNIAM
Cytomap11q24.2
Gene Typeprotein-coding
GO ID

GO:0006260

UniProtAcc

Q3YBR2


Top

Malignant transformation analysis

check button Identification of the aberrant gene expression in precancerous and cancerous lesions by comparing the gene expression of stem-like cells in diseased tissues with normal stem cells
check button Malignant transformation involving gene list.
Entrez IDSymbolReplicatesSpeciesOrganTissueAdj P-valueLog2FCMalignancy
84897TBRG1LZE4THumanEsophagusESCC1.06e-135.33e-010.0811
84897TBRG1LZE7THumanEsophagusESCC2.51e-106.52e-010.0667
84897TBRG1LZE8THumanEsophagusESCC6.86e-082.43e-010.067
84897TBRG1LZE20THumanEsophagusESCC4.00e-093.75e-010.0662
84897TBRG1LZE24THumanEsophagusESCC2.77e-411.25e+000.0596
84897TBRG1P1T-EHumanEsophagusESCC2.09e-106.42e-010.0875
84897TBRG1P2T-EHumanEsophagusESCC4.70e-152.45e-010.1177
84897TBRG1P4T-EHumanEsophagusESCC3.43e-591.37e+000.1323
84897TBRG1P5T-EHumanEsophagusESCC5.96e-324.90e-010.1327
84897TBRG1P8T-EHumanEsophagusESCC3.33e-498.72e-010.0889
84897TBRG1P9T-EHumanEsophagusESCC4.11e-307.08e-010.1131
84897TBRG1P10T-EHumanEsophagusESCC3.39e-377.43e-010.116
84897TBRG1P11T-EHumanEsophagusESCC9.50e-301.15e+000.1426
84897TBRG1P12T-EHumanEsophagusESCC3.52e-549.05e-010.1122
84897TBRG1P15T-EHumanEsophagusESCC2.64e-184.19e-010.1149
84897TBRG1P16T-EHumanEsophagusESCC3.90e-305.42e-010.1153
84897TBRG1P17T-EHumanEsophagusESCC3.91e-044.63e-010.1278
84897TBRG1P19T-EHumanEsophagusESCC6.37e-047.44e-010.1662
84897TBRG1P20T-EHumanEsophagusESCC5.85e-285.68e-010.1124
84897TBRG1P21T-EHumanEsophagusESCC7.36e-551.15e+000.1617
Page: 1 2 3 4 5 6 7 

check button Transcriptomic changes along malignancy continuum.
TissueExpression DynamicsAbbreviation
EsophagusThe image shows the transcriptomic changes along malignancy continuum.log2FC in expression of this searched gene in stem-like cells from each diseased tissue sample relative to stem-like cells in normal samples in each tissue plotted against the malignancy continuum. Samples are colored based on if they are from different disease stage.
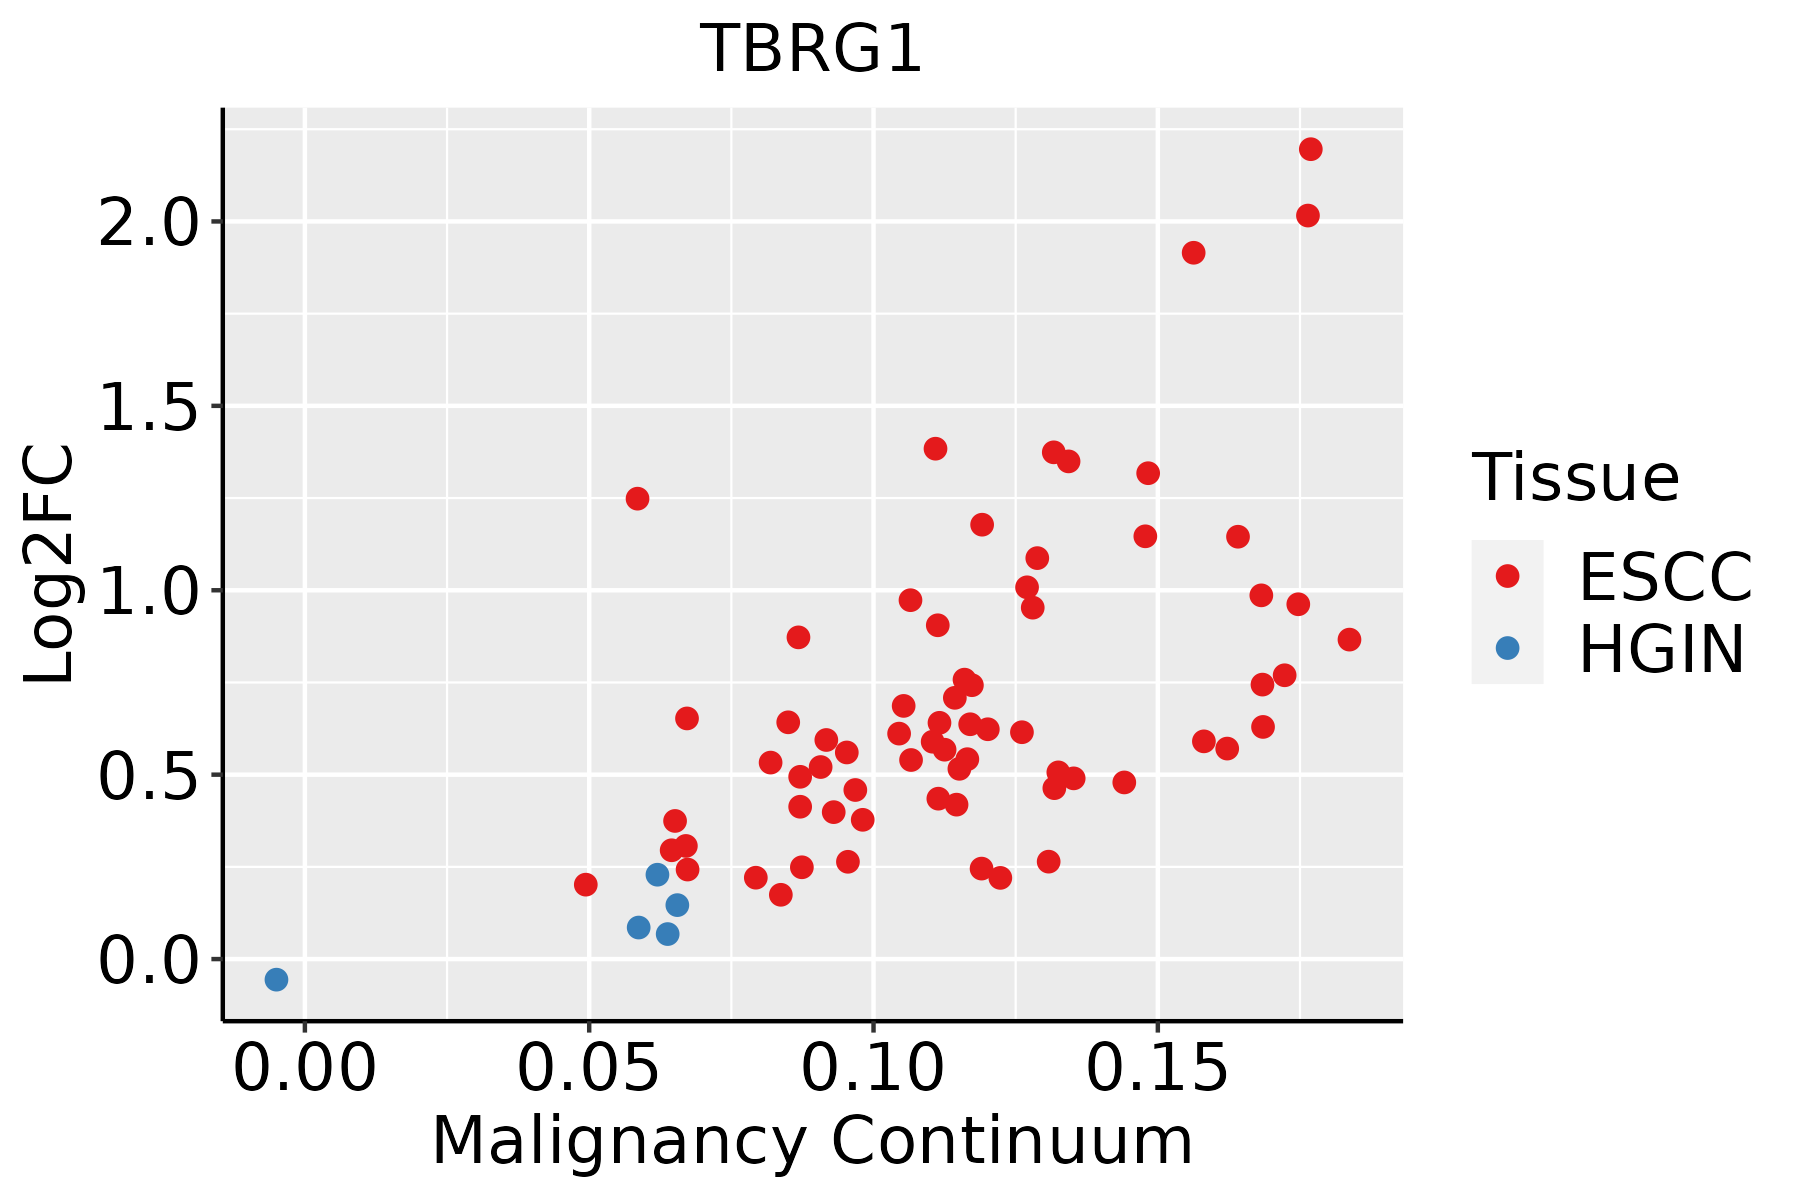
ESCC: Esophageal squamous cell carcinoma
HGIN: High-grade intraepithelial neoplasias
LGIN: Low-grade intraepithelial neoplasias
LiverThe image shows the transcriptomic changes along malignancy continuum.log2FC in expression of this searched gene in stem-like cells from each diseased tissue sample relative to stem-like cells in normal samples in each tissue plotted against the malignancy continuum. Samples are colored based on if they are from different disease stage.
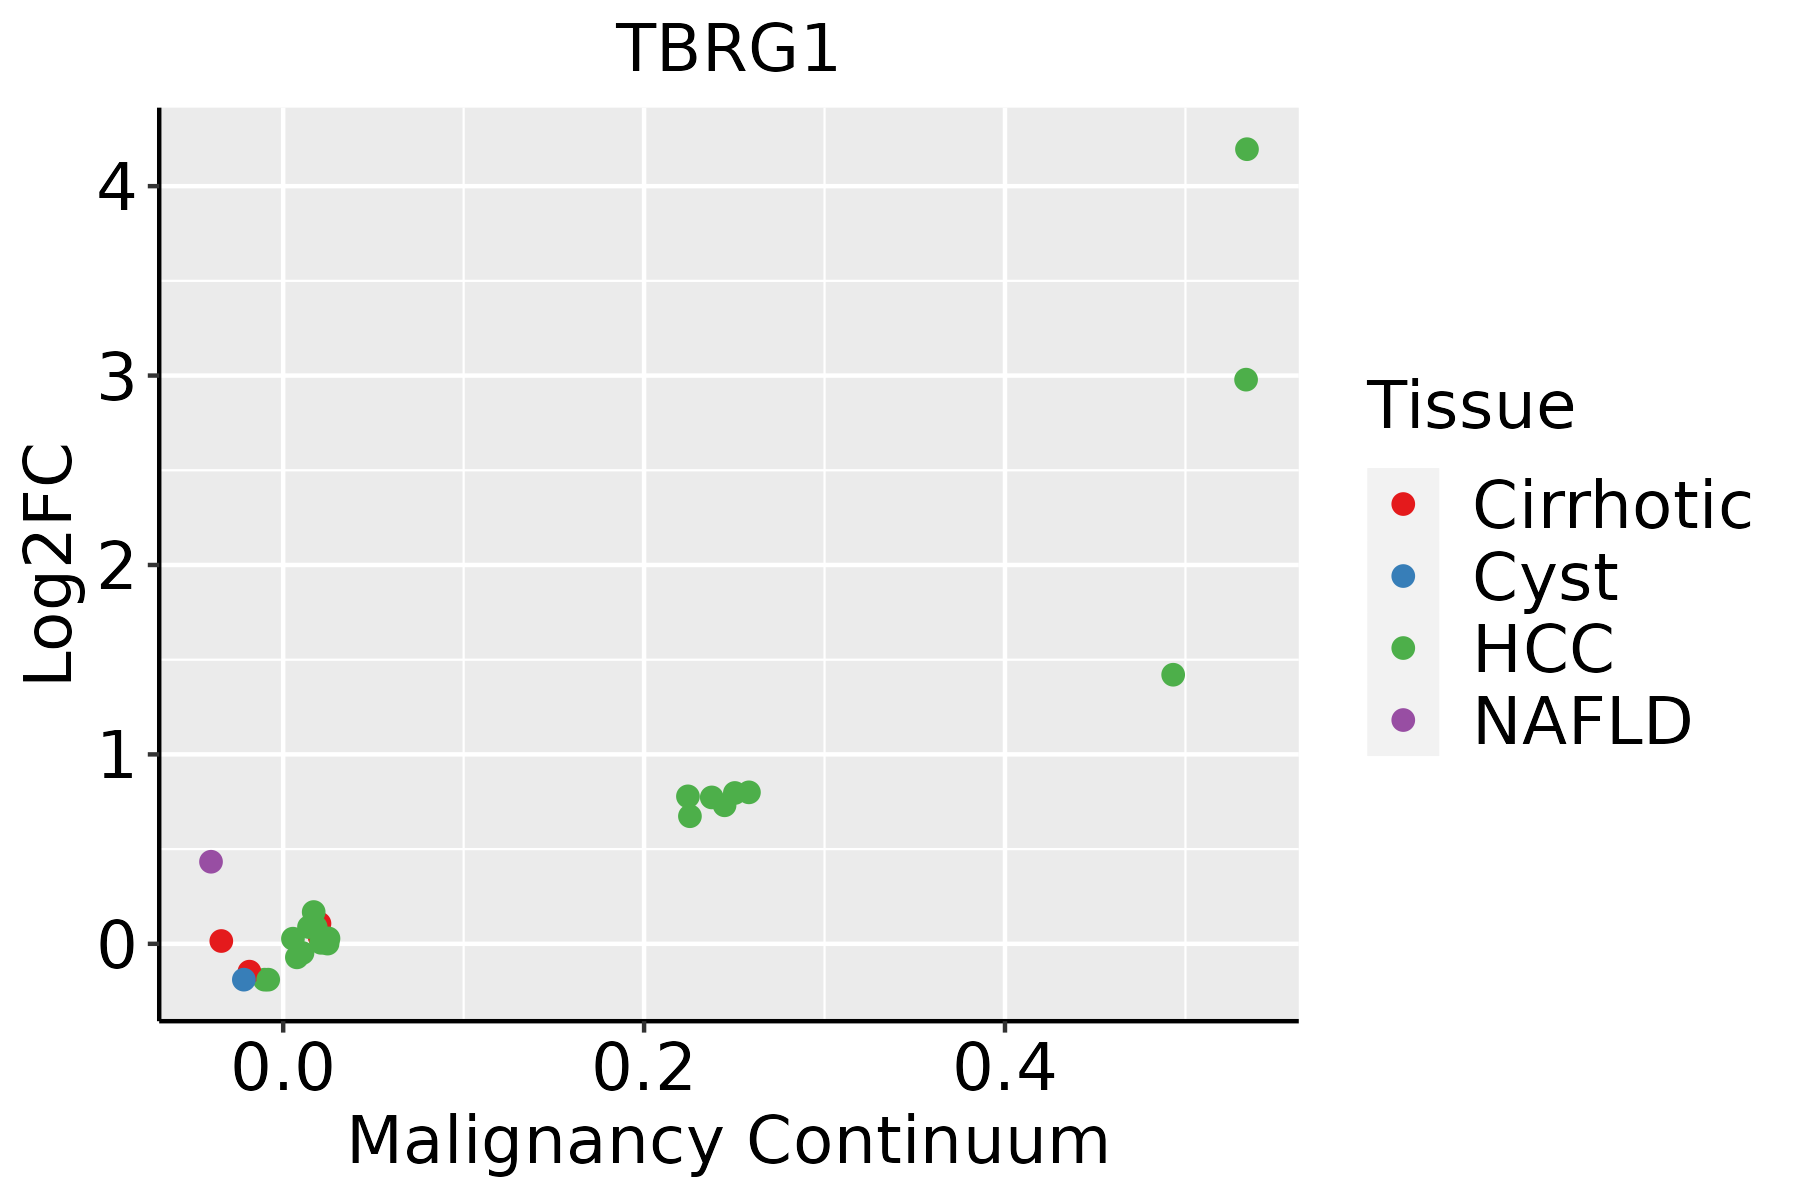
HCC: Hepatocellular carcinoma
NAFLD: Non-alcoholic fatty liver disease
LungThe image shows the transcriptomic changes along malignancy continuum.log2FC in expression of this searched gene in stem-like cells from each diseased tissue sample relative to stem-like cells in normal samples in each tissue plotted against the malignancy continuum. Samples are colored based on if they are from different disease stage.
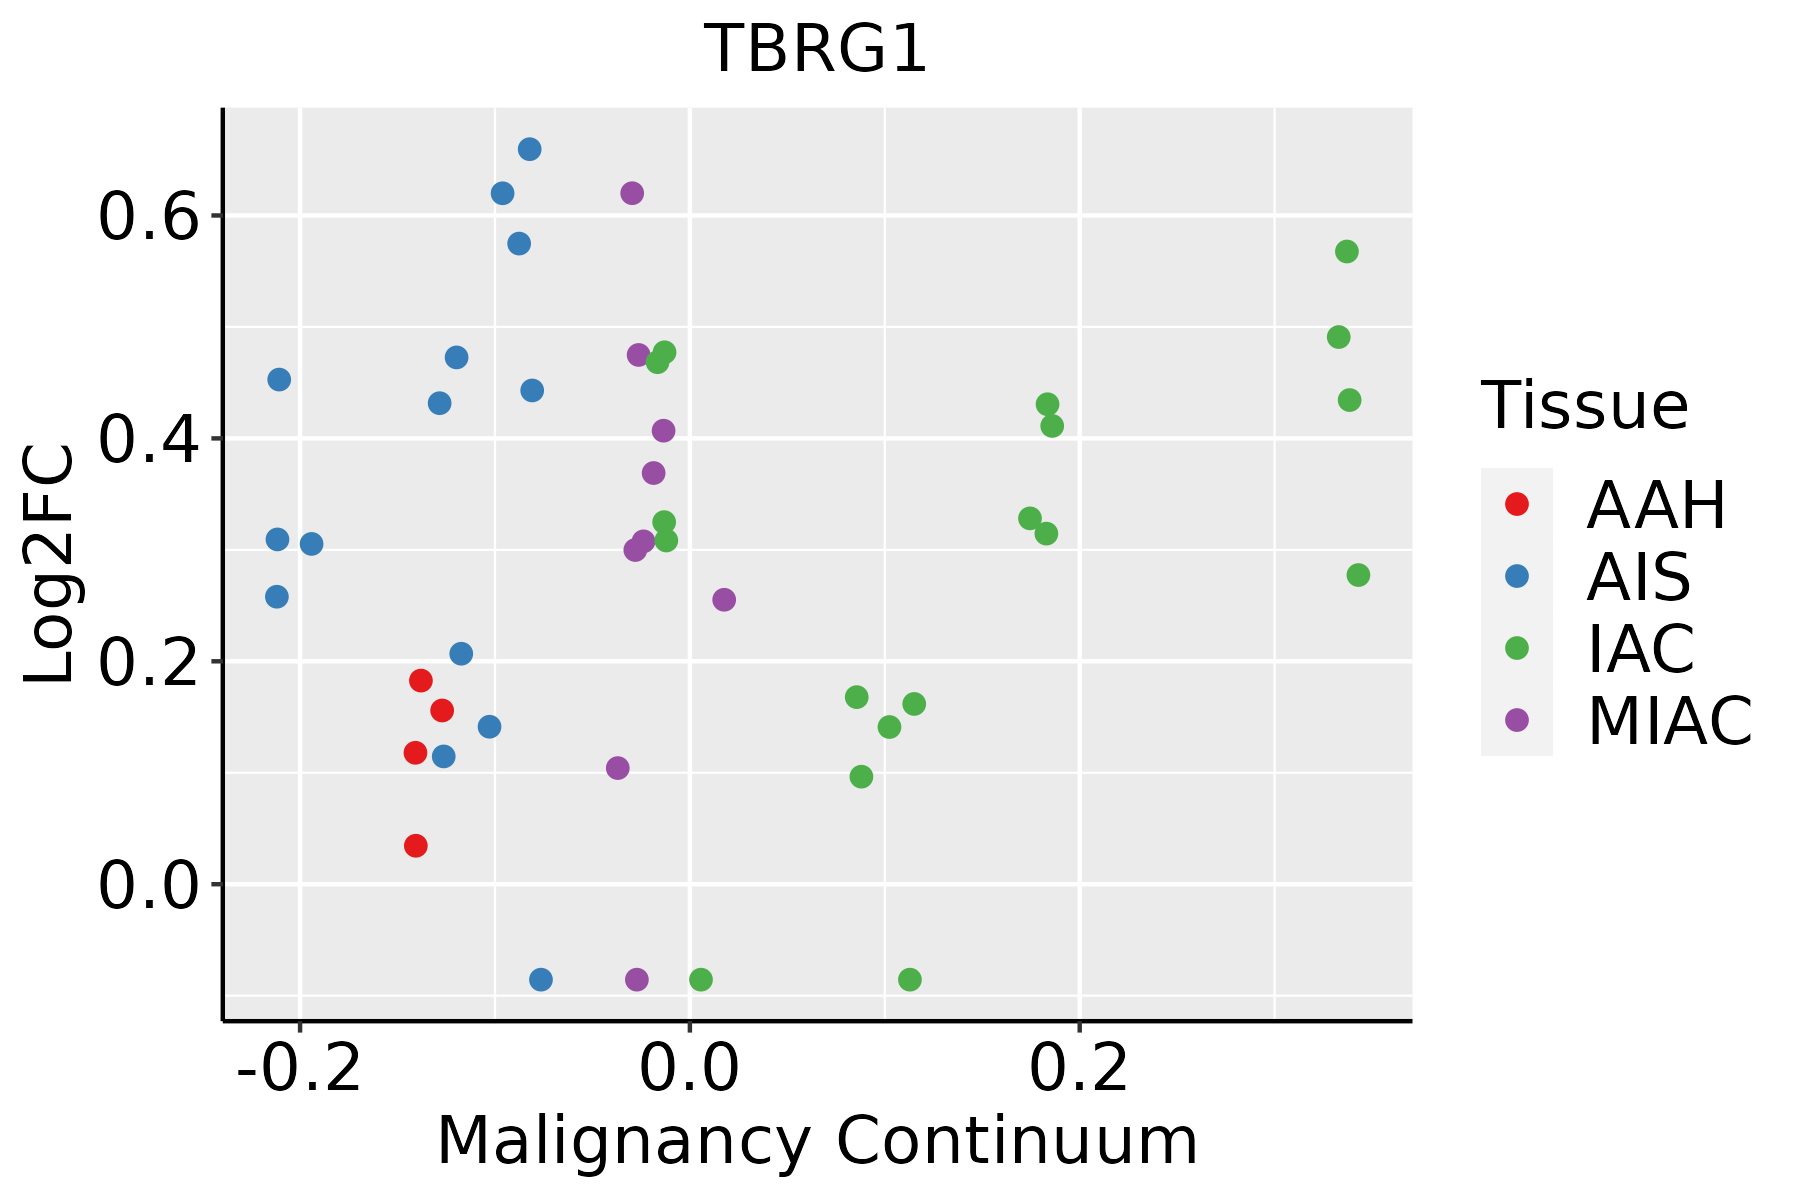
AAH: Atypical adenomatous hyperplasia
AIS: Adenocarcinoma in situ
IAC: Invasive lung adenocarcinoma
MIA: Minimally invasive adenocarcinoma
Oral CavityThe image shows the transcriptomic changes along malignancy continuum.log2FC in expression of this searched gene in stem-like cells from each diseased tissue sample relative to stem-like cells in normal samples in each tissue plotted against the malignancy continuum. Samples are colored based on if they are from different disease stage.
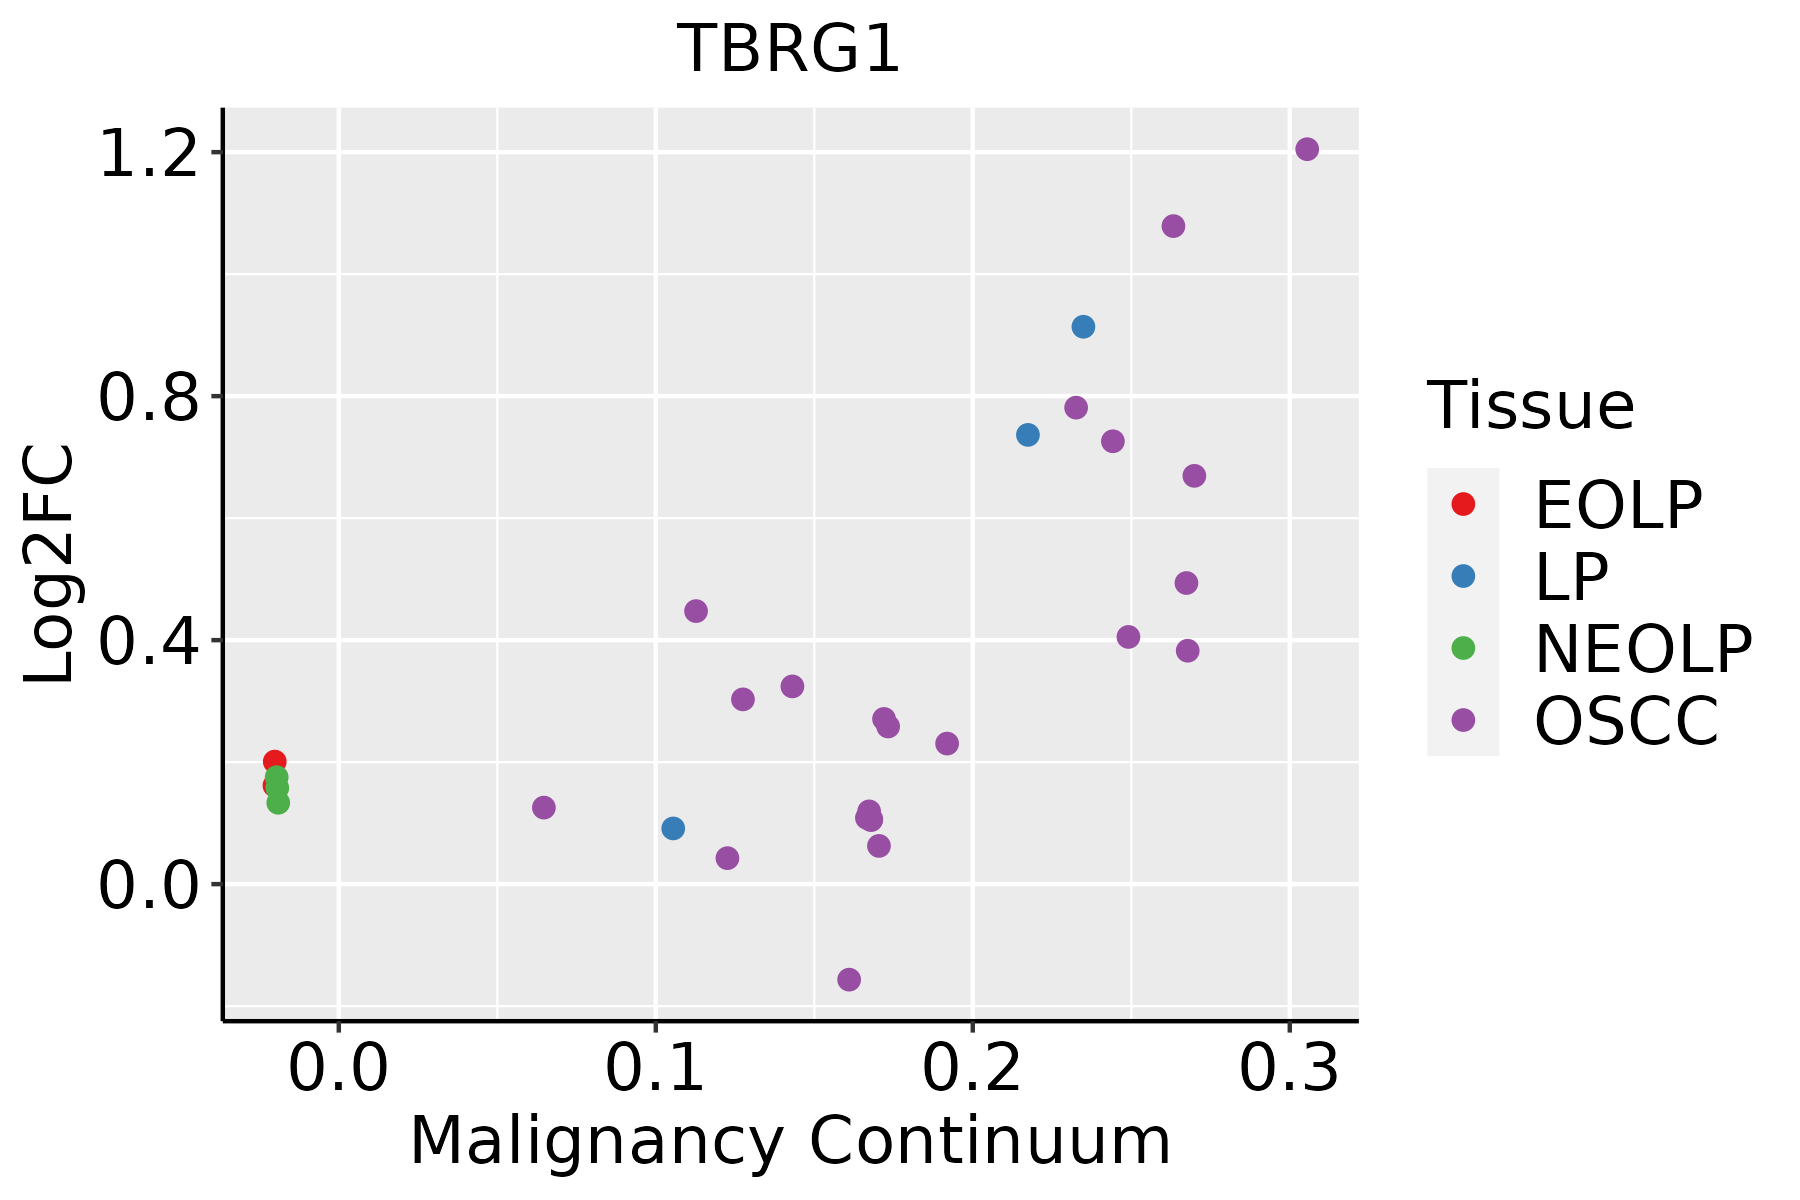
EOLP: Erosive Oral lichen planus
LP: leukoplakia
NEOLP: Non-erosive oral lichen planus
OSCC: Oral squamous cell carcinoma
SkinThe image shows the transcriptomic changes along malignancy continuum.log2FC in expression of this searched gene in stem-like cells from each diseased tissue sample relative to stem-like cells in normal samples in each tissue plotted against the malignancy continuum. Samples are colored based on if they are from different disease stage.
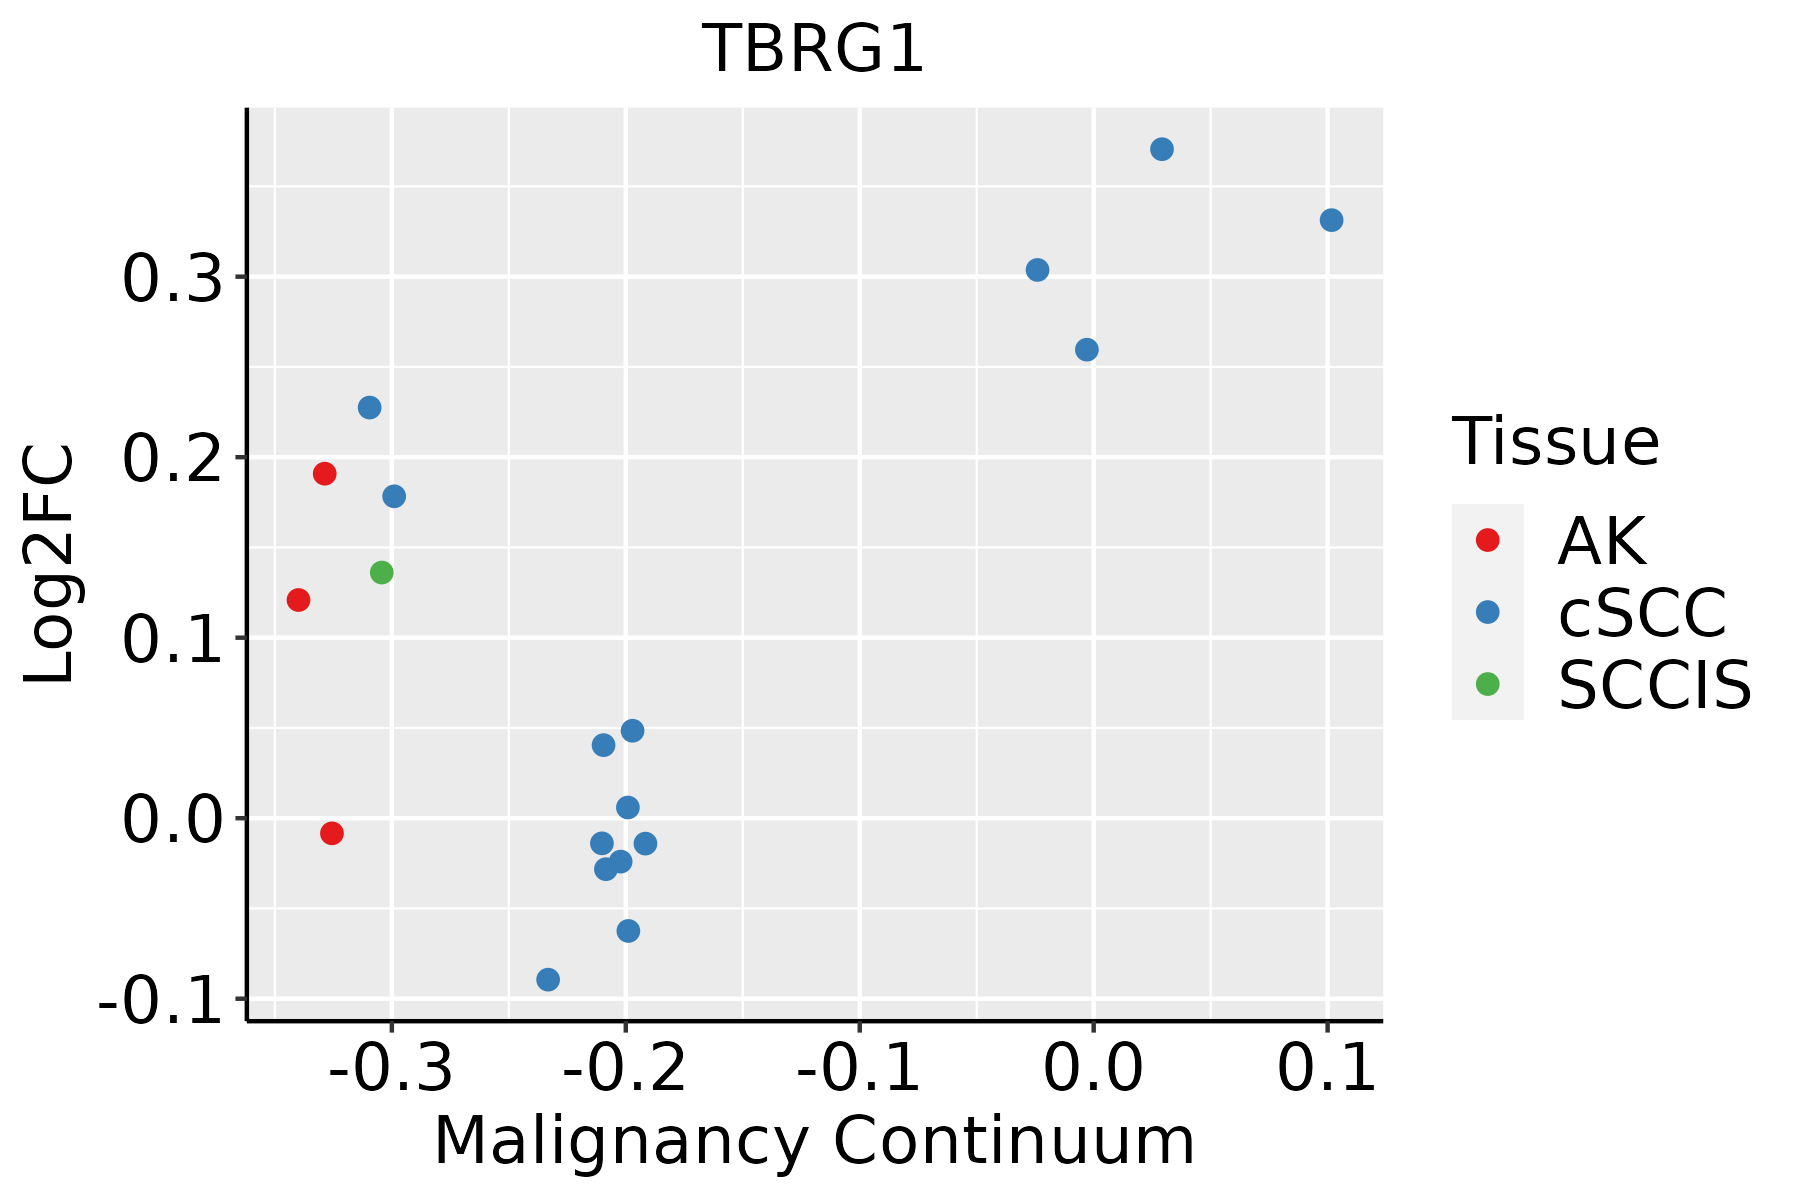
AK: Actinic keratosis
cSCC: Cutaneous squamous cell carcinoma
SCCIS:squamous cell carcinoma in situ
ThyroidThe image shows the transcriptomic changes along malignancy continuum.log2FC in expression of this searched gene in stem-like cells from each diseased tissue sample relative to stem-like cells in normal samples in each tissue plotted against the malignancy continuum. Samples are colored based on if they are from different disease stage.
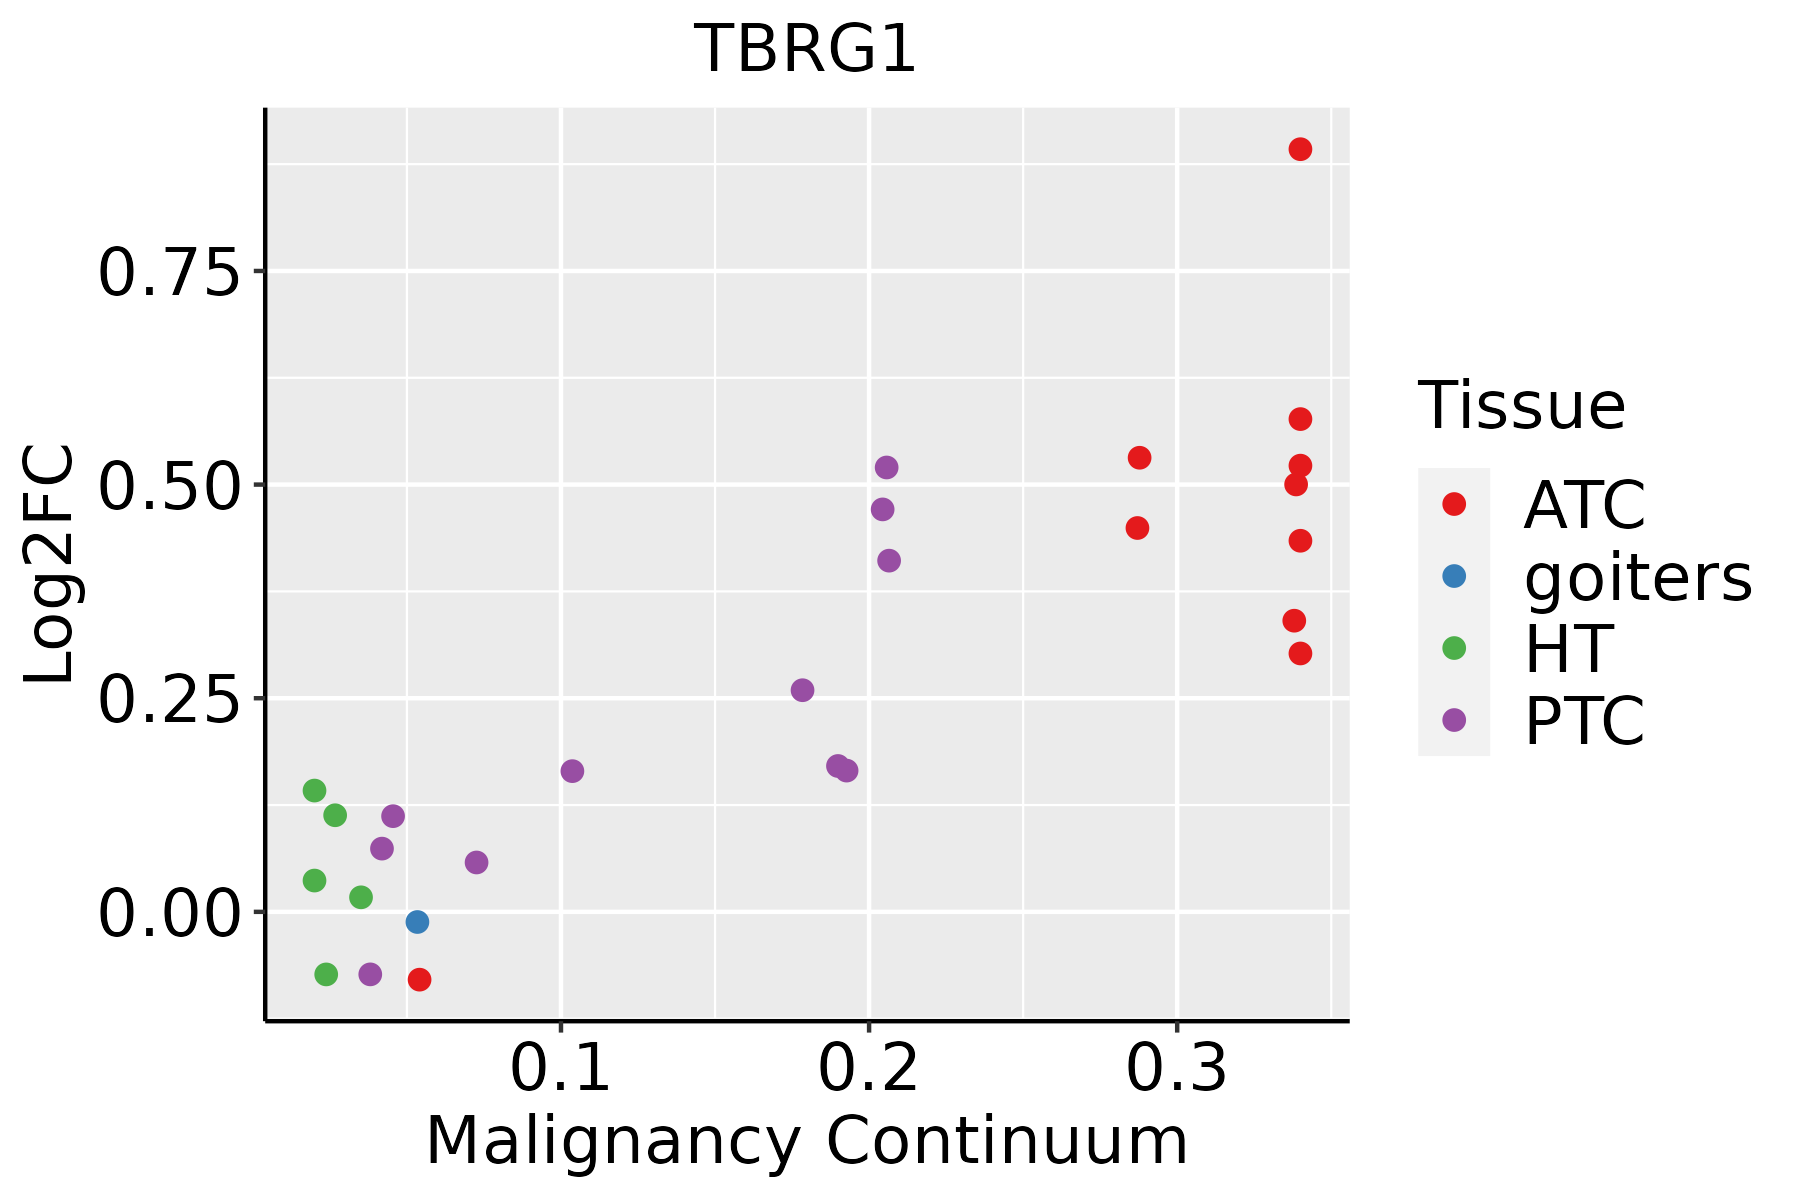
ATC: Anaplastic thyroid cancer
HT: Hashimoto's thyroiditis
PTC: Papillary thyroid cancer
∗log2FC in expression of this searched gene in stem-like cells from each diseased tissue sample relative to stem-like cells in normal samples in each tissue plotted against the malignancy continuum. Samples are colored based on if they are from different disease stage.

Top

Malignant transformation related pathway analysis

check buttonFind out the enriched GO biological processes and KEGG pathways involved in transition from healthy to precancer to cancer
check button Figure of enriched GO biological processes.
TissueDisease StageEnriched GO biological Processes
ColorectumADGO analysis - Figure of enriched GO biological processes: Top 15 enriched GO BP terms are showed in the bar plot of each disease state in each tissue. Each row represents a significant GO biological process which is colored according to the -log10(p.adjust).
ColorectumSERGO analysis - Figure of enriched GO biological processes: Top 15 enriched GO BP terms are showed in the bar plot of each disease state in each tissue. Each row represents a significant GO biological process which is colored according to the -log10(p.adjust).
ColorectumMSSGO analysis - Figure of enriched GO biological processes: Top 15 enriched GO BP terms are showed in the bar plot of each disease state in each tissue. Each row represents a significant GO biological process which is colored according to the -log10(p.adjust).
ColorectumMSI-HGO analysis - Figure of enriched GO biological processes: Top 15 enriched GO BP terms are showed in the bar plot of each disease state in each tissue. Each row represents a significant GO biological process which is colored according to the -log10(p.adjust).
ColorectumFAPGO analysis - Figure of enriched GO biological processes: Top 15 enriched GO BP terms are showed in the bar plot of each disease state in each tissue. Each row represents a significant GO biological process which is colored according to the -log10(p.adjust).
∗Top 15 enriched GO BP terms are showed in the bar plot of each disease state in each tissue. Each row represents a significant GO biological process which is colored according to the -log10(p.adjust).
Page: 1 2 3 4 5 6 7 8 9 

check button Enriched GO biological processes.
GO IDTissueDisease StageDescriptionGene RatioBg Ratiopvaluep.adjustCount
GO:0031647111EsophagusESCCregulation of protein stability223/8552298/187235.76e-251.52e-22223
GO:003450418EsophagusESCCprotein localization to nucleus211/8552290/187234.06e-216.60e-19211
GO:00062604EsophagusESCCDNA replication181/8552260/187233.55e-152.05e-13181
GO:0050821111EsophagusESCCprotein stabilization140/8552191/187236.50e-153.61e-13140
GO:199017316EsophagusESCCprotein localization to nucleoplasm14/855214/187231.71e-051.52e-0414
GO:00316477LiverNAFLDregulation of protein stability61/1882298/187235.00e-084.71e-0661
GO:00508217LiverNAFLDprotein stabilization40/1882191/187235.38e-061.95e-0440
GO:00345046LiverNAFLDprotein localization to nucleus45/1882290/187232.16e-032.10e-0245
GO:003164712LiverCirrhoticregulation of protein stability144/4634298/187236.74e-191.28e-16144
GO:005082112LiverCirrhoticprotein stabilization97/4634191/187236.67e-156.97e-1397
GO:003450411LiverCirrhoticprotein localization to nucleus113/4634290/187235.00e-081.58e-06113
GO:19901733LiverCirrhoticprotein localization to nucleoplasm12/463414/187232.84e-065.08e-0512
GO:003164722LiverHCCregulation of protein stability211/7958298/187232.29e-235.01e-21211
GO:005082122LiverHCCprotein stabilization139/7958191/187231.61e-171.71e-15139
GO:003450421LiverHCCprotein localization to nucleus194/7958290/187232.84e-172.85e-15194
GO:00062601LiverHCCDNA replication146/7958260/187235.68e-067.02e-05146
GO:199017311LiverHCCprotein localization to nucleoplasm13/795814/187231.25e-041.03e-0313
GO:00316478LungIACregulation of protein stability62/2061298/187235.37e-073.32e-0562
GO:00345047LungIACprotein localization to nucleus50/2061290/187238.71e-041.11e-0250
GO:00508218LungIACprotein stabilization34/2061191/187233.21e-032.78e-0234
Page: 1 2 3 

check button Enriched KEGG pathways.
Pathway IDTissueDisease StageDescriptionGene RatioBg Ratiopvaluep.adjustqvalueCount
Page: 1 

Top

Cell-cell communication analysis

check buttonIdentification of potential cell-cell interactions between two cell types and their ligand-receptor pairs for different disease states
LigandReceptorLRpairPathwayTissueDisease Stage
Page: 1 

Top

Single-cell gene regulatory network inference analysis

check buttonFind out the significant the regulons (TFs) and the target genes of each regulon across cell types for different disease states
TFCell TypeTissueDisease StageTarget GeneRSSRegulon Activity
∗The dot plots of a searched regulon are shown for all cell subpopulations in each disease state of each tissue based on the regulon specific score inferred using pySCENIC and by calculating the average expression.
Page: 1 

Top

Somatic mutation of malignant transformation related genes

check buttonAnnotation of somatic variants for genes involved in malignant transformation
Hugo SymbolVariant ClassVariant ClassificationdbSNP RSHGVScHGVSpHGVSp ShortSWISSPROTBIOTYPESIFTPolyPhenTumor Sample BarcodeTissueHistologySexAgeStageTherapy TypesDrugsOutcome
TBRG1SNVMissense_Mutationc.985G>Ap.Asp329Asnp.D329NQ3YBR2protein_codingtolerated(0.15)benign(0.015)TCGA-AC-A23H-01Breastbreast invasive carcinomaFemale>=65I/IIUnknownUnknownPD
TBRG1insertionNonsense_Mutationnovelc.988_989insCATCCACAACCTGATCCAGAGCTGTCCAGGAGCTCGAAAATGCATCAAp.Gly330delinsAlaSerThrThrTerSerArgAlaValGlnGluLeuGluAsnAlaSerArgp.G330delinsASTT*SRAVQELENASRQ3YBR2protein_codingTCGA-A2-A0D1-01Breastbreast invasive carcinomaFemale>=65I/IIChemotherapytaxotereSD
TBRG1insertionFrame_Shift_Insnovelc.681_682insTTCAAAACATTTAAGCAATCCTCACp.Pro228PhefsTer29p.P228Ffs*29Q3YBR2protein_codingTCGA-AN-A04D-01Breastbreast invasive carcinomaFemale<65I/IIUnknownUnknownSD
TBRG1insertionNonsense_Mutationnovelc.1041_1042insCCTCTCTCCTTCCTTCTTGAGGATTGATCTCATTGCTCGp.Ala347_Phe348insProLeuSerPheLeuLeuGluAspTerSerHisCysSerp.A347_F348insPLSFLLED*SHCSQ3YBR2protein_codingTCGA-AO-A0JB-01Breastbreast invasive carcinomaFemale<65III/IVChemotherapycyclophosphamideSD
TBRG1insertionNonsense_Mutationnovelc.281_282insCACTGCCCAGGGCTCGGAAAGAACGATACTTTGAp.Ala95ThrfsTer11p.A95Tfs*11Q3YBR2protein_codingTCGA-B6-A0I8-01Breastbreast invasive carcinomaFemale<65I/IIUnknownUnknownPD
TBRG1SNVMissense_Mutationc.469N>Cp.Cys157Argp.C157RQ3YBR2protein_codingtolerated(0.16)benign(0.013)TCGA-JX-A3Q8-01Cervixcervical & endocervical cancerFemale<65I/IIUnknownUnknownSD
TBRG1SNVMissense_Mutationrs766145884c.538N>Tp.Arg180Trpp.R180WQ3YBR2protein_codingdeleterious(0.01)possibly_damaging(0.727)TCGA-AA-3877-01Colorectumcolon adenocarcinomaFemale>=65I/IIUnknownUnknownSD
TBRG1SNVMissense_Mutationnovelc.857T>Gp.Leu286Argp.L286RQ3YBR2protein_codingtolerated(0.26)benign(0.125)TCGA-AA-A02R-01Colorectumcolon adenocarcinomaFemale>=65I/IIUnknownUnknownPD
TBRG1SNVMissense_Mutationrs761393184c.500G>Ap.Arg167Hisp.R167HQ3YBR2protein_codingdeleterious(0)probably_damaging(0.972)TCGA-AZ-4315-01Colorectumcolon adenocarcinomaMale<65I/IIUnknownUnknownSD
TBRG1SNVMissense_Mutationnovelc.184N>Ap.Leu62Ilep.L62IQ3YBR2protein_codingtolerated(0.17)benign(0.158)TCGA-CA-6717-01Colorectumcolon adenocarcinomaMale<65I/IIChemotherapyoxaliplatinCR
Page: 1 2 3 

Top

Related drugs of malignant transformation related genes

check buttonIdentification of chemicals and drugs interact with genes involved in malignant transfromation
(DGIdb 4.0)
Entrez IDSymbolCategoryInteraction TypesDrug Claim NameDrug NamePMIDs
Page: 1