
|
|||||
|
 | |
| |
| |
| |
| |
| |
|
Gene: TBPL1 |
Gene summary for TBPL1 |
| Gene information | Species | Human | Gene symbol | TBPL1 | Gene ID | 9519 |
| Gene name | TATA-box binding protein like 1 | |
| Gene Alias | MGC:8389 | |
| Cytomap | 6q23.2 | |
| Gene Type | protein-coding | GO ID | GO:0000003 | UniProtAcc | P62380 |
Top |
Malignant transformation analysis |
| Identification of the aberrant gene expression in precancerous and cancerous lesions by comparing the gene expression of stem-like cells in diseased tissues with normal stem cells |
| Entrez ID | Symbol | Replicates | Species | Organ | Tissue | Adj P-value | Log2FC | Malignancy |
| 9519 | TBPL1 | LZE4T | Human | Esophagus | ESCC | 1.87e-17 | 5.71e-01 | 0.0811 |
| 9519 | TBPL1 | LZE7T | Human | Esophagus | ESCC | 8.91e-13 | 7.76e-01 | 0.0667 |
| 9519 | TBPL1 | LZE8T | Human | Esophagus | ESCC | 5.48e-10 | 2.95e-01 | 0.067 |
| 9519 | TBPL1 | LZE20T | Human | Esophagus | ESCC | 1.03e-03 | 1.59e-01 | 0.0662 |
| 9519 | TBPL1 | LZE22D1 | Human | Esophagus | HGIN | 3.79e-02 | 8.12e-02 | 0.0595 |
| 9519 | TBPL1 | LZE24T | Human | Esophagus | ESCC | 2.26e-22 | 5.47e-01 | 0.0596 |
| 9519 | TBPL1 | LZE21T | Human | Esophagus | ESCC | 9.89e-03 | 4.08e-01 | 0.0655 |
| 9519 | TBPL1 | LZE6T | Human | Esophagus | ESCC | 4.97e-09 | 3.15e-01 | 0.0845 |
| 9519 | TBPL1 | P1T-E | Human | Esophagus | ESCC | 2.16e-07 | 4.29e-01 | 0.0875 |
| 9519 | TBPL1 | P2T-E | Human | Esophagus | ESCC | 1.22e-32 | 5.27e-01 | 0.1177 |
| 9519 | TBPL1 | P4T-E | Human | Esophagus | ESCC | 2.50e-43 | 8.17e-01 | 0.1323 |
| 9519 | TBPL1 | P5T-E | Human | Esophagus | ESCC | 4.10e-22 | 5.45e-01 | 0.1327 |
| 9519 | TBPL1 | P8T-E | Human | Esophagus | ESCC | 5.07e-24 | 5.10e-01 | 0.0889 |
| 9519 | TBPL1 | P9T-E | Human | Esophagus | ESCC | 2.17e-22 | 4.86e-01 | 0.1131 |
| 9519 | TBPL1 | P10T-E | Human | Esophagus | ESCC | 1.02e-27 | 5.28e-01 | 0.116 |
| 9519 | TBPL1 | P11T-E | Human | Esophagus | ESCC | 4.09e-14 | 5.15e-01 | 0.1426 |
| 9519 | TBPL1 | P12T-E | Human | Esophagus | ESCC | 3.89e-24 | 4.94e-01 | 0.1122 |
| 9519 | TBPL1 | P15T-E | Human | Esophagus | ESCC | 3.01e-36 | 7.95e-01 | 0.1149 |
| 9519 | TBPL1 | P16T-E | Human | Esophagus | ESCC | 5.19e-24 | 5.77e-01 | 0.1153 |
| 9519 | TBPL1 | P17T-E | Human | Esophagus | ESCC | 2.11e-03 | 2.48e-01 | 0.1278 |
| Page: 1 2 3 4 5 |
| Tissue | Expression Dynamics | Abbreviation |
| Esophagus | 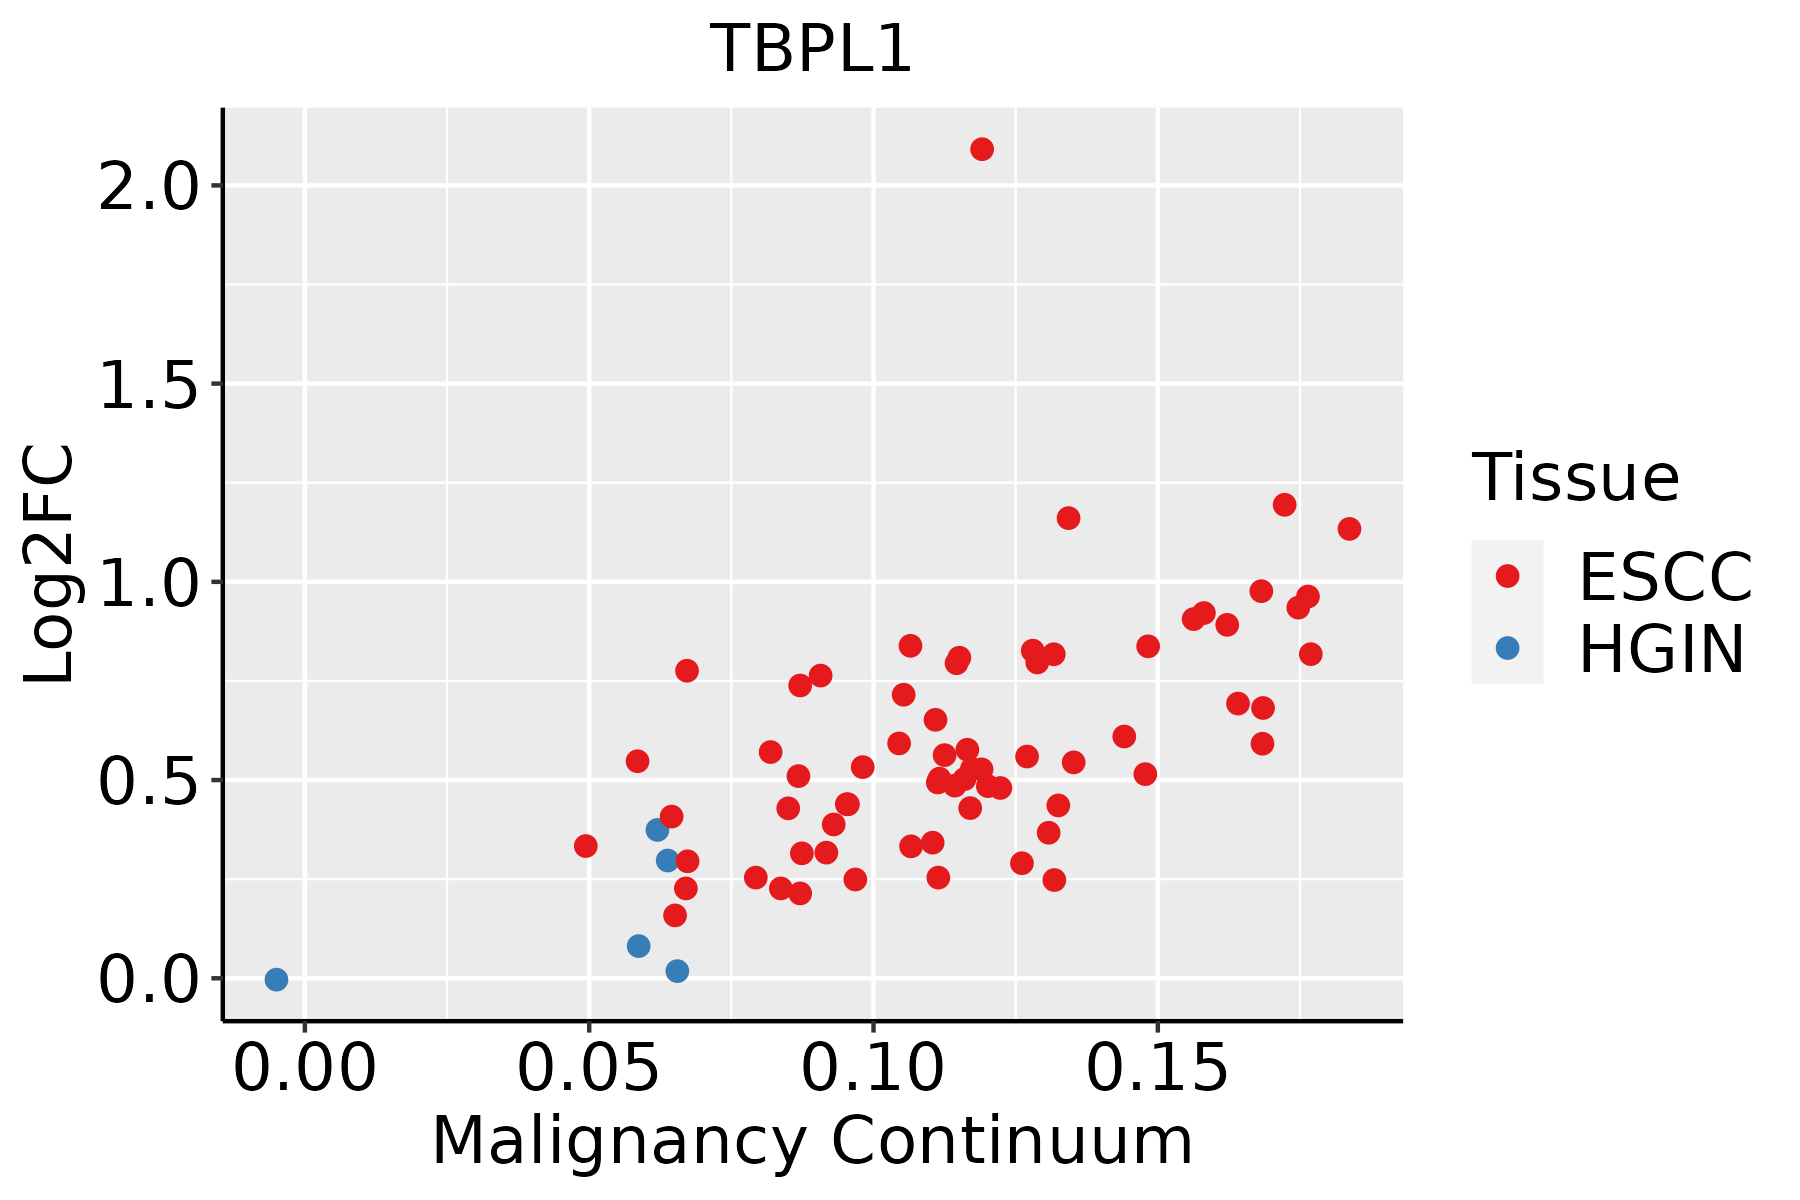 | ESCC: Esophageal squamous cell carcinoma |
| HGIN: High-grade intraepithelial neoplasias | ||
| LGIN: Low-grade intraepithelial neoplasias | ||
| Liver | 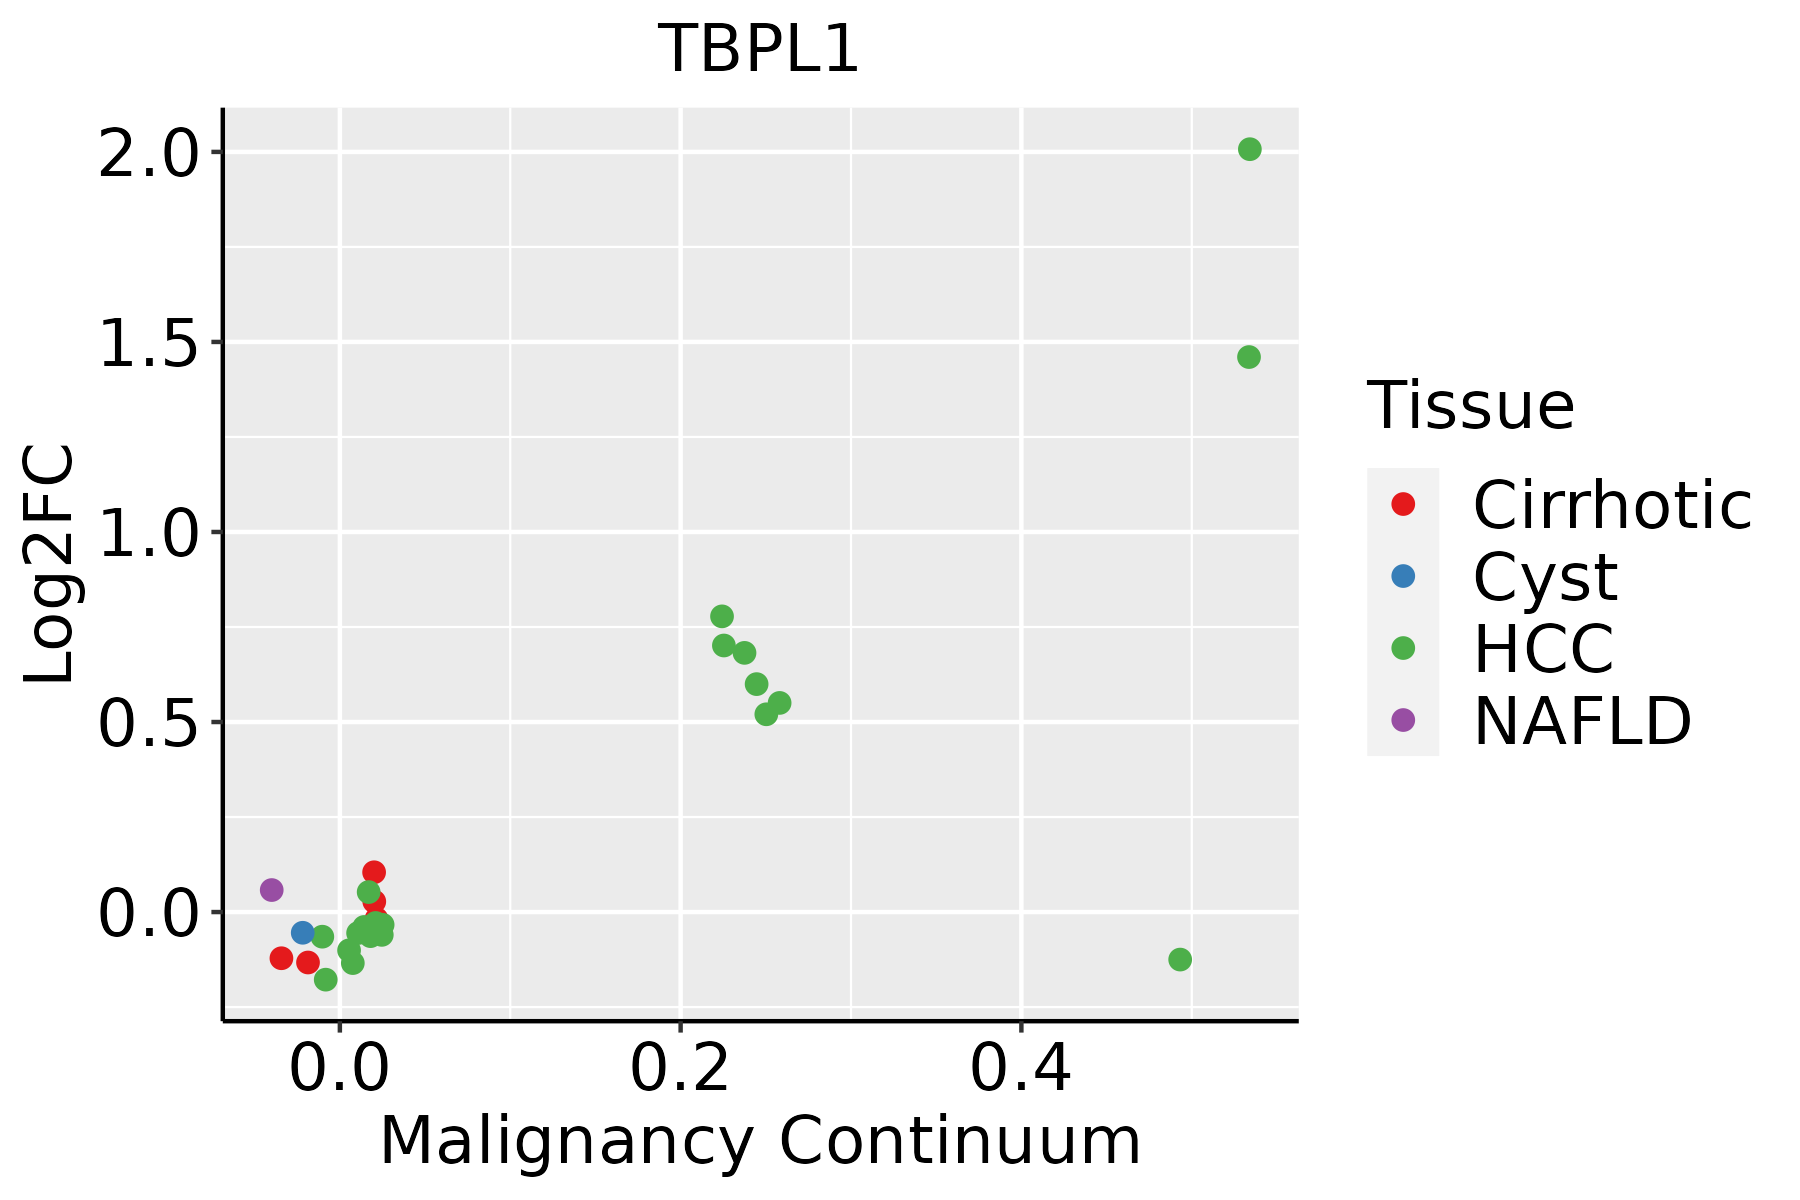 | HCC: Hepatocellular carcinoma |
| NAFLD: Non-alcoholic fatty liver disease | ||
| Oral Cavity |  | EOLP: Erosive Oral lichen planus |
| LP: leukoplakia | ||
| NEOLP: Non-erosive oral lichen planus | ||
| OSCC: Oral squamous cell carcinoma |
| ∗log2FC in expression of this searched gene in stem-like cells from each diseased tissue sample relative to stem-like cells in normal samples in each tissue plotted against the malignancy continuum. Samples are colored based on if they are from different disease stage. |
Top |
Malignant transformation related pathway analysis |
| Find out the enriched GO biological processes and KEGG pathways involved in transition from healthy to precancer to cancer |
| Tissue | Disease Stage | Enriched GO biological Processes |
| Colorectum | AD |  |
| Colorectum | SER |  |
| Colorectum | MSS |  |
| Colorectum | MSI-H |  |
| Colorectum | FAP |  |
| ∗Top 15 enriched GO BP terms are showed in the bar plot of each disease state in each tissue. Each row represents a significant GO biological process which is colored according to the -log10(p.adjust). |
| Page: 1 2 3 4 5 6 7 8 9 |
| GO ID | Tissue | Disease Stage | Description | Gene Ratio | Bg Ratio | pvalue | p.adjust | Count |
| GO:000914120 | Esophagus | HGIN | nucleoside triphosphate metabolic process | 39/2587 | 112/18723 | 1.56e-08 | 9.53e-07 | 39 |
| GO:000914218 | Esophagus | HGIN | nucleoside triphosphate biosynthetic process | 32/2587 | 85/18723 | 3.61e-08 | 2.04e-06 | 32 |
| GO:00196924 | Esophagus | HGIN | deoxyribose phosphate metabolic process | 16/2587 | 42/18723 | 7.90e-05 | 1.76e-03 | 16 |
| GO:00160509 | Esophagus | HGIN | vesicle organization | 65/2587 | 300/18723 | 1.24e-04 | 2.54e-03 | 65 |
| GO:00092624 | Esophagus | HGIN | deoxyribonucleotide metabolic process | 16/2587 | 44/18723 | 1.51e-04 | 2.97e-03 | 16 |
| GO:00093944 | Esophagus | HGIN | 2'-deoxyribonucleotide metabolic process | 15/2587 | 40/18723 | 1.62e-04 | 3.16e-03 | 15 |
| GO:00069975 | Esophagus | HGIN | nucleus organization | 34/2587 | 133/18723 | 2.20e-04 | 4.00e-03 | 34 |
| GO:000911720 | Esophagus | HGIN | nucleotide metabolic process | 92/2587 | 489/18723 | 1.11e-03 | 1.36e-02 | 92 |
| GO:00091659 | Esophagus | HGIN | nucleotide biosynthetic process | 53/2587 | 254/18723 | 1.24e-03 | 1.49e-02 | 53 |
| GO:000675320 | Esophagus | HGIN | nucleoside phosphate metabolic process | 93/2587 | 497/18723 | 1.25e-03 | 1.49e-02 | 93 |
| GO:19012939 | Esophagus | HGIN | nucleoside phosphate biosynthetic process | 53/2587 | 256/18723 | 1.49e-03 | 1.73e-02 | 53 |
| GO:00063523 | Esophagus | HGIN | DNA-templated transcription, initiation | 30/2587 | 130/18723 | 2.86e-03 | 2.79e-02 | 30 |
| GO:00092193 | Esophagus | HGIN | pyrimidine deoxyribonucleotide metabolic process | 9/2587 | 24/18723 | 3.33e-03 | 3.12e-02 | 9 |
| GO:00092005 | Esophagus | HGIN | deoxyribonucleoside triphosphate metabolic process | 7/2587 | 17/18723 | 5.21e-03 | 4.30e-02 | 7 |
| GO:001605014 | Esophagus | ESCC | vesicle organization | 211/8552 | 300/18723 | 2.85e-18 | 2.87e-16 | 211 |
| GO:000699713 | Esophagus | ESCC | nucleus organization | 96/8552 | 133/18723 | 4.66e-10 | 1.21e-08 | 96 |
| GO:0006753110 | Esophagus | ESCC | nucleoside phosphate metabolic process | 288/8552 | 497/18723 | 1.80e-08 | 3.50e-07 | 288 |
| GO:0009117111 | Esophagus | ESCC | nucleotide metabolic process | 282/8552 | 489/18723 | 4.70e-08 | 8.50e-07 | 282 |
| GO:0009141111 | Esophagus | ESCC | nucleoside triphosphate metabolic process | 78/8552 | 112/18723 | 2.36e-07 | 3.59e-06 | 78 |
| GO:000635211 | Esophagus | ESCC | DNA-templated transcription, initiation | 86/8552 | 130/18723 | 1.88e-06 | 2.19e-05 | 86 |
| Page: 1 2 3 4 5 6 |
| Pathway ID | Tissue | Disease Stage | Description | Gene Ratio | Bg Ratio | pvalue | p.adjust | qvalue | Count |
| hsa0501630 | Esophagus | HGIN | Huntington disease | 129/1383 | 306/8465 | 6.81e-28 | 7.41e-26 | 5.88e-26 | 129 |
| hsa052039 | Esophagus | HGIN | Viral carcinogenesis | 53/1383 | 204/8465 | 2.58e-04 | 2.71e-03 | 2.15e-03 | 53 |
| hsa0516639 | Esophagus | HGIN | Human T-cell leukemia virus 1 infection | 51/1383 | 222/8465 | 5.84e-03 | 4.05e-02 | 3.22e-02 | 51 |
| hsa05016113 | Esophagus | HGIN | Huntington disease | 129/1383 | 306/8465 | 6.81e-28 | 7.41e-26 | 5.88e-26 | 129 |
| hsa0520315 | Esophagus | HGIN | Viral carcinogenesis | 53/1383 | 204/8465 | 2.58e-04 | 2.71e-03 | 2.15e-03 | 53 |
| hsa05166114 | Esophagus | HGIN | Human T-cell leukemia virus 1 infection | 51/1383 | 222/8465 | 5.84e-03 | 4.05e-02 | 3.22e-02 | 51 |
| hsa05016210 | Esophagus | ESCC | Huntington disease | 226/4205 | 306/8465 | 1.38e-18 | 8.72e-17 | 4.46e-17 | 226 |
| hsa05166211 | Esophagus | ESCC | Human T-cell leukemia virus 1 infection | 164/4205 | 222/8465 | 8.13e-14 | 2.09e-12 | 1.07e-12 | 164 |
| hsa0516510 | Esophagus | ESCC | Human papillomavirus infection | 215/4205 | 331/8465 | 7.86e-09 | 7.12e-08 | 3.65e-08 | 215 |
| hsa0520325 | Esophagus | ESCC | Viral carcinogenesis | 137/4205 | 204/8465 | 2.47e-07 | 1.88e-06 | 9.62e-07 | 137 |
| hsa0501728 | Esophagus | ESCC | Spinocerebellar ataxia | 94/4205 | 143/8465 | 6.77e-05 | 2.90e-04 | 1.48e-04 | 94 |
| hsa030222 | Esophagus | ESCC | Basal transcription factors | 35/4205 | 45/8465 | 1.01e-04 | 4.06e-04 | 2.08e-04 | 35 |
| hsa0501638 | Esophagus | ESCC | Huntington disease | 226/4205 | 306/8465 | 1.38e-18 | 8.72e-17 | 4.46e-17 | 226 |
| hsa05166310 | Esophagus | ESCC | Human T-cell leukemia virus 1 infection | 164/4205 | 222/8465 | 8.13e-14 | 2.09e-12 | 1.07e-12 | 164 |
| hsa0516515 | Esophagus | ESCC | Human papillomavirus infection | 215/4205 | 331/8465 | 7.86e-09 | 7.12e-08 | 3.65e-08 | 215 |
| hsa0520335 | Esophagus | ESCC | Viral carcinogenesis | 137/4205 | 204/8465 | 2.47e-07 | 1.88e-06 | 9.62e-07 | 137 |
| hsa0501736 | Esophagus | ESCC | Spinocerebellar ataxia | 94/4205 | 143/8465 | 6.77e-05 | 2.90e-04 | 1.48e-04 | 94 |
| hsa0302211 | Esophagus | ESCC | Basal transcription factors | 35/4205 | 45/8465 | 1.01e-04 | 4.06e-04 | 2.08e-04 | 35 |
| hsa0501614 | Liver | Cirrhotic | Huntington disease | 172/2530 | 306/8465 | 1.65e-22 | 1.10e-20 | 6.77e-21 | 172 |
| hsa05165 | Liver | Cirrhotic | Human papillomavirus infection | 124/2530 | 331/8465 | 1.55e-03 | 7.83e-03 | 4.83e-03 | 124 |
| Page: 1 2 3 |
Top |
Cell-cell communication analysis |
| Identification of potential cell-cell interactions between two cell types and their ligand-receptor pairs for different disease states |
| Ligand | Receptor | LRpair | Pathway | Tissue | Disease Stage |
| Page: 1 |
Top |
Single-cell gene regulatory network inference analysis |
| Find out the significant the regulons (TFs) and the target genes of each regulon across cell types for different disease states |
| TF | Cell Type | Tissue | Disease Stage | Target Gene | RSS | Regulon Activity |
| TBPL1 | TRANS | Cervix | N_HPV | U62317.4,SYNM,TUBB, etc. | 1.24e-01 |  |
| TBPL1 | MYOFIB | Cervix | ADJ | SCN4B,PEAR1,SLC5A3, etc. | 3.88e-01 |  |
| TBPL1 | MYOFIB | Cervix | CC | SCN4B,PEAR1,SLC5A3, etc. | 3.13e-01 |  |
| TBPL1 | INCAF | Colorectum | SER | GRIK1,BCKDHB,CEP85L, etc. | 1.99e-01 |  |
| TBPL1 | NK | Oral cavity | Healthy | SLC12A6,DEDD2,LRRC32, etc. | 1.90e-01 |  |
| TBPL1 | MAST | Oral cavity | Healthy | SLC12A6,DEDD2,LRRC32, etc. | 2.20e-01 | |
| TBPL1 | CD8TCM | Oral cavity | NEOLP | SLC12A6,DEDD2,LRRC32, etc. | 1.45e-02 |  |
| TBPL1 | M1MAC | Stomach | ADJ | ADRB2,TFB1M,RNF144A, etc. | 8.23e-02 |  |
| TBPL1 | TH17 | Stomach | CAG | ADRB2,TFB1M,RNF144A, etc. | 1.95e-02 |  |
| TBPL1 | M1MAC | Stomach | CAG with IM | ADRB2,TFB1M,RNF144A, etc. | 7.38e-02 |  |
| ∗The dot plots of a searched regulon are shown for all cell subpopulations in each disease state of each tissue based on the regulon specific score inferred using pySCENIC and by calculating the average expression. |
| Page: 1 2 |
Top |
Somatic mutation of malignant transformation related genes |
| Annotation of somatic variants for genes involved in malignant transformation |
| Hugo Symbol | Variant Class | Variant Classification | dbSNP RS | HGVSc | HGVSp | HGVSp Short | SWISSPROT | BIOTYPE | SIFT | PolyPhen | Tumor Sample Barcode | Tissue | Histology | Sex | Age | Stage | Therapy Types | Drugs | Outcome |
| TBPL1 | SNV | Missense_Mutation | c.437N>C | p.Arg146Thr | p.R146T | P62380 | protein_coding | deleterious(0) | possibly_damaging(0.524) | TCGA-C5-A1BQ-01 | Cervix | cervical & endocervical cancer | Female | >=65 | III/IV | Chemotherapy | cisplatin | CR | |
| TBPL1 | SNV | Missense_Mutation | c.295N>C | p.Asp99His | p.D99H | P62380 | protein_coding | deleterious(0.01) | benign(0.009) | TCGA-EK-A3GJ-01 | Cervix | cervical & endocervical cancer | Female | <65 | I/II | Unknown | Unknown | SD | |
| TBPL1 | SNV | Missense_Mutation | novel | c.155N>C | p.Arg52Thr | p.R52T | P62380 | protein_coding | deleterious(0) | probably_damaging(0.997) | TCGA-VS-A958-01 | Cervix | cervical & endocervical cancer | Female | <65 | I/II | Chemotherapy | cisplatin | CR |
| TBPL1 | SNV | Missense_Mutation | c.388N>A | p.Tyr130Asn | p.Y130N | P62380 | protein_coding | deleterious(0) | probably_damaging(0.998) | TCGA-AA-3492-01 | Colorectum | colon adenocarcinoma | Female | >=65 | I/II | Unknown | Unknown | SD | |
| TBPL1 | SNV | Missense_Mutation | c.197T>G | p.Ile66Ser | p.I66S | P62380 | protein_coding | deleterious(0) | probably_damaging(0.988) | TCGA-AA-A00N-01 | Colorectum | colon adenocarcinoma | Male | >=65 | I/II | Unknown | Unknown | PD | |
| TBPL1 | SNV | Missense_Mutation | novel | c.299N>G | p.Phe100Cys | p.F100C | P62380 | protein_coding | deleterious(0) | probably_damaging(0.99) | TCGA-CA-6717-01 | Colorectum | colon adenocarcinoma | Male | <65 | I/II | Chemotherapy | oxaliplatin | CR |
| TBPL1 | SNV | Missense_Mutation | c.297N>G | p.Asp99Glu | p.D99E | P62380 | protein_coding | tolerated(0.18) | benign(0.001) | TCGA-AX-A0J0-01 | Endometrium | uterine corpus endometrioid carcinoma | Female | <65 | I/II | Unknown | Unknown | SD | |
| TBPL1 | SNV | Missense_Mutation | rs867623161 | c.456N>G | p.Phe152Leu | p.F152L | P62380 | protein_coding | deleterious(0) | probably_damaging(0.97) | TCGA-AX-A0J0-01 | Endometrium | uterine corpus endometrioid carcinoma | Female | <65 | I/II | Unknown | Unknown | SD |
| TBPL1 | SNV | Missense_Mutation | c.199A>G | p.Ile67Val | p.I67V | P62380 | protein_coding | tolerated(1) | benign(0.003) | TCGA-B5-A11E-01 | Endometrium | uterine corpus endometrioid carcinoma | Female | <65 | I/II | Unknown | Unknown | SD | |
| TBPL1 | SNV | Missense_Mutation | c.360N>A | p.Phe120Leu | p.F120L | P62380 | protein_coding | tolerated(0.69) | benign(0.34) | TCGA-BS-A0TC-01 | Endometrium | uterine corpus endometrioid carcinoma | Female | >=65 | I/II | Unknown | Unknown | SD |
| Page: 1 2 |
Top |
Related drugs of malignant transformation related genes |
| Identification of chemicals and drugs interact with genes involved in malignant transfromation |
| (DGIdb 4.0) |
| Entrez ID | Symbol | Category | Interaction Types | Drug Claim Name | Drug Name | PMIDs |
| Page: 1 |

Copyright 2023-Present -The University of Texas Health Science Center at Houston |