
|
|||||
|
 | |
| |
| |
| |
| |
| |
|
Gene: TBL2 |
Gene summary for TBL2 |
| Gene information | Species | Human | Gene symbol | TBL2 | Gene ID | 26608 |
| Gene name | transducin beta like 2 | |
| Gene Alias | WBSCR13 | |
| Cytomap | 7q11.23 | |
| Gene Type | protein-coding | GO ID | GO:0001666 | UniProtAcc | Q9Y4P3 |
Top |
Malignant transformation analysis |
| Identification of the aberrant gene expression in precancerous and cancerous lesions by comparing the gene expression of stem-like cells in diseased tissues with normal stem cells |
| Entrez ID | Symbol | Replicates | Species | Organ | Tissue | Adj P-value | Log2FC | Malignancy |
| 26608 | TBL2 | LZE7T | Human | Esophagus | ESCC | 8.95e-04 | 1.52e-01 | 0.0667 |
| 26608 | TBL2 | LZE24T | Human | Esophagus | ESCC | 5.65e-11 | 3.65e-01 | 0.0596 |
| 26608 | TBL2 | P1T-E | Human | Esophagus | ESCC | 5.55e-03 | 2.34e-01 | 0.0875 |
| 26608 | TBL2 | P2T-E | Human | Esophagus | ESCC | 8.50e-15 | 2.96e-01 | 0.1177 |
| 26608 | TBL2 | P4T-E | Human | Esophagus | ESCC | 2.39e-15 | 3.49e-01 | 0.1323 |
| 26608 | TBL2 | P5T-E | Human | Esophagus | ESCC | 6.26e-11 | 2.96e-01 | 0.1327 |
| 26608 | TBL2 | P8T-E | Human | Esophagus | ESCC | 3.64e-11 | 2.75e-01 | 0.0889 |
| 26608 | TBL2 | P9T-E | Human | Esophagus | ESCC | 5.77e-15 | 3.52e-01 | 0.1131 |
| 26608 | TBL2 | P10T-E | Human | Esophagus | ESCC | 1.92e-14 | 3.00e-01 | 0.116 |
| 26608 | TBL2 | P11T-E | Human | Esophagus | ESCC | 7.98e-09 | 3.71e-01 | 0.1426 |
| 26608 | TBL2 | P12T-E | Human | Esophagus | ESCC | 2.63e-27 | 6.57e-01 | 0.1122 |
| 26608 | TBL2 | P15T-E | Human | Esophagus | ESCC | 1.23e-20 | 4.87e-01 | 0.1149 |
| 26608 | TBL2 | P16T-E | Human | Esophagus | ESCC | 2.87e-35 | 7.72e-01 | 0.1153 |
| 26608 | TBL2 | P17T-E | Human | Esophagus | ESCC | 3.04e-06 | 3.00e-01 | 0.1278 |
| 26608 | TBL2 | P19T-E | Human | Esophagus | ESCC | 5.22e-06 | 5.80e-01 | 0.1662 |
| 26608 | TBL2 | P20T-E | Human | Esophagus | ESCC | 2.15e-12 | 3.52e-01 | 0.1124 |
| 26608 | TBL2 | P21T-E | Human | Esophagus | ESCC | 4.73e-44 | 7.43e-01 | 0.1617 |
| 26608 | TBL2 | P22T-E | Human | Esophagus | ESCC | 2.16e-21 | 4.14e-01 | 0.1236 |
| 26608 | TBL2 | P23T-E | Human | Esophagus | ESCC | 1.53e-22 | 5.82e-01 | 0.108 |
| 26608 | TBL2 | P24T-E | Human | Esophagus | ESCC | 1.29e-11 | 2.94e-01 | 0.1287 |
| Page: 1 2 3 4 5 |
| Tissue | Expression Dynamics | Abbreviation |
| Esophagus | 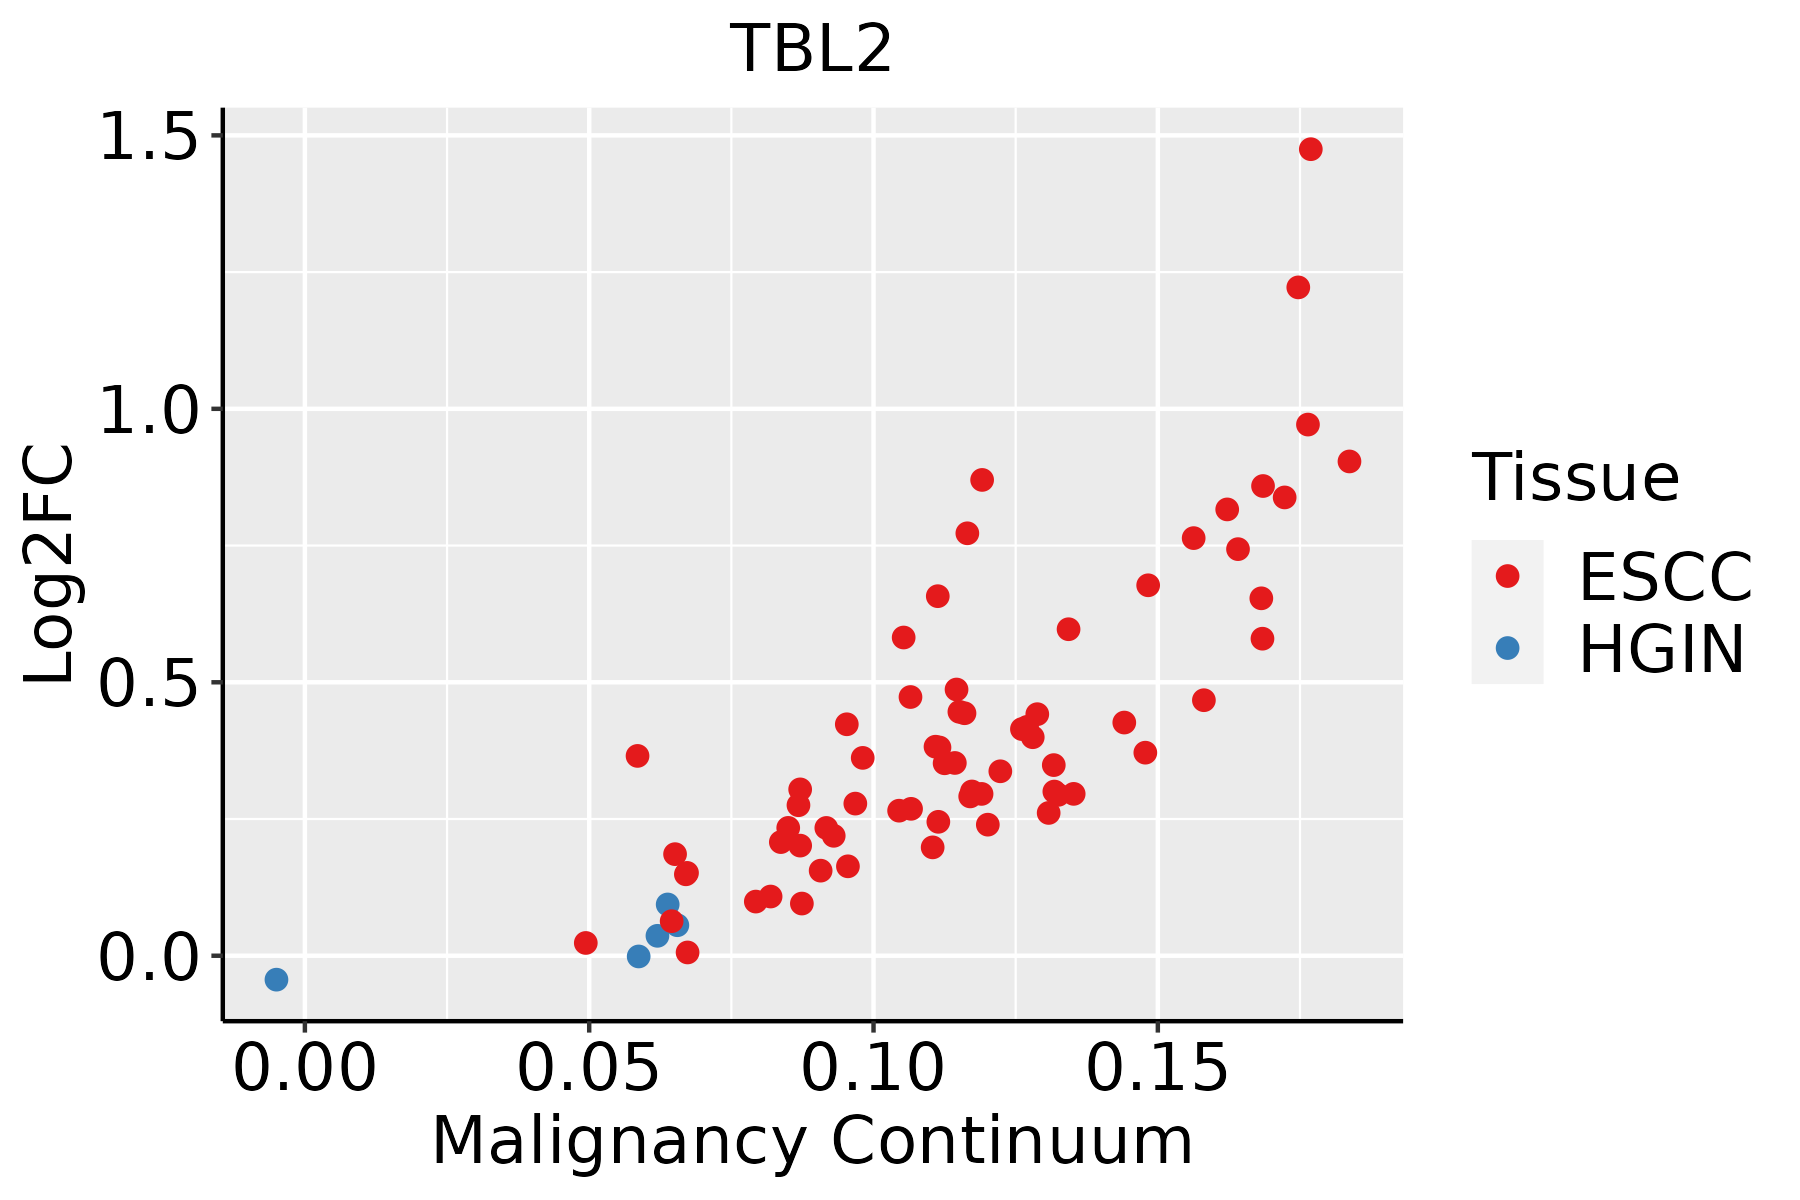 | ESCC: Esophageal squamous cell carcinoma |
| HGIN: High-grade intraepithelial neoplasias | ||
| LGIN: Low-grade intraepithelial neoplasias | ||
| Liver | 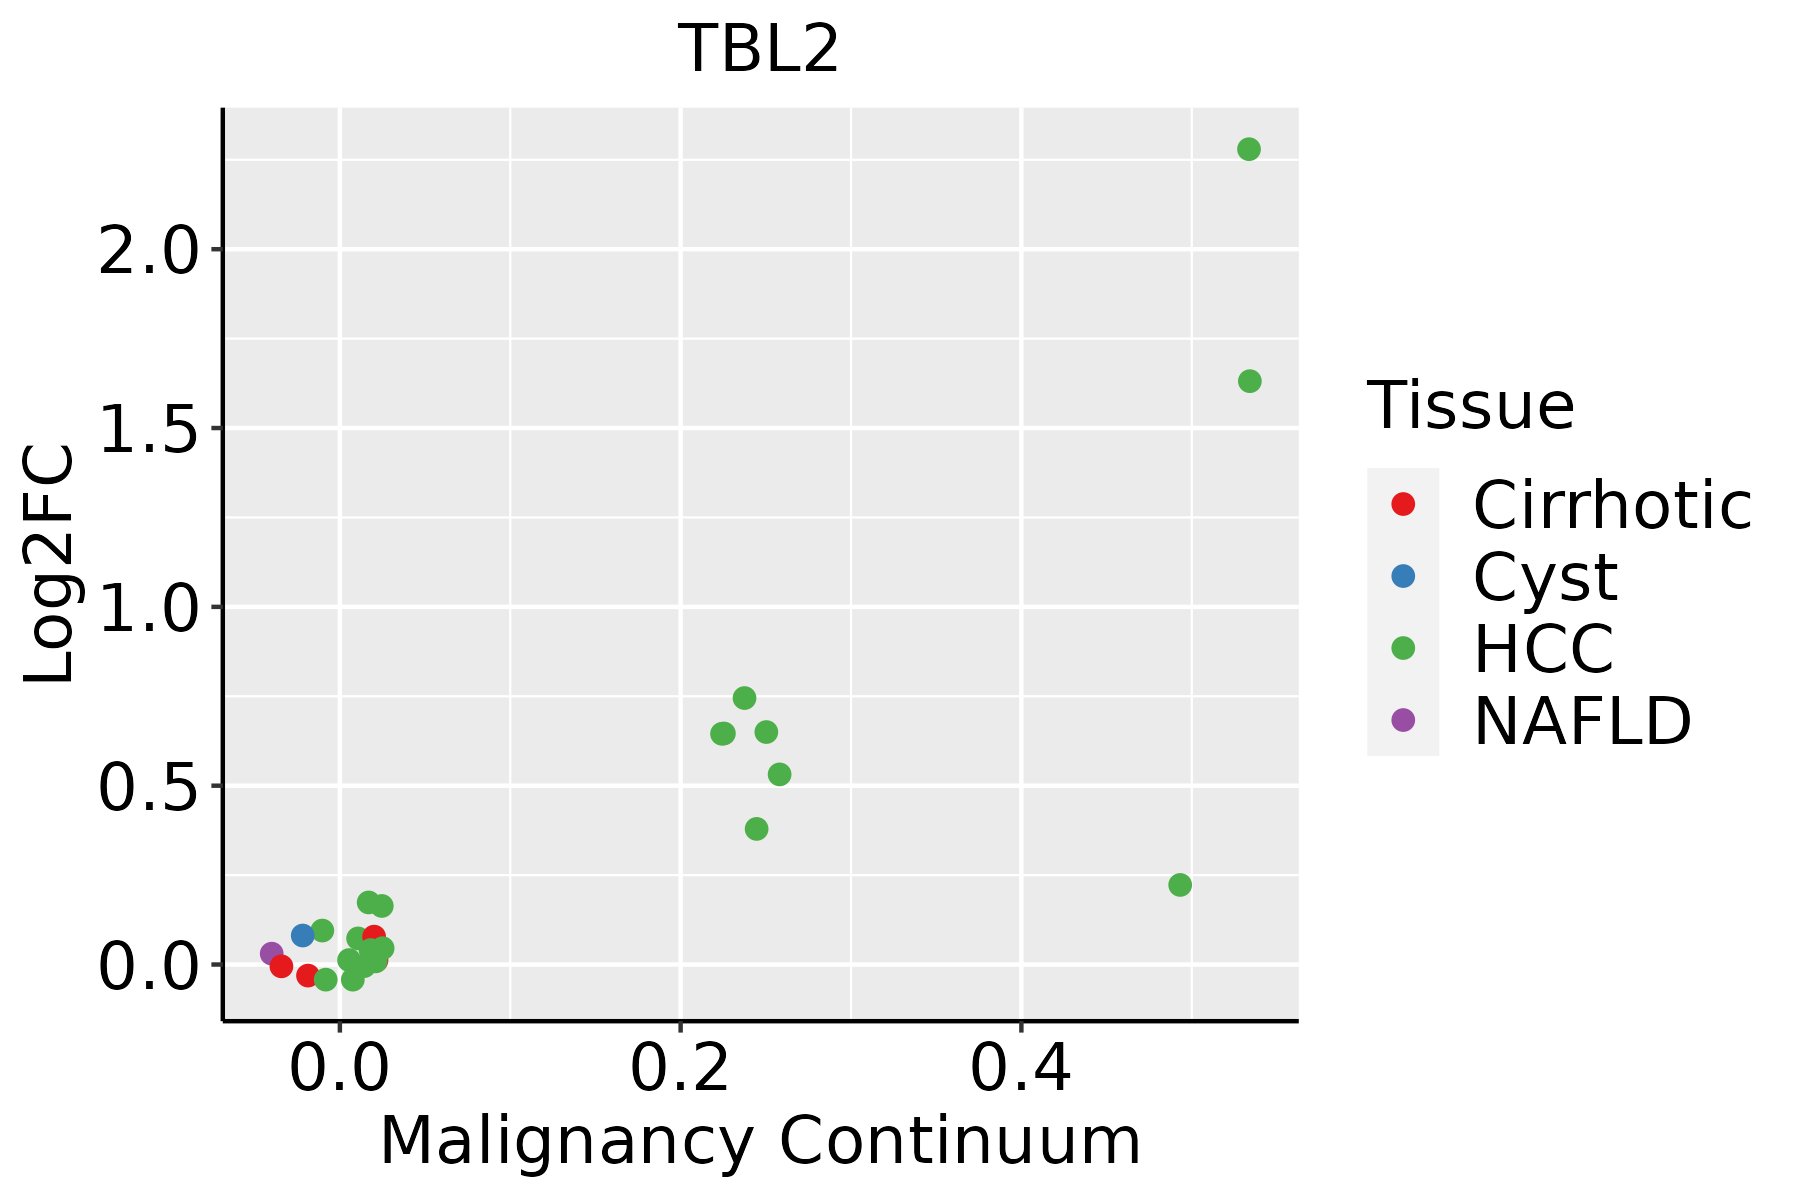 | HCC: Hepatocellular carcinoma |
| NAFLD: Non-alcoholic fatty liver disease | ||
| Oral Cavity |  | EOLP: Erosive Oral lichen planus |
| LP: leukoplakia | ||
| NEOLP: Non-erosive oral lichen planus | ||
| OSCC: Oral squamous cell carcinoma | ||
| Thyroid | 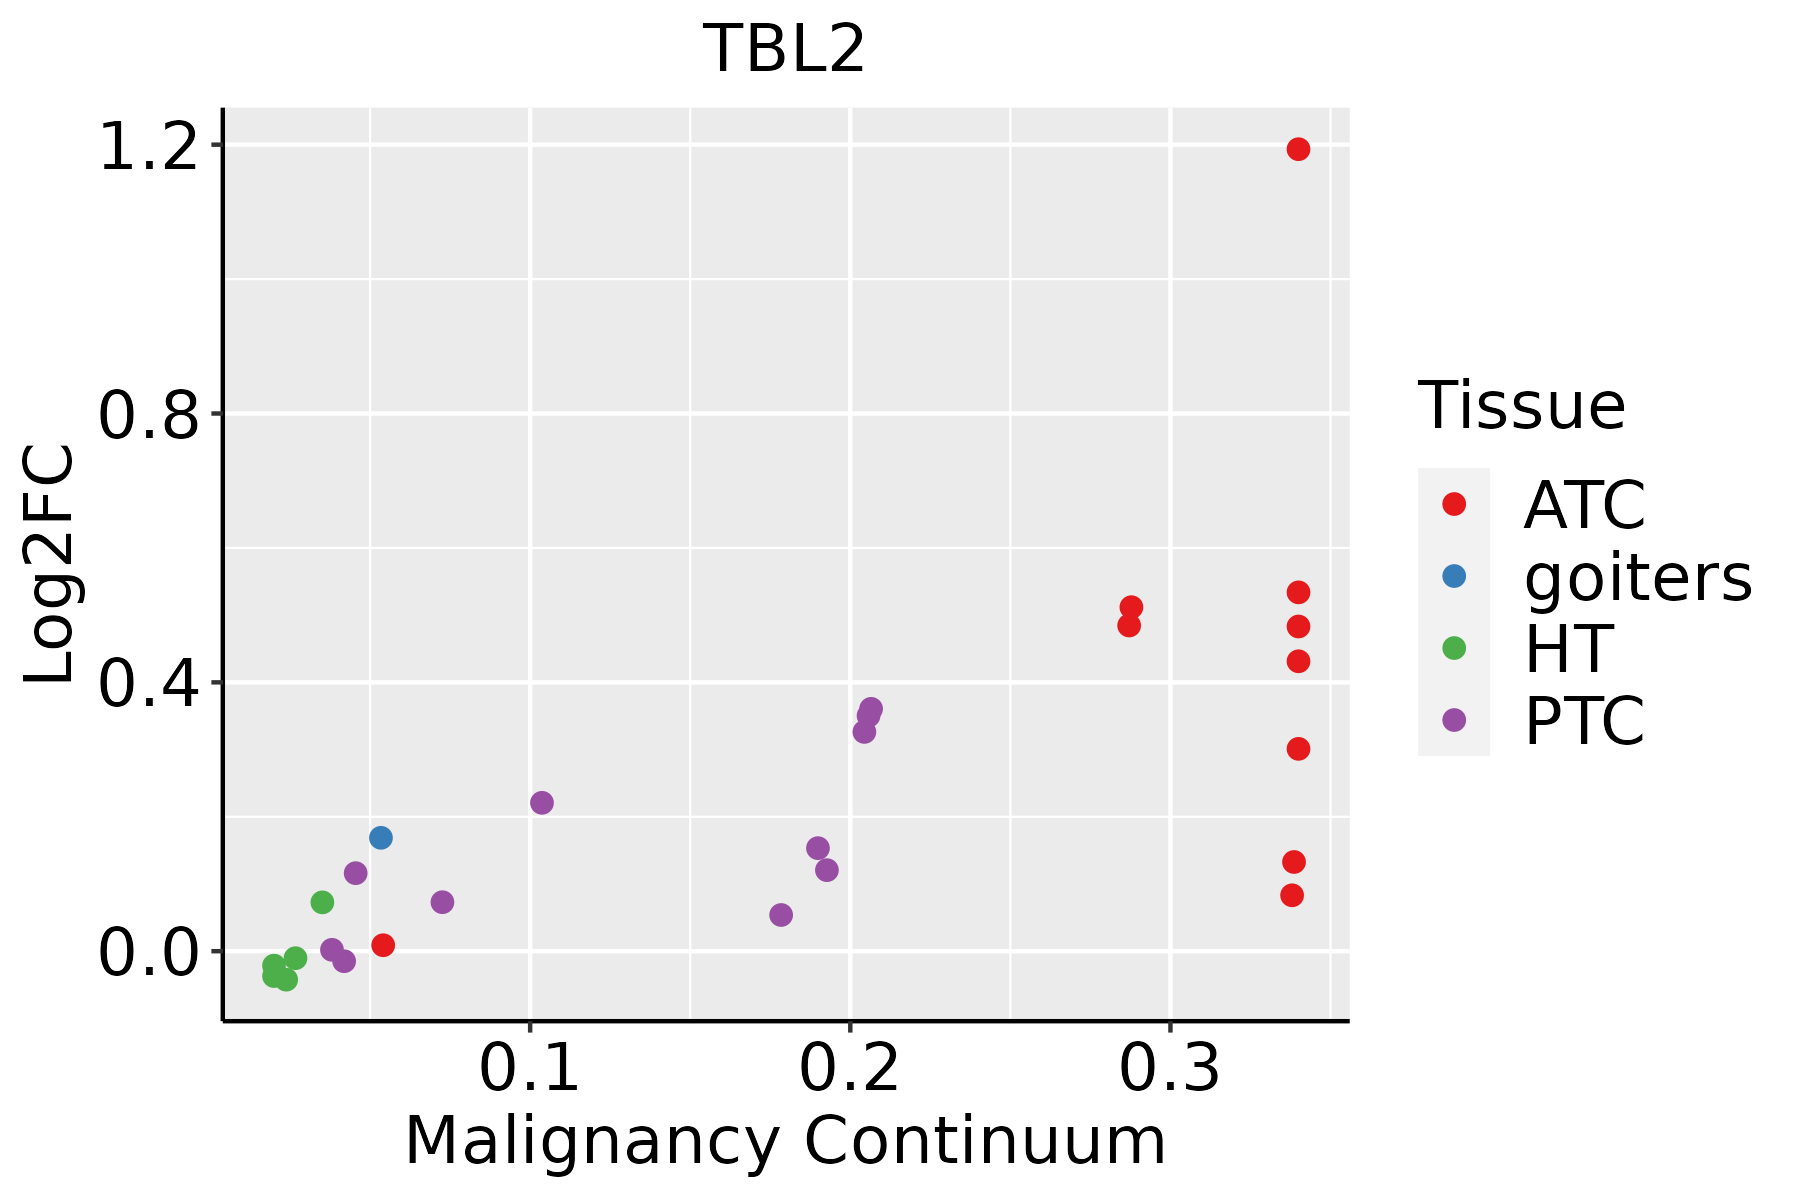 | ATC: Anaplastic thyroid cancer |
| HT: Hashimoto's thyroiditis | ||
| PTC: Papillary thyroid cancer |
| ∗log2FC in expression of this searched gene in stem-like cells from each diseased tissue sample relative to stem-like cells in normal samples in each tissue plotted against the malignancy continuum. Samples are colored based on if they are from different disease stage. |
Top |
Malignant transformation related pathway analysis |
| Find out the enriched GO biological processes and KEGG pathways involved in transition from healthy to precancer to cancer |
| Tissue | Disease Stage | Enriched GO biological Processes |
| Colorectum | AD |  |
| Colorectum | SER |  |
| Colorectum | MSS |  |
| Colorectum | MSI-H |  |
| Colorectum | FAP |  |
| ∗Top 15 enriched GO BP terms are showed in the bar plot of each disease state in each tissue. Each row represents a significant GO biological process which is colored according to the -log10(p.adjust). |
| Page: 1 2 3 4 5 6 7 8 9 |
| GO ID | Tissue | Disease Stage | Description | Gene Ratio | Bg Ratio | pvalue | p.adjust | Count |
| GO:0034976111 | Esophagus | ESCC | response to endoplasmic reticulum stress | 192/8552 | 256/18723 | 7.15e-22 | 1.30e-19 | 192 |
| GO:0035966111 | Esophagus | ESCC | response to topologically incorrect protein | 125/8552 | 159/18723 | 1.44e-17 | 1.27e-15 | 125 |
| GO:0071496111 | Esophagus | ESCC | cellular response to external stimulus | 215/8552 | 320/18723 | 4.29e-15 | 2.43e-13 | 215 |
| GO:0006986111 | Esophagus | ESCC | response to unfolded protein | 107/8552 | 137/18723 | 7.01e-15 | 3.87e-13 | 107 |
| GO:0031668111 | Esophagus | ESCC | cellular response to extracellular stimulus | 168/8552 | 246/18723 | 4.93e-13 | 2.23e-11 | 168 |
| GO:0035967111 | Esophagus | ESCC | cellular response to topologically incorrect protein | 90/8552 | 116/18723 | 1.94e-12 | 8.11e-11 | 90 |
| GO:0031669110 | Esophagus | ESCC | cellular response to nutrient levels | 148/8552 | 215/18723 | 4.58e-12 | 1.76e-10 | 148 |
| GO:0031667111 | Esophagus | ESCC | response to nutrient levels | 289/8552 | 474/18723 | 9.25e-12 | 3.47e-10 | 289 |
| GO:0070482111 | Esophagus | ESCC | response to oxygen levels | 218/8552 | 347/18723 | 6.91e-11 | 2.17e-09 | 218 |
| GO:0009267110 | Esophagus | ESCC | cellular response to starvation | 110/8552 | 156/18723 | 2.63e-10 | 7.37e-09 | 110 |
| GO:0034620111 | Esophagus | ESCC | cellular response to unfolded protein | 74/8552 | 96/18723 | 3.10e-10 | 8.66e-09 | 74 |
| GO:004259419 | Esophagus | ESCC | response to starvation | 133/8552 | 197/18723 | 4.31e-10 | 1.14e-08 | 133 |
| GO:0036293111 | Esophagus | ESCC | response to decreased oxygen levels | 201/8552 | 322/18723 | 8.37e-10 | 2.04e-08 | 201 |
| GO:0001666111 | Esophagus | ESCC | response to hypoxia | 192/8552 | 307/18723 | 1.59e-09 | 3.69e-08 | 192 |
| GO:003096818 | Esophagus | ESCC | endoplasmic reticulum unfolded protein response | 59/8552 | 74/18723 | 1.90e-09 | 4.36e-08 | 59 |
| GO:0071453110 | Esophagus | ESCC | cellular response to oxygen levels | 114/8552 | 177/18723 | 3.63e-07 | 5.06e-06 | 114 |
| GO:0036294110 | Esophagus | ESCC | cellular response to decreased oxygen levels | 105/8552 | 161/18723 | 4.20e-07 | 5.73e-06 | 105 |
| GO:007145616 | Esophagus | ESCC | cellular response to hypoxia | 97/8552 | 151/18723 | 3.12e-06 | 3.51e-05 | 97 |
| GO:00421492 | Esophagus | ESCC | cellular response to glucose starvation | 36/8552 | 48/18723 | 3.43e-05 | 2.80e-04 | 36 |
| GO:003497612 | Liver | HCC | response to endoplasmic reticulum stress | 189/7958 | 256/18723 | 1.43e-24 | 4.06e-22 | 189 |
| Page: 1 2 3 4 5 |
| Pathway ID | Tissue | Disease Stage | Description | Gene Ratio | Bg Ratio | pvalue | p.adjust | qvalue | Count |
| Page: 1 |
Top |
Cell-cell communication analysis |
| Identification of potential cell-cell interactions between two cell types and their ligand-receptor pairs for different disease states |
| Ligand | Receptor | LRpair | Pathway | Tissue | Disease Stage |
| Page: 1 |
Top |
Single-cell gene regulatory network inference analysis |
| Find out the significant the regulons (TFs) and the target genes of each regulon across cell types for different disease states |
| TF | Cell Type | Tissue | Disease Stage | Target Gene | RSS | Regulon Activity |
| ∗The dot plots of a searched regulon are shown for all cell subpopulations in each disease state of each tissue based on the regulon specific score inferred using pySCENIC and by calculating the average expression. |
| Page: 1 |
Top |
Somatic mutation of malignant transformation related genes |
| Annotation of somatic variants for genes involved in malignant transformation |
| Hugo Symbol | Variant Class | Variant Classification | dbSNP RS | HGVSc | HGVSp | HGVSp Short | SWISSPROT | BIOTYPE | SIFT | PolyPhen | Tumor Sample Barcode | Tissue | Histology | Sex | Age | Stage | Therapy Types | Drugs | Outcome |
| TBL2 | SNV | Missense_Mutation | c.789G>T | p.Lys263Asn | p.K263N | Q9Y4P3 | protein_coding | tolerated(0.37) | benign(0.001) | TCGA-A8-A09Z-01 | Breast | breast invasive carcinoma | Female | >=65 | I/II | Unknown | Unknown | SD | |
| TBL2 | SNV | Missense_Mutation | c.565G>T | p.Ala189Ser | p.A189S | Q9Y4P3 | protein_coding | tolerated(0.23) | possibly_damaging(0.73) | TCGA-AC-A3W5-01 | Breast | breast invasive carcinoma | Female | >=65 | I/II | Chemotherapy | docetaxel | CR | |
| TBL2 | SNV | Missense_Mutation | c.616N>A | p.Ala206Thr | p.A206T | Q9Y4P3 | protein_coding | tolerated(0.05) | possibly_damaging(0.486) | TCGA-AO-A128-01 | Breast | breast invasive carcinoma | Female | <65 | I/II | Chemotherapy | doxorubicin | SD | |
| TBL2 | SNV | Missense_Mutation | c.1198N>G | p.His400Asp | p.H400D | Q9Y4P3 | protein_coding | deleterious(0.01) | probably_damaging(0.919) | TCGA-C8-A12P-01 | Breast | breast invasive carcinoma | Female | <65 | I/II | Unknown | Unknown | SD | |
| TBL2 | SNV | Missense_Mutation | novel | c.560A>C | p.His187Pro | p.H187P | Q9Y4P3 | protein_coding | deleterious(0) | probably_damaging(0.989) | TCGA-AA-3952-01 | Colorectum | colon adenocarcinoma | Male | >=65 | III/IV | Unknown | Unknown | PD |
| TBL2 | SNV | Missense_Mutation | novel | c.584G>A | p.Gly195Asp | p.G195D | Q9Y4P3 | protein_coding | tolerated(0.17) | probably_damaging(0.949) | TCGA-AA-3984-01 | Colorectum | colon adenocarcinoma | Female | <65 | I/II | Unknown | Unknown | SD |
| TBL2 | SNV | Missense_Mutation | novel | c.308A>C | p.Lys103Thr | p.K103T | Q9Y4P3 | protein_coding | deleterious(0) | probably_damaging(1) | TCGA-AA-3984-01 | Colorectum | colon adenocarcinoma | Female | <65 | I/II | Unknown | Unknown | SD |
| TBL2 | SNV | Missense_Mutation | novel | c.1003T>G | p.Cys335Gly | p.C335G | Q9Y4P3 | protein_coding | deleterious(0.02) | benign(0.185) | TCGA-AA-A01R-01 | Colorectum | colon adenocarcinoma | Male | <65 | III/IV | Chemotherapy | 5-fluorouracil | PD |
| TBL2 | SNV | Missense_Mutation | rs539449965 | c.974G>A | p.Arg325His | p.R325H | Q9Y4P3 | protein_coding | tolerated(0.13) | benign(0) | TCGA-AD-6964-01 | Colorectum | colon adenocarcinoma | Male | <65 | III/IV | Chemotherapy | folfox | PD |
| TBL2 | SNV | Missense_Mutation | novel | c.164C>A | p.Ser55Tyr | p.S55Y | Q9Y4P3 | protein_coding | deleterious(0.02) | benign(0.198) | TCGA-CA-6717-01 | Colorectum | colon adenocarcinoma | Male | <65 | I/II | Chemotherapy | oxaliplatin | CR |
| Page: 1 2 3 4 5 |
Top |
Related drugs of malignant transformation related genes |
| Identification of chemicals and drugs interact with genes involved in malignant transfromation |
| (DGIdb 4.0) |
| Entrez ID | Symbol | Category | Interaction Types | Drug Claim Name | Drug Name | PMIDs |
| Page: 1 |

Copyright 2023-Present -The University of Texas Health Science Center at Houston |