
|
|||||
|
 | |
| |
| |
| |
| |
| |
|
Gene: TBL1XR1 |
Gene summary for TBL1XR1 |
| Gene information | Species | Human | Gene symbol | TBL1XR1 | Gene ID | 79718 |
| Gene name | TBL1X receptor 1 | |
| Gene Alias | C21 | |
| Cytomap | 3q26.32 | |
| Gene Type | protein-coding | GO ID | GO:0000122 | UniProtAcc | Q9BZK7 |
Top |
Malignant transformation analysis |
| Identification of the aberrant gene expression in precancerous and cancerous lesions by comparing the gene expression of stem-like cells in diseased tissues with normal stem cells |
| Entrez ID | Symbol | Replicates | Species | Organ | Tissue | Adj P-value | Log2FC | Malignancy |
| 79718 | TBL1XR1 | GSM4909281 | Human | Breast | IDC | 6.88e-17 | 5.09e-01 | 0.21 |
| 79718 | TBL1XR1 | GSM4909285 | Human | Breast | IDC | 1.10e-10 | 3.83e-01 | 0.21 |
| 79718 | TBL1XR1 | GSM4909293 | Human | Breast | IDC | 1.62e-32 | 6.35e-01 | 0.1581 |
| 79718 | TBL1XR1 | GSM4909298 | Human | Breast | IDC | 1.55e-07 | 2.75e-01 | 0.1551 |
| 79718 | TBL1XR1 | GSM4909303 | Human | Breast | IDC | 1.44e-03 | 5.13e-01 | 0.0438 |
| 79718 | TBL1XR1 | GSM4909304 | Human | Breast | IDC | 3.78e-17 | 5.19e-01 | 0.1636 |
| 79718 | TBL1XR1 | GSM4909308 | Human | Breast | IDC | 6.49e-07 | 3.78e-01 | 0.158 |
| 79718 | TBL1XR1 | GSM4909311 | Human | Breast | IDC | 1.80e-11 | -1.44e-01 | 0.1534 |
| 79718 | TBL1XR1 | GSM4909312 | Human | Breast | IDC | 5.16e-03 | 6.20e-02 | 0.1552 |
| 79718 | TBL1XR1 | GSM4909319 | Human | Breast | IDC | 5.82e-11 | -2.69e-01 | 0.1563 |
| 79718 | TBL1XR1 | GSM4909320 | Human | Breast | IDC | 1.36e-02 | -2.95e-01 | 0.1575 |
| 79718 | TBL1XR1 | GSM4909321 | Human | Breast | IDC | 5.60e-04 | -1.35e-01 | 0.1559 |
| 79718 | TBL1XR1 | brca1 | Human | Breast | Precancer | 3.08e-02 | -2.29e-01 | -0.0338 |
| 79718 | TBL1XR1 | M2 | Human | Breast | IDC | 1.72e-02 | 3.11e-01 | 0.21 |
| 79718 | TBL1XR1 | NCCBC14 | Human | Breast | DCIS | 8.23e-08 | 2.51e-01 | 0.2021 |
| 79718 | TBL1XR1 | NCCBC5 | Human | Breast | DCIS | 6.64e-04 | -6.48e-03 | 0.2046 |
| 79718 | TBL1XR1 | P1 | Human | Breast | IDC | 6.74e-09 | 3.04e-02 | 0.1527 |
| 79718 | TBL1XR1 | P2 | Human | Breast | IDC | 5.17e-04 | 4.08e-01 | 0.21 |
| 79718 | TBL1XR1 | P3 | Human | Breast | IDC | 2.50e-02 | 5.66e-01 | 0.1542 |
| 79718 | TBL1XR1 | DCIS2 | Human | Breast | DCIS | 1.11e-35 | 1.34e-01 | 0.0085 |
| Page: 1 2 3 4 5 6 7 8 9 10 11 12 13 14 |
| Tissue | Expression Dynamics | Abbreviation |
| Breast | 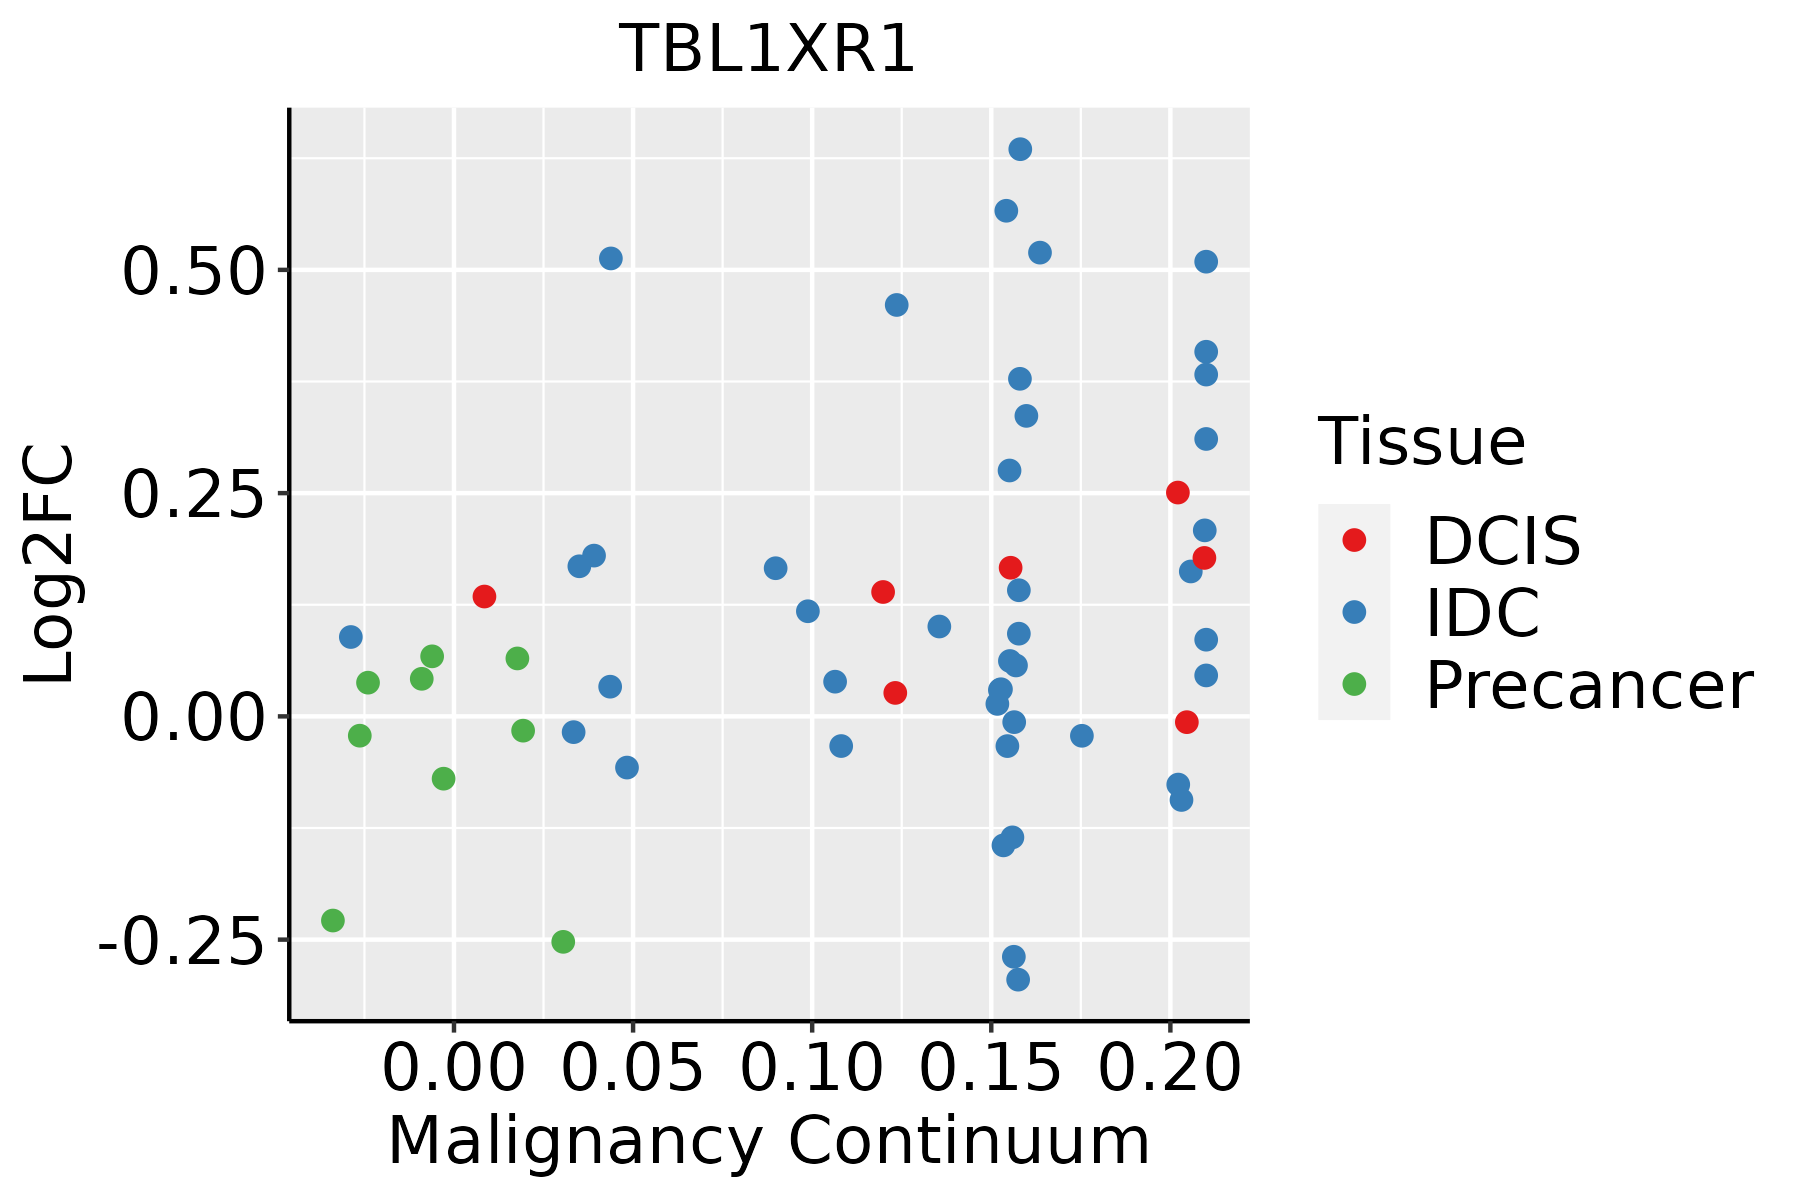 | IDC: Invasive ductal carcinoma |
| DCIS: Ductal carcinoma in situ | ||
| Precancer(BRCA1-mut): Precancerous lesion from BRCA1 mutation carriers | ||
| Cervix | 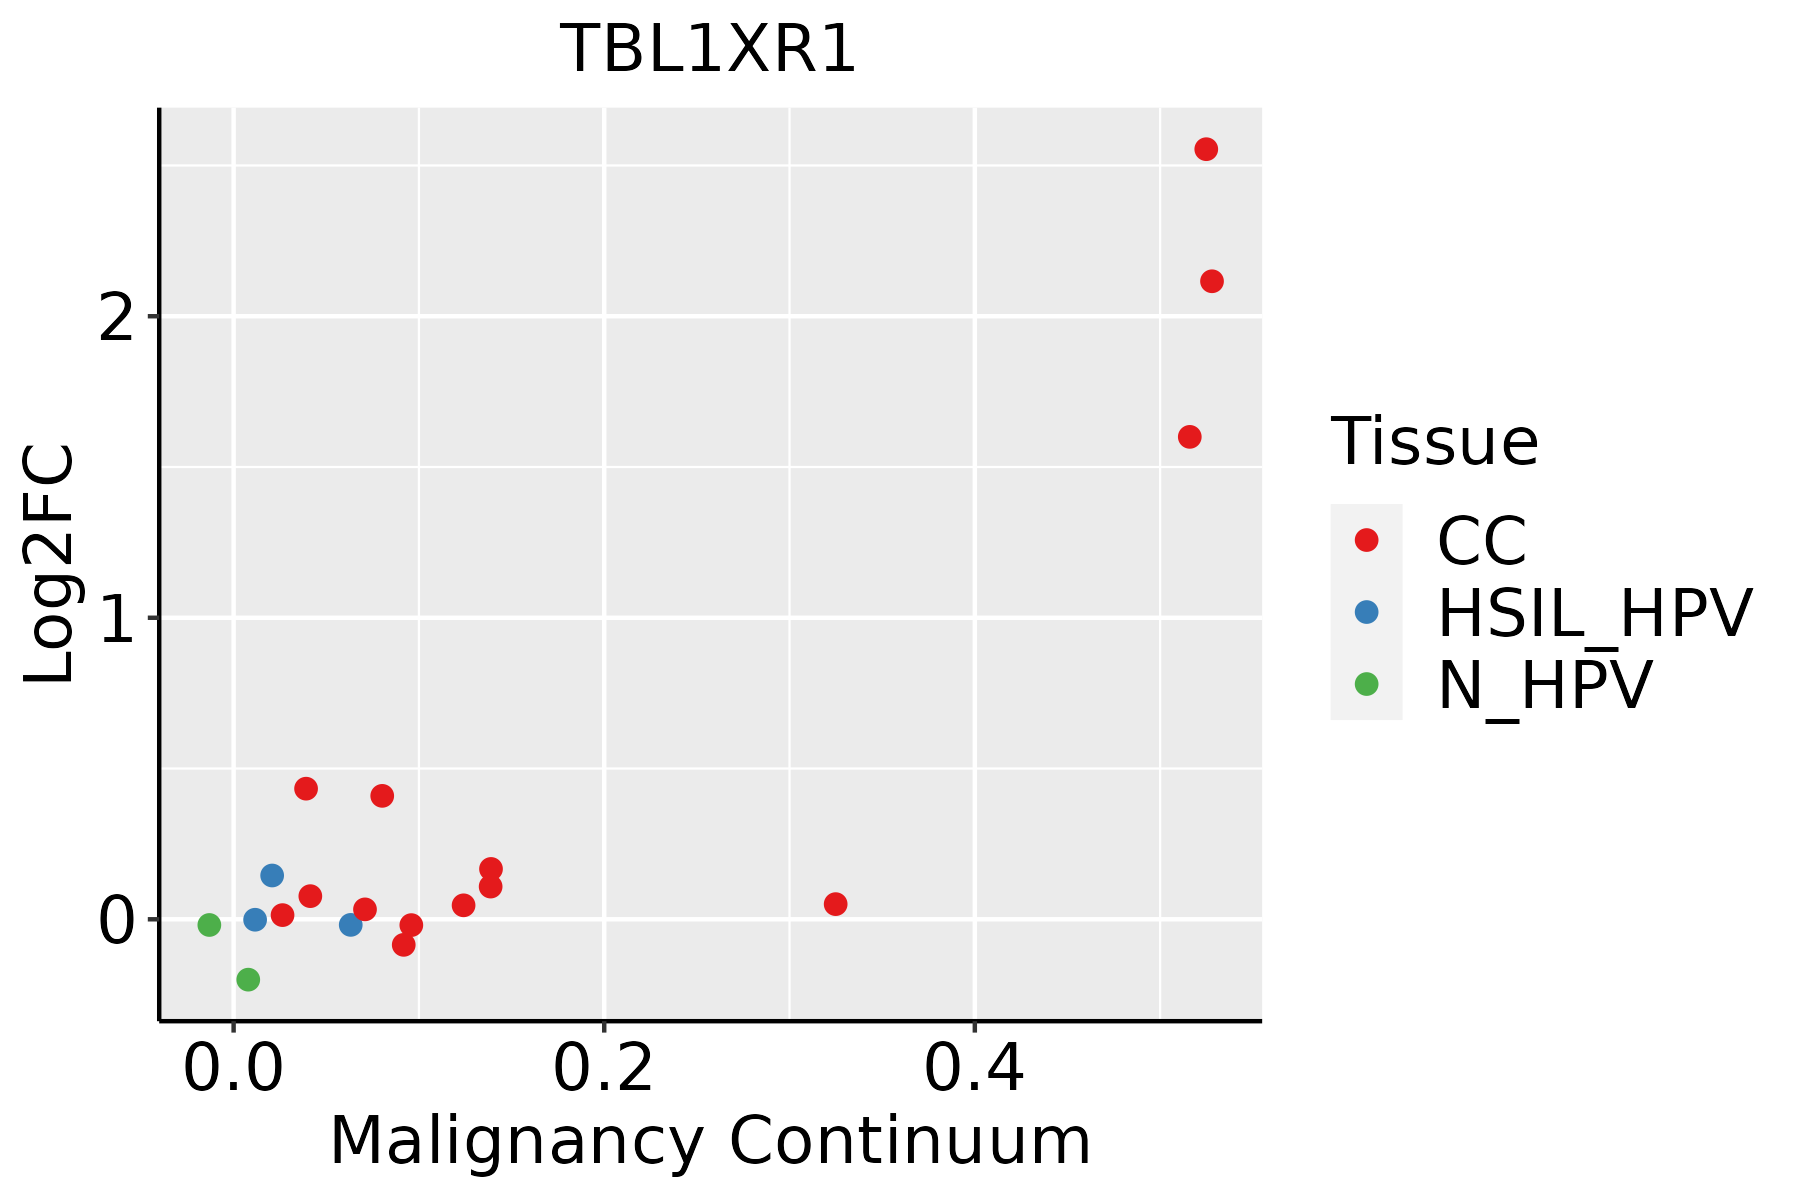 | CC: Cervix cancer |
| HSIL_HPV: HPV-infected high-grade squamous intraepithelial lesions | ||
| N_HPV: HPV-infected normal cervix | ||
| Colorectum (GSE201348) | 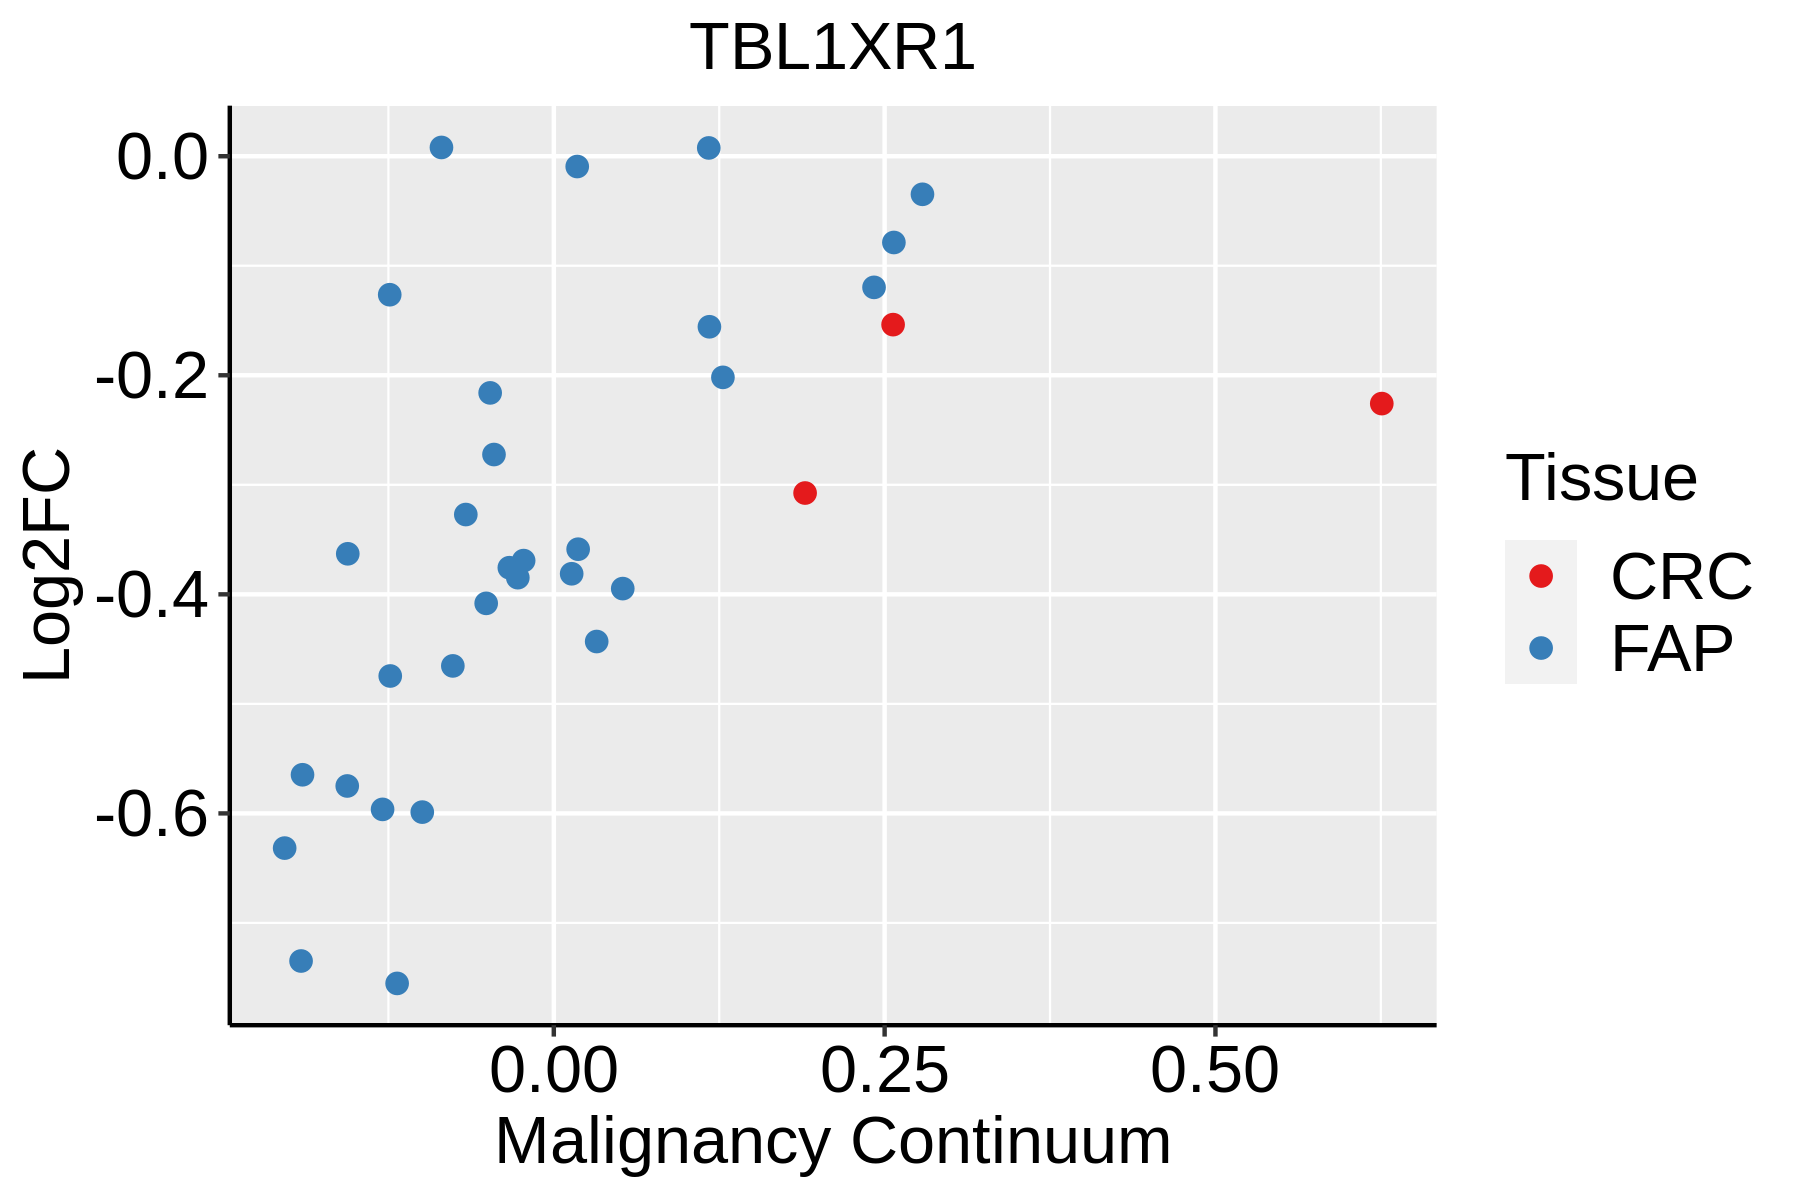 | FAP: Familial adenomatous polyposis |
| CRC: Colorectal cancer | ||
| Colorectum (HTA11) |  | AD: Adenomas |
| SER: Sessile serrated lesions | ||
| MSI-H: Microsatellite-high colorectal cancer | ||
| MSS: Microsatellite stable colorectal cancer | ||
| Endometrium |  | AEH: Atypical endometrial hyperplasia |
| EEC: Endometrioid Cancer | ||
| Esophagus |  | ESCC: Esophageal squamous cell carcinoma |
| HGIN: High-grade intraepithelial neoplasias | ||
| LGIN: Low-grade intraepithelial neoplasias | ||
| Liver | 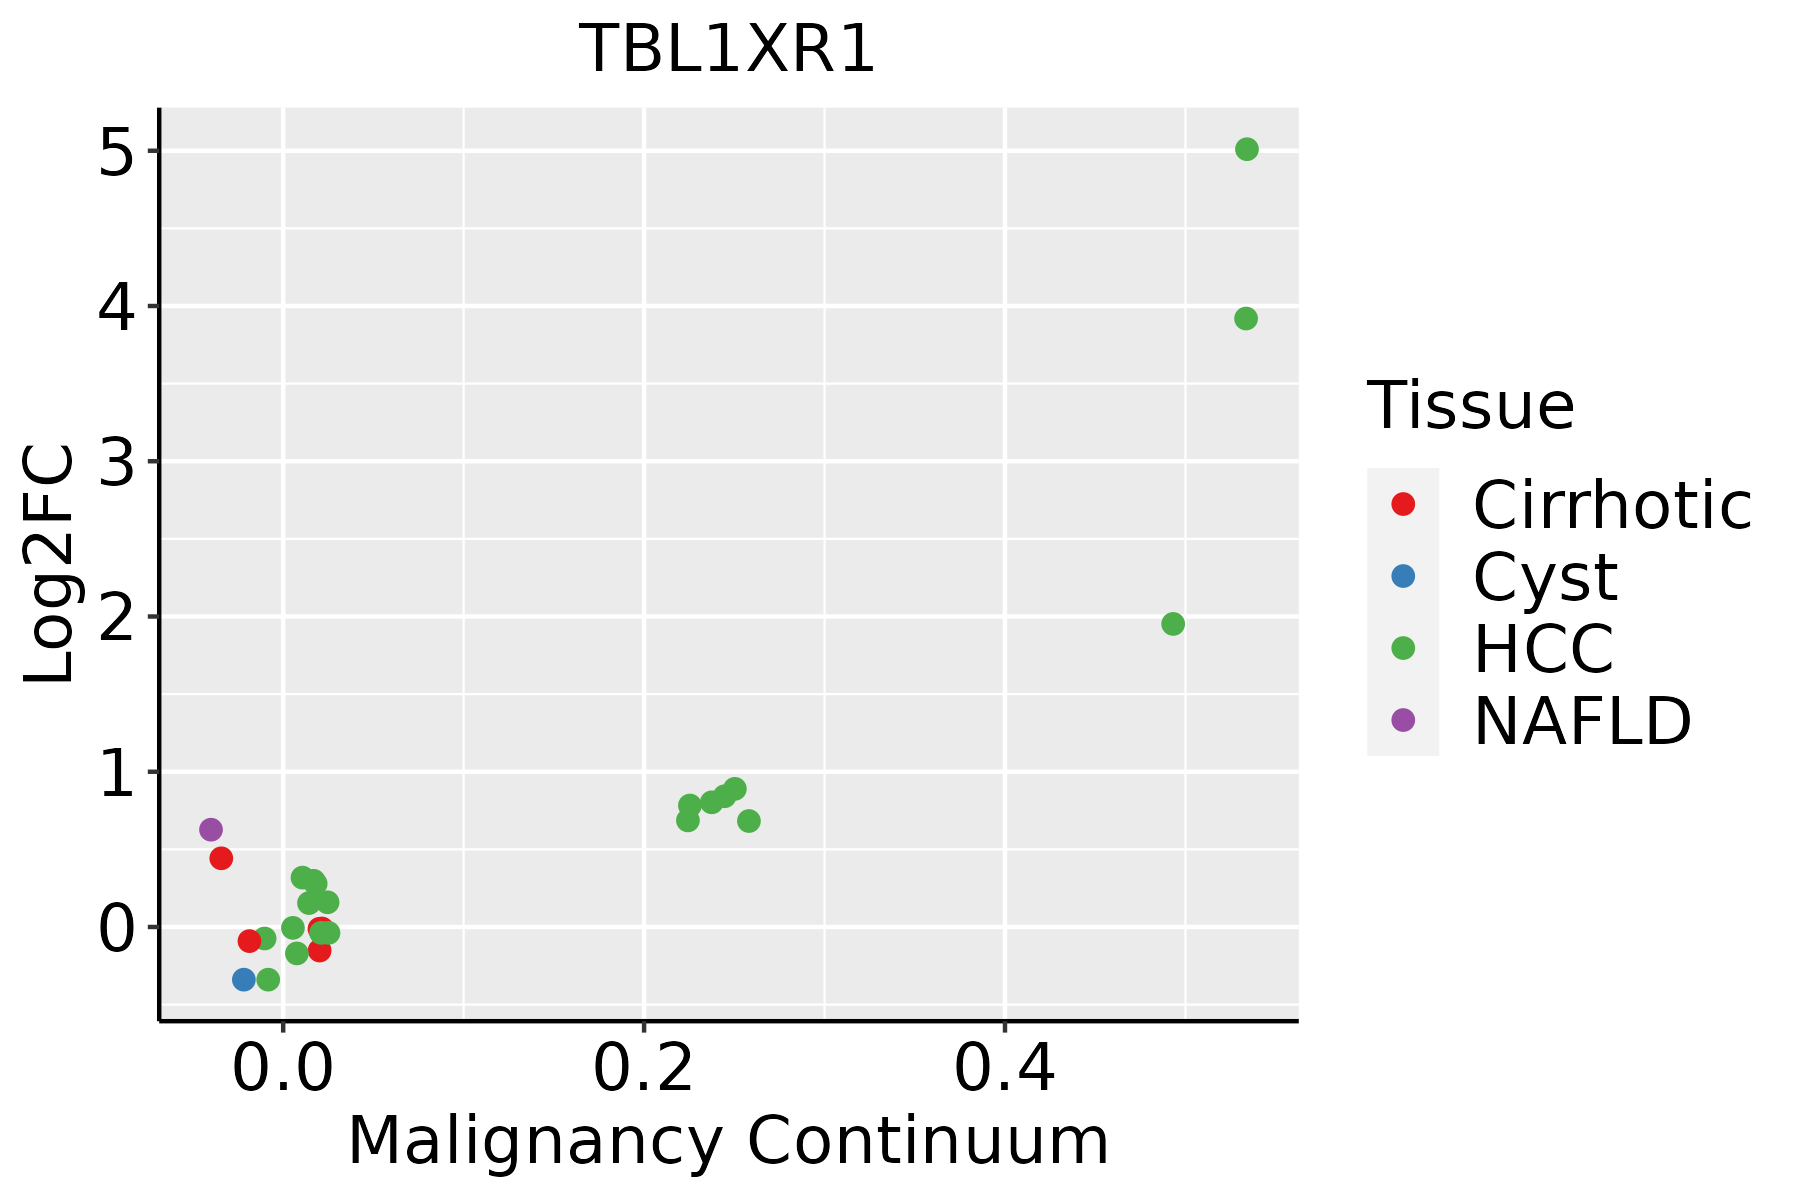 | HCC: Hepatocellular carcinoma |
| NAFLD: Non-alcoholic fatty liver disease | ||
| Lung | 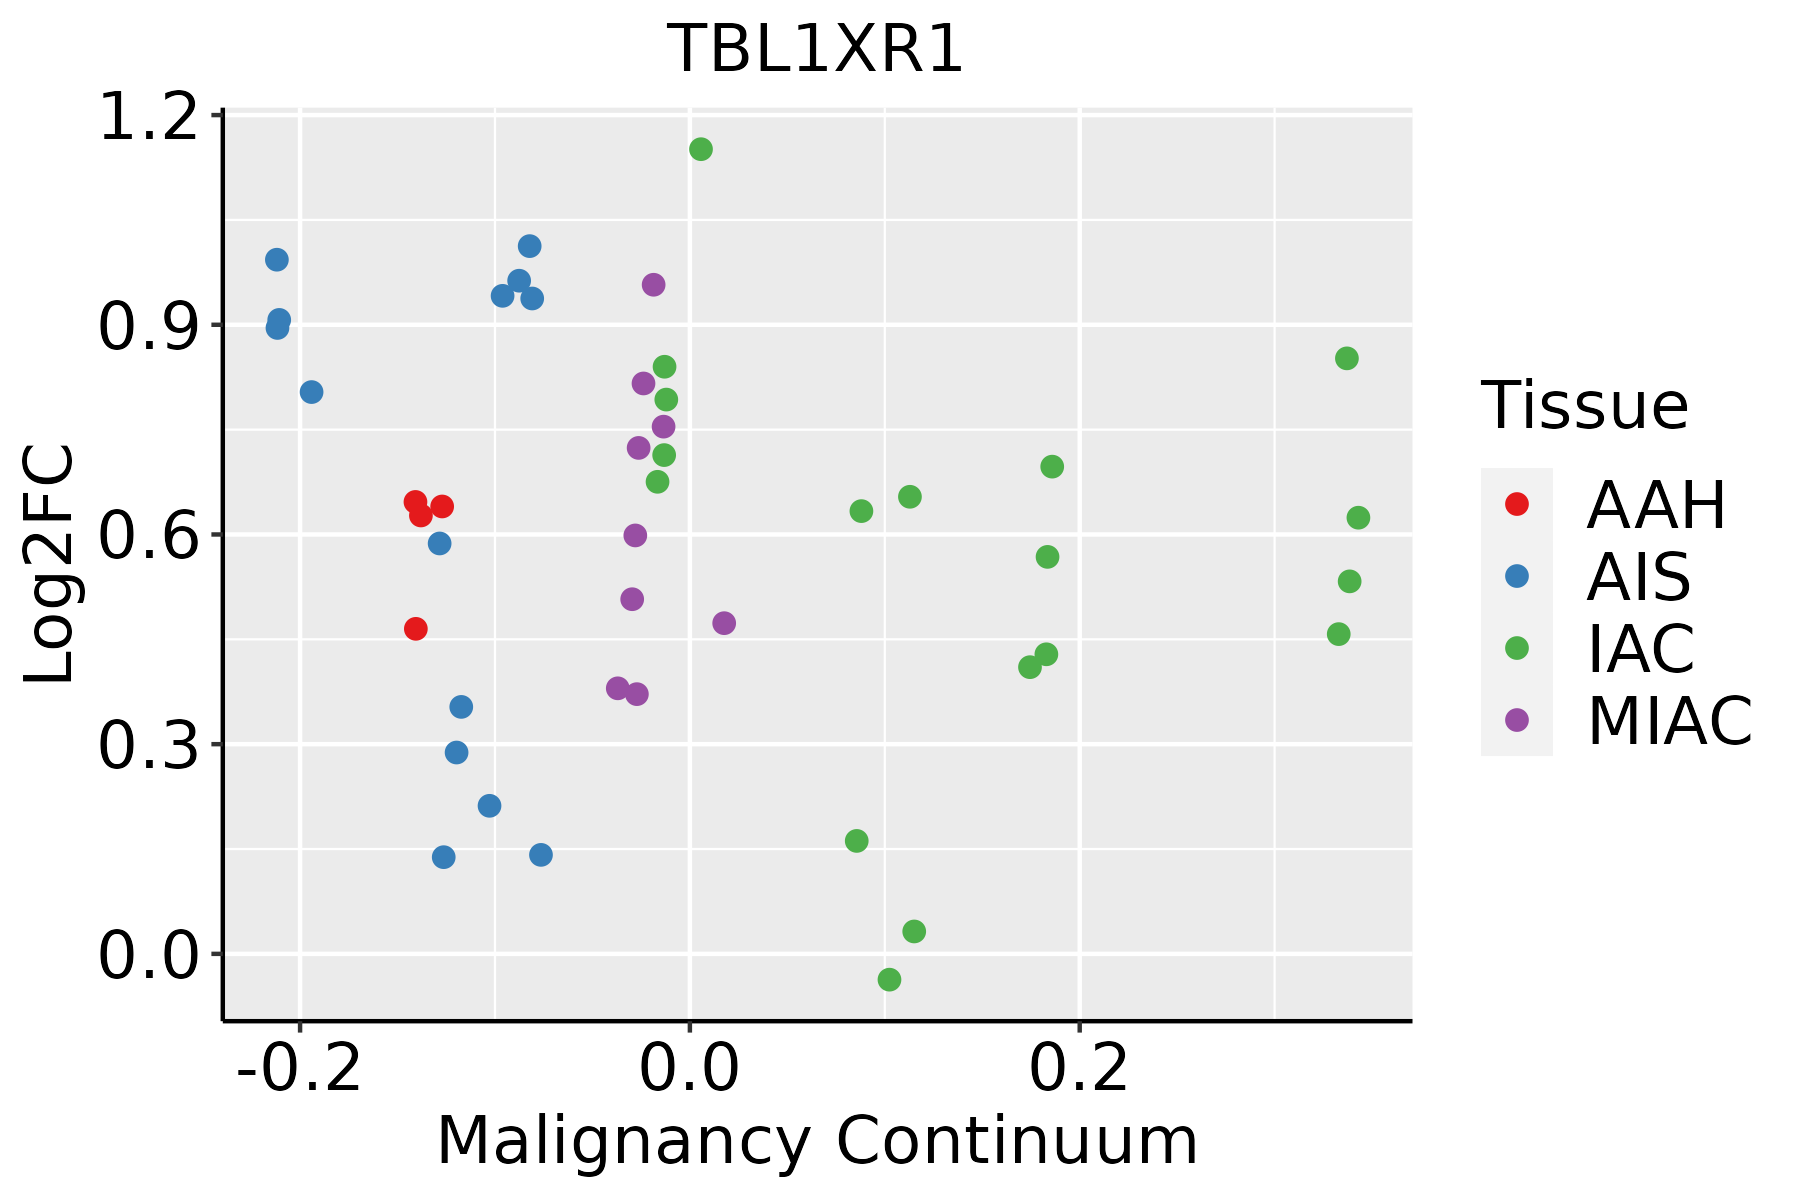 | AAH: Atypical adenomatous hyperplasia |
| AIS: Adenocarcinoma in situ | ||
| IAC: Invasive lung adenocarcinoma | ||
| MIA: Minimally invasive adenocarcinoma | ||
| Oral Cavity | 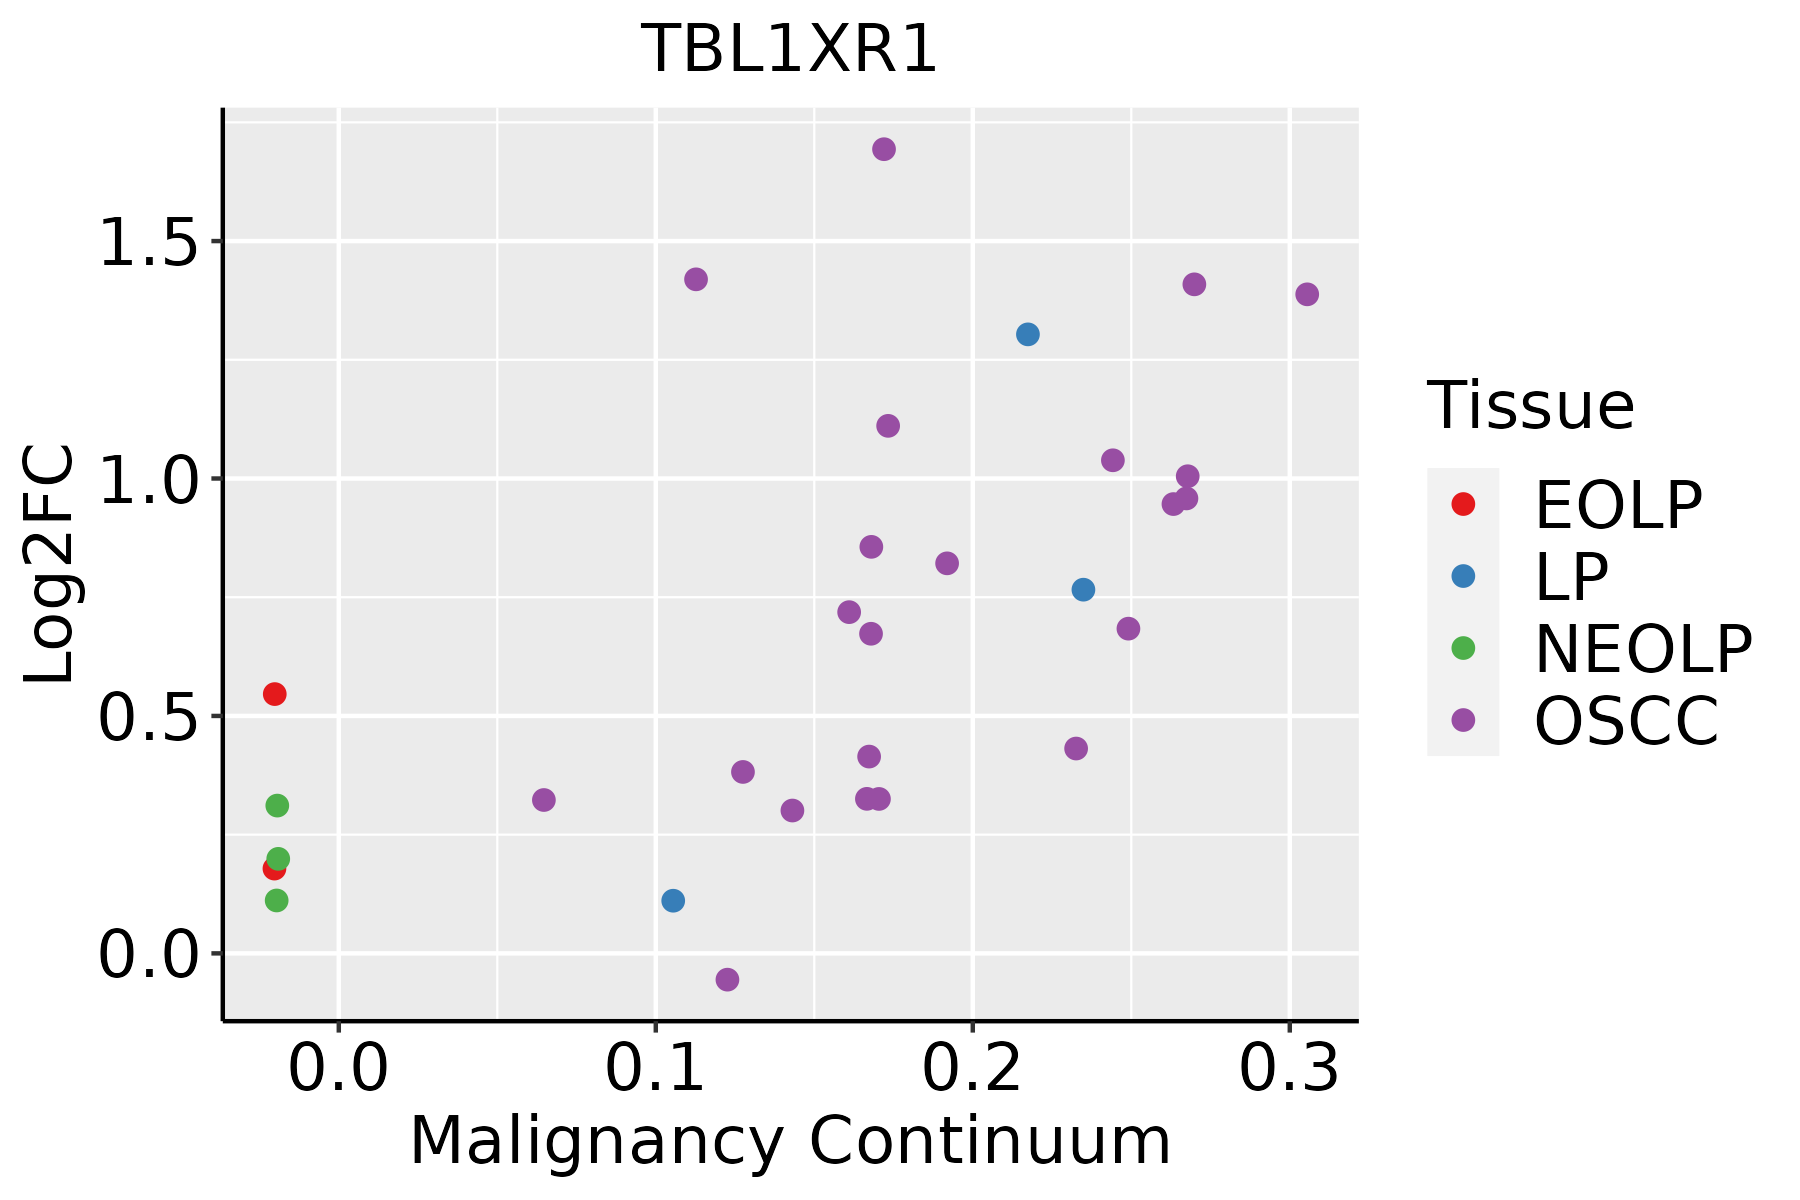 | EOLP: Erosive Oral lichen planus |
| LP: leukoplakia | ||
| NEOLP: Non-erosive oral lichen planus | ||
| OSCC: Oral squamous cell carcinoma | ||
| Prostate |  | BPH: Benign Prostatic Hyperplasia |
| Skin | 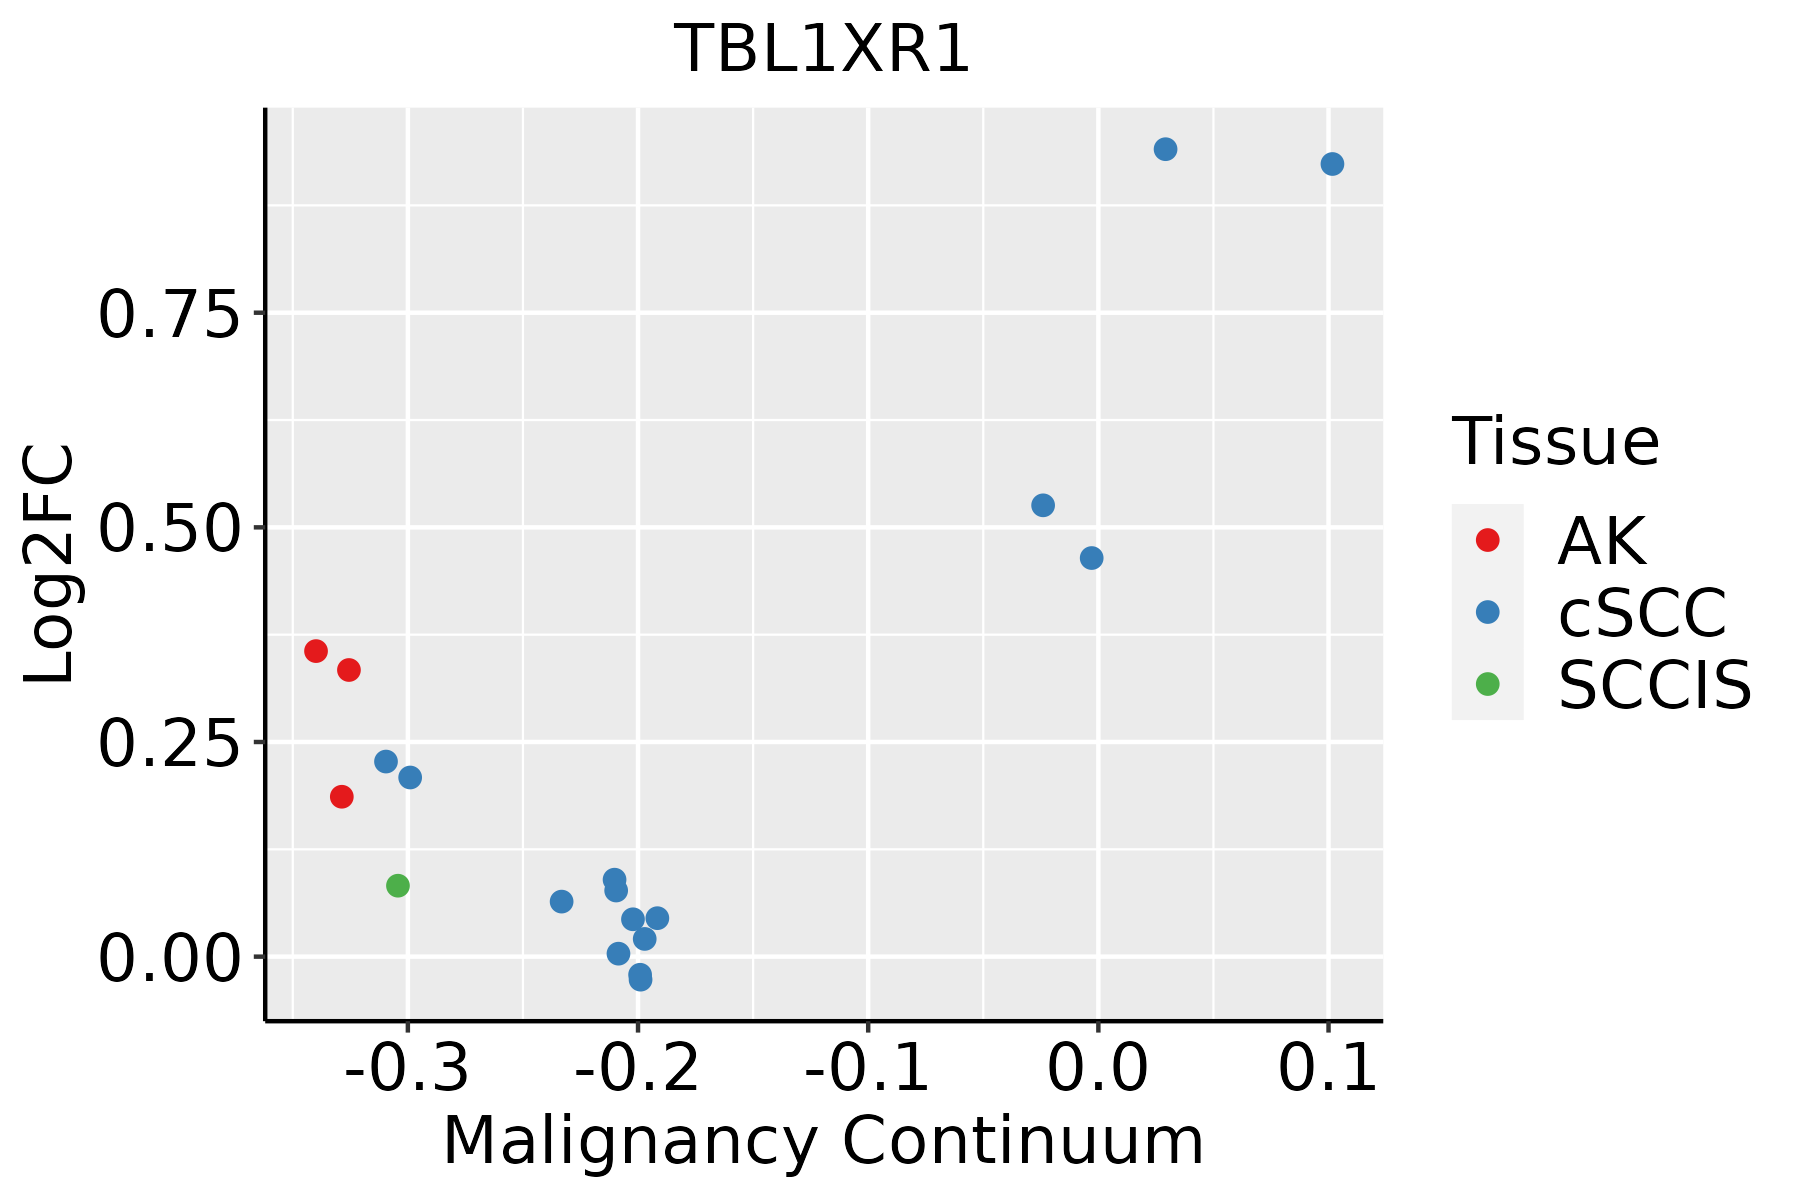 | AK: Actinic keratosis |
| cSCC: Cutaneous squamous cell carcinoma | ||
| SCCIS:squamous cell carcinoma in situ | ||
| Thyroid | 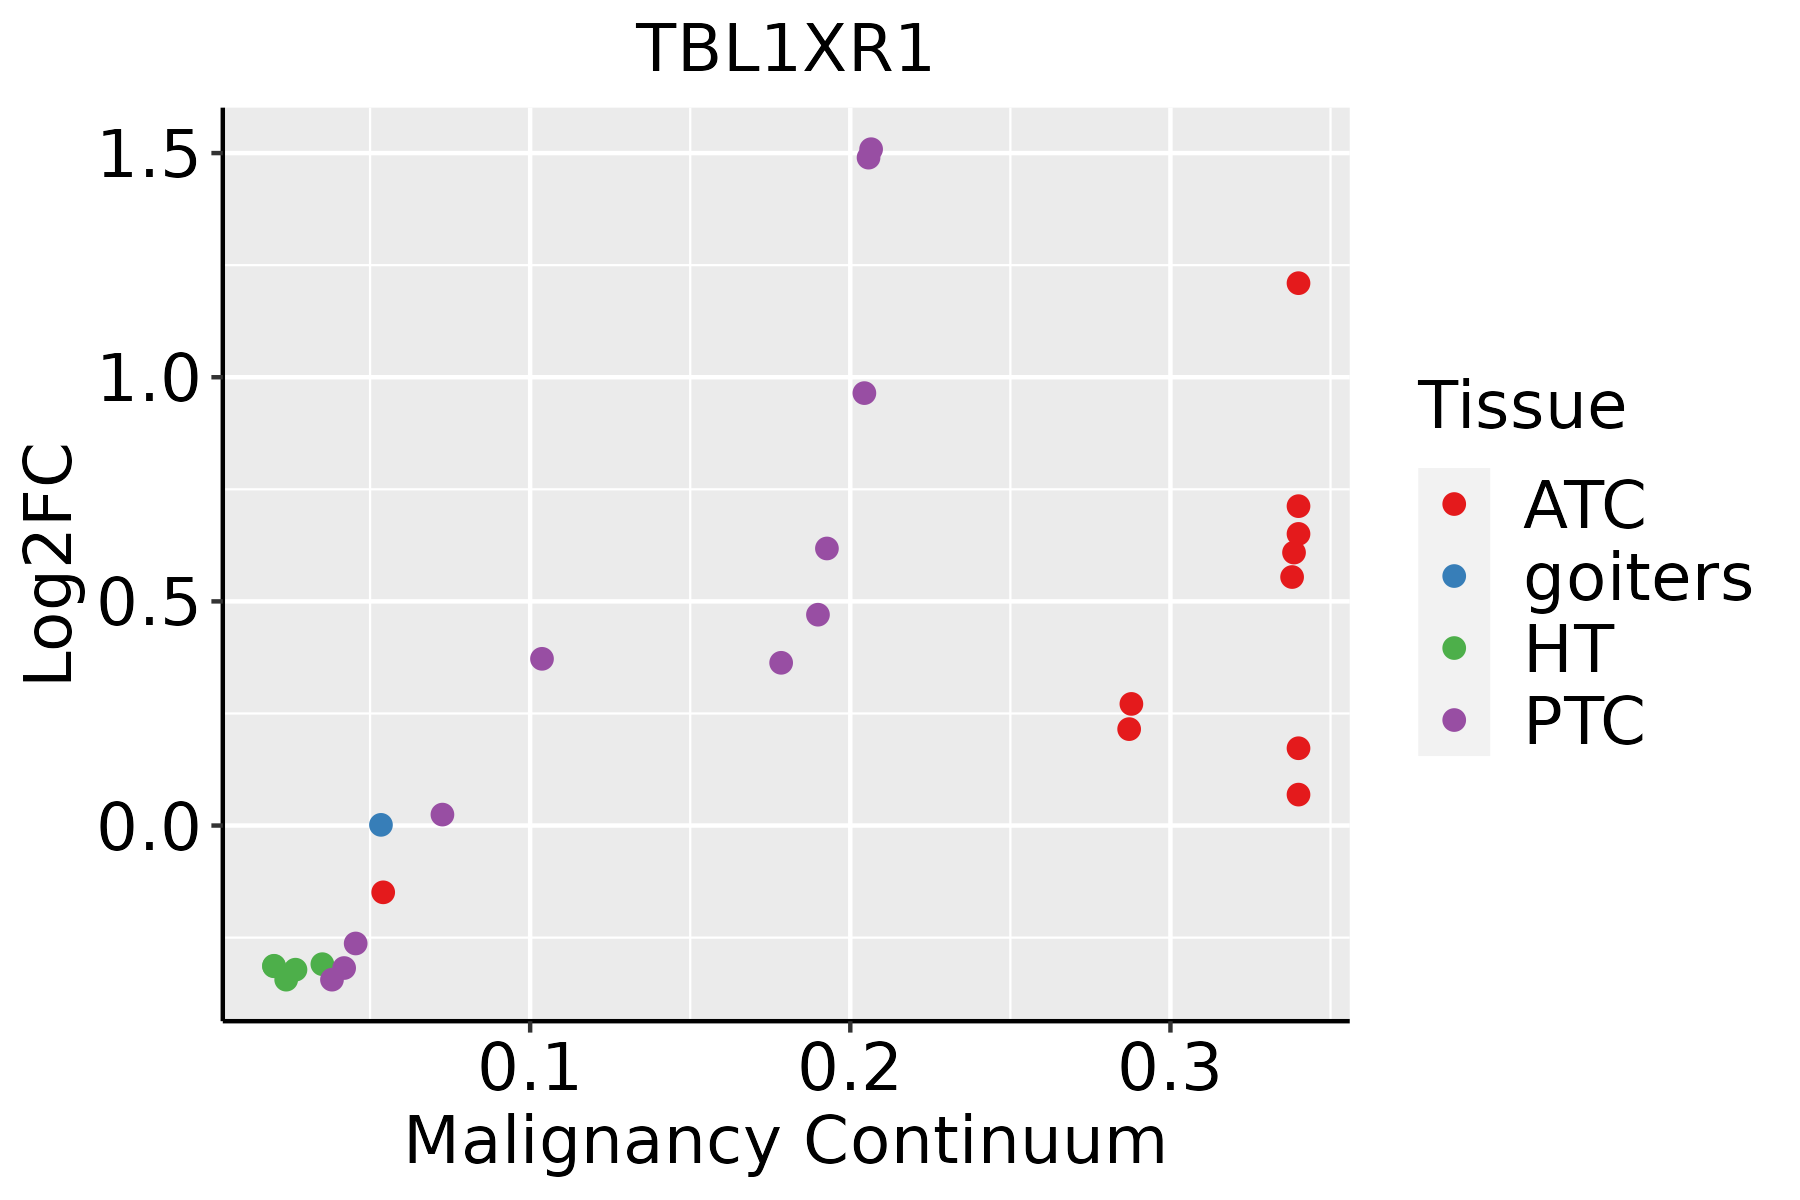 | ATC: Anaplastic thyroid cancer |
| HT: Hashimoto's thyroiditis | ||
| PTC: Papillary thyroid cancer |
| ∗log2FC in expression of this searched gene in stem-like cells from each diseased tissue sample relative to stem-like cells in normal samples in each tissue plotted against the malignancy continuum. Samples are colored based on if they are from different disease stage. |
Top |
Malignant transformation related pathway analysis |
| Find out the enriched GO biological processes and KEGG pathways involved in transition from healthy to precancer to cancer |
| Tissue | Disease Stage | Enriched GO biological Processes |
| Colorectum | AD |  |
| Colorectum | SER |  |
| Colorectum | MSS |  |
| Colorectum | MSI-H |  |
| Colorectum | FAP |  |
| ∗Top 15 enriched GO BP terms are showed in the bar plot of each disease state in each tissue. Each row represents a significant GO biological process which is colored according to the -log10(p.adjust). |
| Page: 1 2 3 4 5 6 7 8 9 |
| GO ID | Tissue | Disease Stage | Description | Gene Ratio | Bg Ratio | pvalue | p.adjust | Count |
| GO:00104989 | Breast | Precancer | proteasomal protein catabolic process | 58/1080 | 490/18723 | 1.54e-07 | 8.05e-06 | 58 |
| GO:00431619 | Breast | Precancer | proteasome-mediated ubiquitin-dependent protein catabolic process | 42/1080 | 412/18723 | 2.49e-04 | 3.72e-03 | 42 |
| GO:001049814 | Breast | IDC | proteasomal protein catabolic process | 75/1434 | 490/18723 | 5.59e-09 | 4.41e-07 | 75 |
| GO:004316114 | Breast | IDC | proteasome-mediated ubiquitin-dependent protein catabolic process | 57/1434 | 412/18723 | 9.55e-06 | 2.68e-04 | 57 |
| GO:001049824 | Breast | DCIS | proteasomal protein catabolic process | 75/1390 | 490/18723 | 1.44e-09 | 1.40e-07 | 75 |
| GO:004316124 | Breast | DCIS | proteasome-mediated ubiquitin-dependent protein catabolic process | 57/1390 | 412/18723 | 3.76e-06 | 1.16e-04 | 57 |
| GO:001049810 | Cervix | CC | proteasomal protein catabolic process | 111/2311 | 490/18723 | 8.98e-11 | 1.58e-08 | 111 |
| GO:00160557 | Cervix | CC | Wnt signaling pathway | 98/2311 | 444/18723 | 4.82e-09 | 4.65e-07 | 98 |
| GO:01987387 | Cervix | CC | cell-cell signaling by wnt | 98/2311 | 446/18723 | 6.16e-09 | 5.58e-07 | 98 |
| GO:004316110 | Cervix | CC | proteasome-mediated ubiquitin-dependent protein catabolic process | 91/2311 | 412/18723 | 1.65e-08 | 1.25e-06 | 91 |
| GO:00301117 | Cervix | CC | regulation of Wnt signaling pathway | 76/2311 | 328/18723 | 3.05e-08 | 2.08e-06 | 76 |
| GO:00608287 | Cervix | CC | regulation of canonical Wnt signaling pathway | 58/2311 | 253/18723 | 1.83e-06 | 5.89e-05 | 58 |
| GO:00600707 | Cervix | CC | canonical Wnt signaling pathway | 66/2311 | 303/18723 | 2.47e-06 | 7.35e-05 | 66 |
| GO:00165705 | Cervix | CC | histone modification | 84/2311 | 463/18723 | 1.70e-04 | 2.01e-03 | 84 |
| GO:00301776 | Cervix | CC | positive regulation of Wnt signaling pathway | 31/2311 | 140/18723 | 8.01e-04 | 7.02e-03 | 31 |
| GO:00902636 | Cervix | CC | positive regulation of canonical Wnt signaling pathway | 22/2311 | 106/18723 | 9.52e-03 | 4.72e-02 | 22 |
| GO:0010498 | Colorectum | AD | proteasomal protein catabolic process | 174/3918 | 490/18723 | 3.18e-14 | 7.66e-12 | 174 |
| GO:0043161 | Colorectum | AD | proteasome-mediated ubiquitin-dependent protein catabolic process | 141/3918 | 412/18723 | 1.77e-10 | 1.68e-08 | 141 |
| GO:0030111 | Colorectum | AD | regulation of Wnt signaling pathway | 102/3918 | 328/18723 | 8.51e-06 | 2.03e-04 | 102 |
| GO:0016055 | Colorectum | AD | Wnt signaling pathway | 130/3918 | 444/18723 | 1.60e-05 | 3.37e-04 | 130 |
| Page: 1 2 3 4 5 6 7 8 9 10 11 12 13 14 15 16 |
| Pathway ID | Tissue | Disease Stage | Description | Gene Ratio | Bg Ratio | pvalue | p.adjust | qvalue | Count |
| hsa043109 | Cervix | CC | Wnt signaling pathway | 43/1267 | 171/8465 | 3.03e-04 | 1.64e-03 | 9.68e-04 | 43 |
| hsa0431012 | Cervix | CC | Wnt signaling pathway | 43/1267 | 171/8465 | 3.03e-04 | 1.64e-03 | 9.68e-04 | 43 |
| hsa04310 | Colorectum | AD | Wnt signaling pathway | 56/2092 | 171/8465 | 1.03e-02 | 3.93e-02 | 2.51e-02 | 56 |
| hsa043101 | Colorectum | AD | Wnt signaling pathway | 56/2092 | 171/8465 | 1.03e-02 | 3.93e-02 | 2.51e-02 | 56 |
| hsa043102 | Colorectum | MSS | Wnt signaling pathway | 53/1875 | 171/8465 | 4.24e-03 | 1.86e-02 | 1.14e-02 | 53 |
| hsa043103 | Colorectum | MSS | Wnt signaling pathway | 53/1875 | 171/8465 | 4.24e-03 | 1.86e-02 | 1.14e-02 | 53 |
| hsa043104 | Colorectum | FAP | Wnt signaling pathway | 46/1404 | 171/8465 | 3.94e-04 | 3.06e-03 | 1.86e-03 | 46 |
| hsa043105 | Colorectum | FAP | Wnt signaling pathway | 46/1404 | 171/8465 | 3.94e-04 | 3.06e-03 | 1.86e-03 | 46 |
| hsa0431010 | Endometrium | AEH | Wnt signaling pathway | 37/1197 | 171/8465 | 4.68e-03 | 2.53e-02 | 1.86e-02 | 37 |
| hsa0431013 | Endometrium | AEH | Wnt signaling pathway | 37/1197 | 171/8465 | 4.68e-03 | 2.53e-02 | 1.86e-02 | 37 |
| hsa0431022 | Endometrium | EEC | Wnt signaling pathway | 40/1237 | 171/8465 | 1.37e-03 | 8.99e-03 | 6.70e-03 | 40 |
| hsa0431032 | Endometrium | EEC | Wnt signaling pathway | 40/1237 | 171/8465 | 1.37e-03 | 8.99e-03 | 6.70e-03 | 40 |
| hsa043108 | Lung | IAC | Wnt signaling pathway | 40/1053 | 171/8465 | 4.56e-05 | 7.06e-04 | 4.69e-04 | 40 |
| hsa0431011 | Lung | IAC | Wnt signaling pathway | 40/1053 | 171/8465 | 4.56e-05 | 7.06e-04 | 4.69e-04 | 40 |
| hsa0431021 | Lung | AIS | Wnt signaling pathway | 39/961 | 171/8465 | 1.29e-05 | 3.32e-04 | 2.12e-04 | 39 |
| hsa0431031 | Lung | AIS | Wnt signaling pathway | 39/961 | 171/8465 | 1.29e-05 | 3.32e-04 | 2.12e-04 | 39 |
| hsa0431041 | Lung | MIAC | Wnt signaling pathway | 21/507 | 171/8465 | 1.30e-03 | 1.40e-02 | 1.01e-02 | 21 |
| hsa0431051 | Lung | MIAC | Wnt signaling pathway | 21/507 | 171/8465 | 1.30e-03 | 1.40e-02 | 1.01e-02 | 21 |
| hsa0431016 | Oral cavity | EOLP | Wnt signaling pathway | 37/1218 | 171/8465 | 6.23e-03 | 1.83e-02 | 1.08e-02 | 37 |
| hsa0431017 | Oral cavity | EOLP | Wnt signaling pathway | 37/1218 | 171/8465 | 6.23e-03 | 1.83e-02 | 1.08e-02 | 37 |
| Page: 1 2 |
Top |
Cell-cell communication analysis |
| Identification of potential cell-cell interactions between two cell types and their ligand-receptor pairs for different disease states |
| Ligand | Receptor | LRpair | Pathway | Tissue | Disease Stage |
| Page: 1 |
Top |
Single-cell gene regulatory network inference analysis |
| Find out the significant the regulons (TFs) and the target genes of each regulon across cell types for different disease states |
| TF | Cell Type | Tissue | Disease Stage | Target Gene | RSS | Regulon Activity |
| TBL1XR1 | CD8TEFF | Breast | IDC | WDTC1,ANAPC1,BIRC6, etc. | 7.74e-02 |  |
| TBL1XR1 | IMGOB | Colorectum | CRC | PTK2,CUX1,MALAT1, etc. | 8.20e-03 |  |
| TBL1XR1 | SSC | Colorectum | CRC | PTK2,CUX1,MALAT1, etc. | 0.00e+00 | |
| TBL1XR1 | CD8TEXP | Endometrium | ADJ | TOX,THEMIS,PCED1B, etc. | 2.47e-01 |  |
| TBL1XR1 | CD8TEXINT | Endometrium | ADJ | TOX,THEMIS,PCED1B, etc. | 1.01e-01 | |
| TBL1XR1 | BMEM | Endometrium | AEH | TOX,THEMIS,PCED1B, etc. | 1.50e-01 |  |
| TBL1XR1 | CD8TEREX | Endometrium | EEC | TOX,THEMIS,PCED1B, etc. | 2.24e-01 |  |
| TBL1XR1 | CILIA | Lung | Healthy | STMN1,IGHG1,CKS2, etc. | 3.39e-02 |  |
| TBL1XR1 | CD4TN | Lung | IAC | FUT8,LRBA,PHF21A, etc. | 1.97e-01 |  |
| TBL1XR1 | BN | Pancreas | PDAC | OGA,EPS15,FUT8, etc. | 1.79e-01 |  |
| ∗The dot plots of a searched regulon are shown for all cell subpopulations in each disease state of each tissue based on the regulon specific score inferred using pySCENIC and by calculating the average expression. |
| Page: 1 2 |
Top |
Somatic mutation of malignant transformation related genes |
| Annotation of somatic variants for genes involved in malignant transformation |
| Hugo Symbol | Variant Class | Variant Classification | dbSNP RS | HGVSc | HGVSp | HGVSp Short | SWISSPROT | BIOTYPE | SIFT | PolyPhen | Tumor Sample Barcode | Tissue | Histology | Sex | Age | Stage | Therapy Types | Drugs | Outcome |
| TBL1XR1 | SNV | Missense_Mutation | c.1145N>G | p.Asn382Ser | p.N382S | Q9BZK7 | protein_coding | tolerated(0.66) | benign(0.001) | TCGA-A2-A0CS-01 | Breast | breast invasive carcinoma | Female | >=65 | III/IV | Hormone Therapy | anastrozole | SD | |
| TBL1XR1 | SNV | Missense_Mutation | c.1454N>A | p.Gly485Glu | p.G485E | Q9BZK7 | protein_coding | deleterious(0.02) | benign(0.275) | TCGA-A2-A25A-01 | Breast | breast invasive carcinoma | Female | <65 | I/II | Unspecific | Cytoxan | SD | |
| TBL1XR1 | SNV | Missense_Mutation | c.1256N>T | p.Ser419Phe | p.S419F | Q9BZK7 | protein_coding | deleterious(0) | probably_damaging(0.999) | TCGA-A8-A09V-01 | Breast | breast invasive carcinoma | Female | <65 | I/II | Hormone Therapy | tamoxiphen | SD | |
| TBL1XR1 | SNV | Missense_Mutation | rs372813783 | c.346G>T | p.Ala116Ser | p.A116S | Q9BZK7 | protein_coding | tolerated(0.67) | benign(0) | TCGA-AR-A0U2-01 | Breast | breast invasive carcinoma | Female | <65 | III/IV | Hormone Therapy | tamoxiphen | PD |
| TBL1XR1 | SNV | Missense_Mutation | c.854N>T | p.Gly285Val | p.G285V | Q9BZK7 | protein_coding | deleterious(0.04) | probably_damaging(0.992) | TCGA-B6-A0RN-01 | Breast | breast invasive carcinoma | Female | <65 | I/II | Unknown | Unknown | SD | |
| TBL1XR1 | insertion | Frame_Shift_Ins | novel | c.423_424insTA | p.Ala142Ter | p.A142* | Q9BZK7 | protein_coding | TCGA-BH-A18P-01 | Breast | breast invasive carcinoma | Female | <65 | I/II | Unknown | Unknown | PD | ||
| TBL1XR1 | insertion | Frame_Shift_Ins | novel | c.423_424insTA | p.Ala142Ter | p.A142* | Q9BZK7 | protein_coding | TCGA-BH-A18R-01 | Breast | breast invasive carcinoma | Female | <65 | I/II | Unknown | Unknown | SD | ||
| TBL1XR1 | insertion | Frame_Shift_Ins | novel | c.423_424insTA | p.Ala142Ter | p.A142* | Q9BZK7 | protein_coding | TCGA-BH-A1FL-01 | Breast | breast invasive carcinoma | Female | >=65 | I/II | Unknown | Unknown | PD | ||
| TBL1XR1 | SNV | Missense_Mutation | novel | c.65N>T | p.Ser22Phe | p.S22F | Q9BZK7 | protein_coding | tolerated(0.09) | benign(0.014) | TCGA-4J-AA1J-01 | Cervix | cervical & endocervical cancer | Female | <65 | I/II | Unknown | Unknown | SD |
| TBL1XR1 | SNV | Missense_Mutation | novel | c.241N>G | p.Leu81Val | p.L81V | Q9BZK7 | protein_coding | deleterious(0.01) | probably_damaging(0.912) | TCGA-C5-A1M7-01 | Cervix | cervical & endocervical cancer | Female | <65 | I/II | Unknown | Unknown | SD |
| Page: 1 2 3 4 5 6 7 8 9 10 |
Top |
Related drugs of malignant transformation related genes |
| Identification of chemicals and drugs interact with genes involved in malignant transfromation |
| (DGIdb 4.0) |
| Entrez ID | Symbol | Category | Interaction Types | Drug Claim Name | Drug Name | PMIDs |
| 79718 | TBL1XR1 | TRANSCRIPTION FACTOR, NUCLEAR HORMONE RECEPTOR, CLINICALLY ACTIONABLE | allopurinol | ALLOPURINOL | 30924126 |
| Page: 1 |

Copyright 2023-Present -The University of Texas Health Science Center at Houston |