
|
|||||
|
 | |
| |
| |
| |
| |
| |
|
Gene: TBL1X |
Gene summary for TBL1X |
| Gene information | Species | Human | Gene symbol | TBL1X | Gene ID | 6907 |
| Gene name | transducin beta like 1 X-linked | |
| Gene Alias | CHNG8 | |
| Cytomap | Xp22.31-p22.2 | |
| Gene Type | protein-coding | GO ID | GO:0000122 | UniProtAcc | A0A024RBV9 |
Top |
Malignant transformation analysis |
| Identification of the aberrant gene expression in precancerous and cancerous lesions by comparing the gene expression of stem-like cells in diseased tissues with normal stem cells |
| Entrez ID | Symbol | Replicates | Species | Organ | Tissue | Adj P-value | Log2FC | Malignancy |
| 6907 | TBL1X | CCI_2 | Human | Cervix | CC | 4.25e-04 | 6.25e-01 | 0.5249 |
| 6907 | TBL1X | P2T-E | Human | Esophagus | ESCC | 1.71e-06 | 2.01e-01 | 0.1177 |
| 6907 | TBL1X | P4T-E | Human | Esophagus | ESCC | 3.54e-06 | 2.27e-01 | 0.1323 |
| 6907 | TBL1X | P5T-E | Human | Esophagus | ESCC | 4.50e-04 | 1.20e-01 | 0.1327 |
| 6907 | TBL1X | P8T-E | Human | Esophagus | ESCC | 3.39e-07 | 1.55e-01 | 0.0889 |
| 6907 | TBL1X | P9T-E | Human | Esophagus | ESCC | 4.08e-06 | 1.50e-01 | 0.1131 |
| 6907 | TBL1X | P10T-E | Human | Esophagus | ESCC | 2.04e-06 | 7.28e-02 | 0.116 |
| 6907 | TBL1X | P12T-E | Human | Esophagus | ESCC | 8.67e-23 | 3.98e-01 | 0.1122 |
| 6907 | TBL1X | P15T-E | Human | Esophagus | ESCC | 2.11e-09 | 2.43e-01 | 0.1149 |
| 6907 | TBL1X | P16T-E | Human | Esophagus | ESCC | 6.11e-14 | 1.47e-01 | 0.1153 |
| 6907 | TBL1X | P20T-E | Human | Esophagus | ESCC | 3.32e-02 | 5.59e-02 | 0.1124 |
| 6907 | TBL1X | P21T-E | Human | Esophagus | ESCC | 8.34e-04 | 9.17e-02 | 0.1617 |
| 6907 | TBL1X | P23T-E | Human | Esophagus | ESCC | 9.80e-11 | 3.79e-01 | 0.108 |
| 6907 | TBL1X | P26T-E | Human | Esophagus | ESCC | 4.15e-27 | 5.64e-01 | 0.1276 |
| 6907 | TBL1X | P27T-E | Human | Esophagus | ESCC | 1.25e-09 | 1.54e-01 | 0.1055 |
| 6907 | TBL1X | P28T-E | Human | Esophagus | ESCC | 1.54e-16 | 3.22e-01 | 0.1149 |
| 6907 | TBL1X | P30T-E | Human | Esophagus | ESCC | 1.87e-22 | 7.93e-01 | 0.137 |
| 6907 | TBL1X | P31T-E | Human | Esophagus | ESCC | 4.04e-02 | 3.27e-02 | 0.1251 |
| 6907 | TBL1X | P36T-E | Human | Esophagus | ESCC | 3.96e-03 | 2.22e-01 | 0.1187 |
| 6907 | TBL1X | P39T-E | Human | Esophagus | ESCC | 5.71e-12 | 2.54e-01 | 0.0894 |
| Page: 1 2 3 4 |
| Tissue | Expression Dynamics | Abbreviation |
| Cervix | 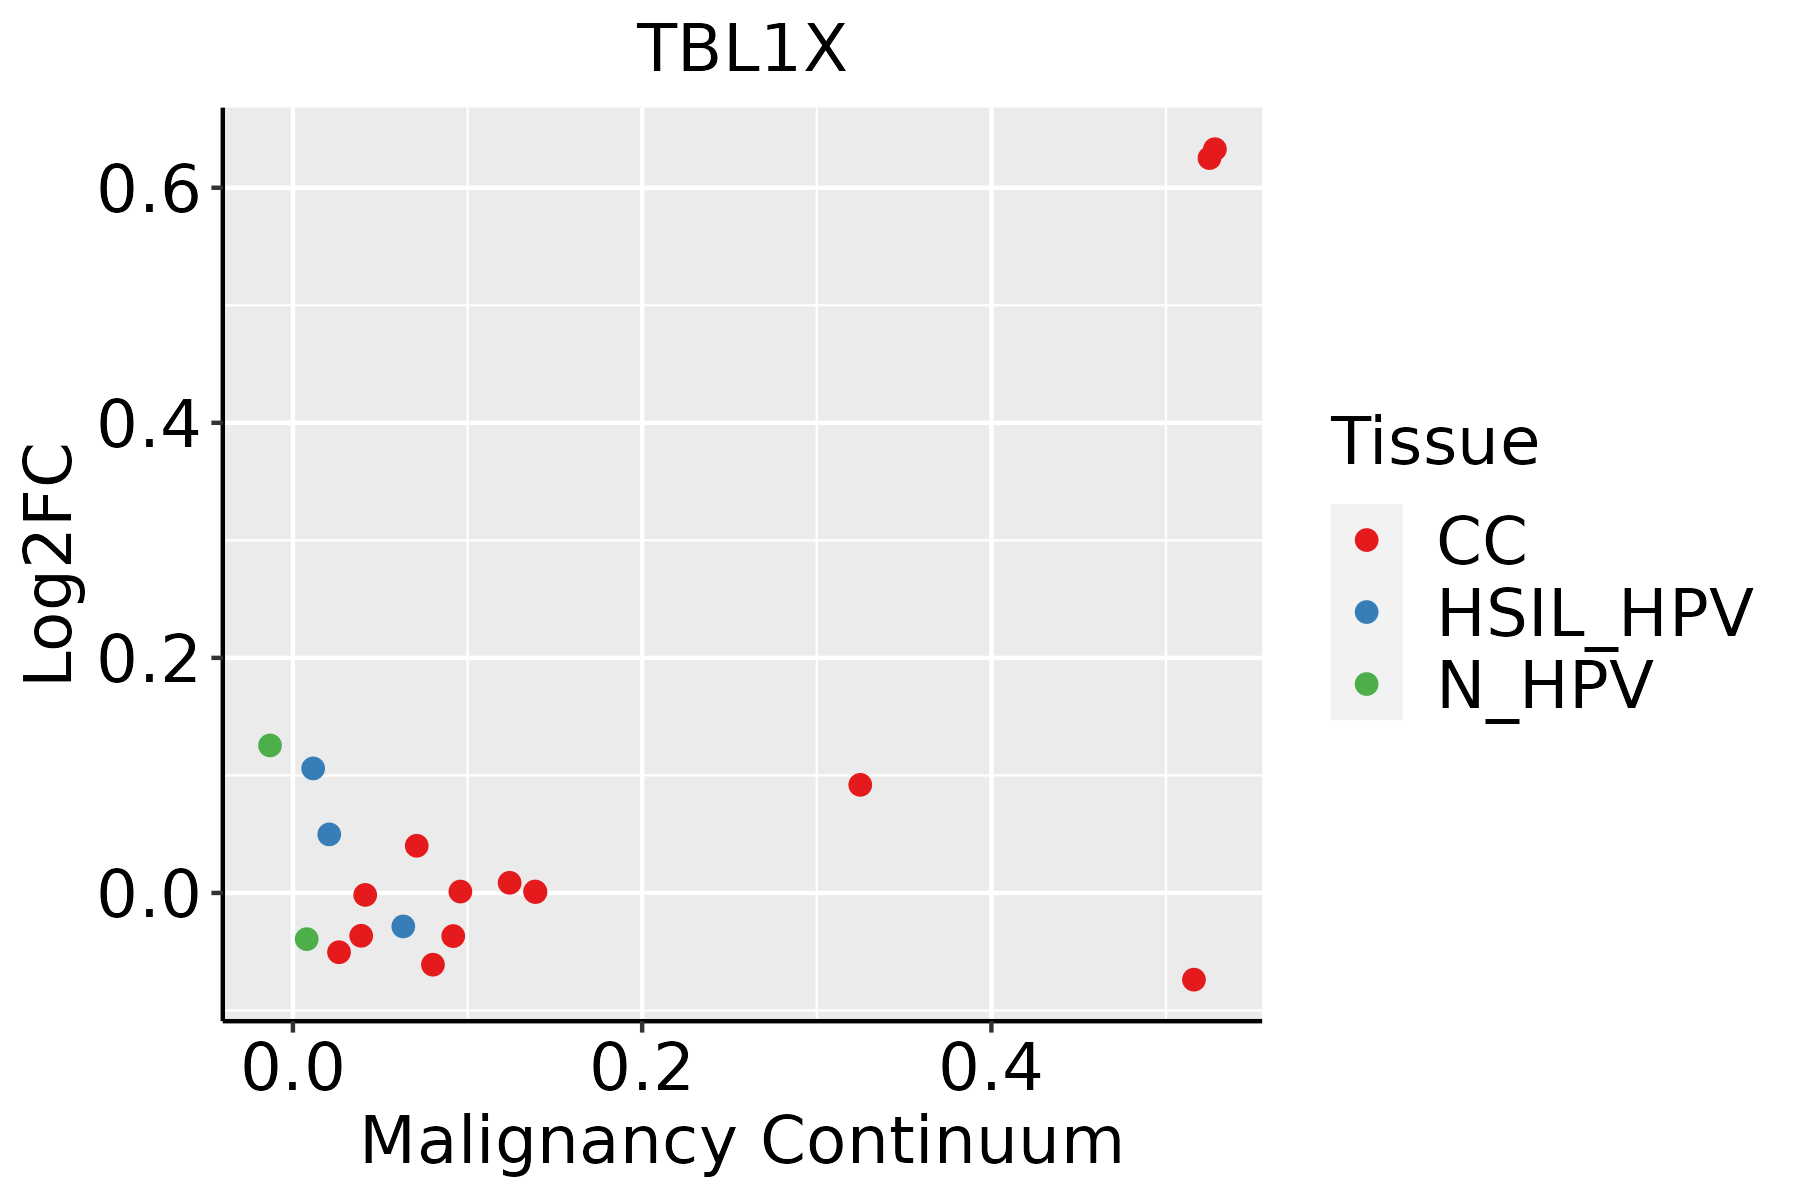 | CC: Cervix cancer |
| HSIL_HPV: HPV-infected high-grade squamous intraepithelial lesions | ||
| N_HPV: HPV-infected normal cervix | ||
| Esophagus | 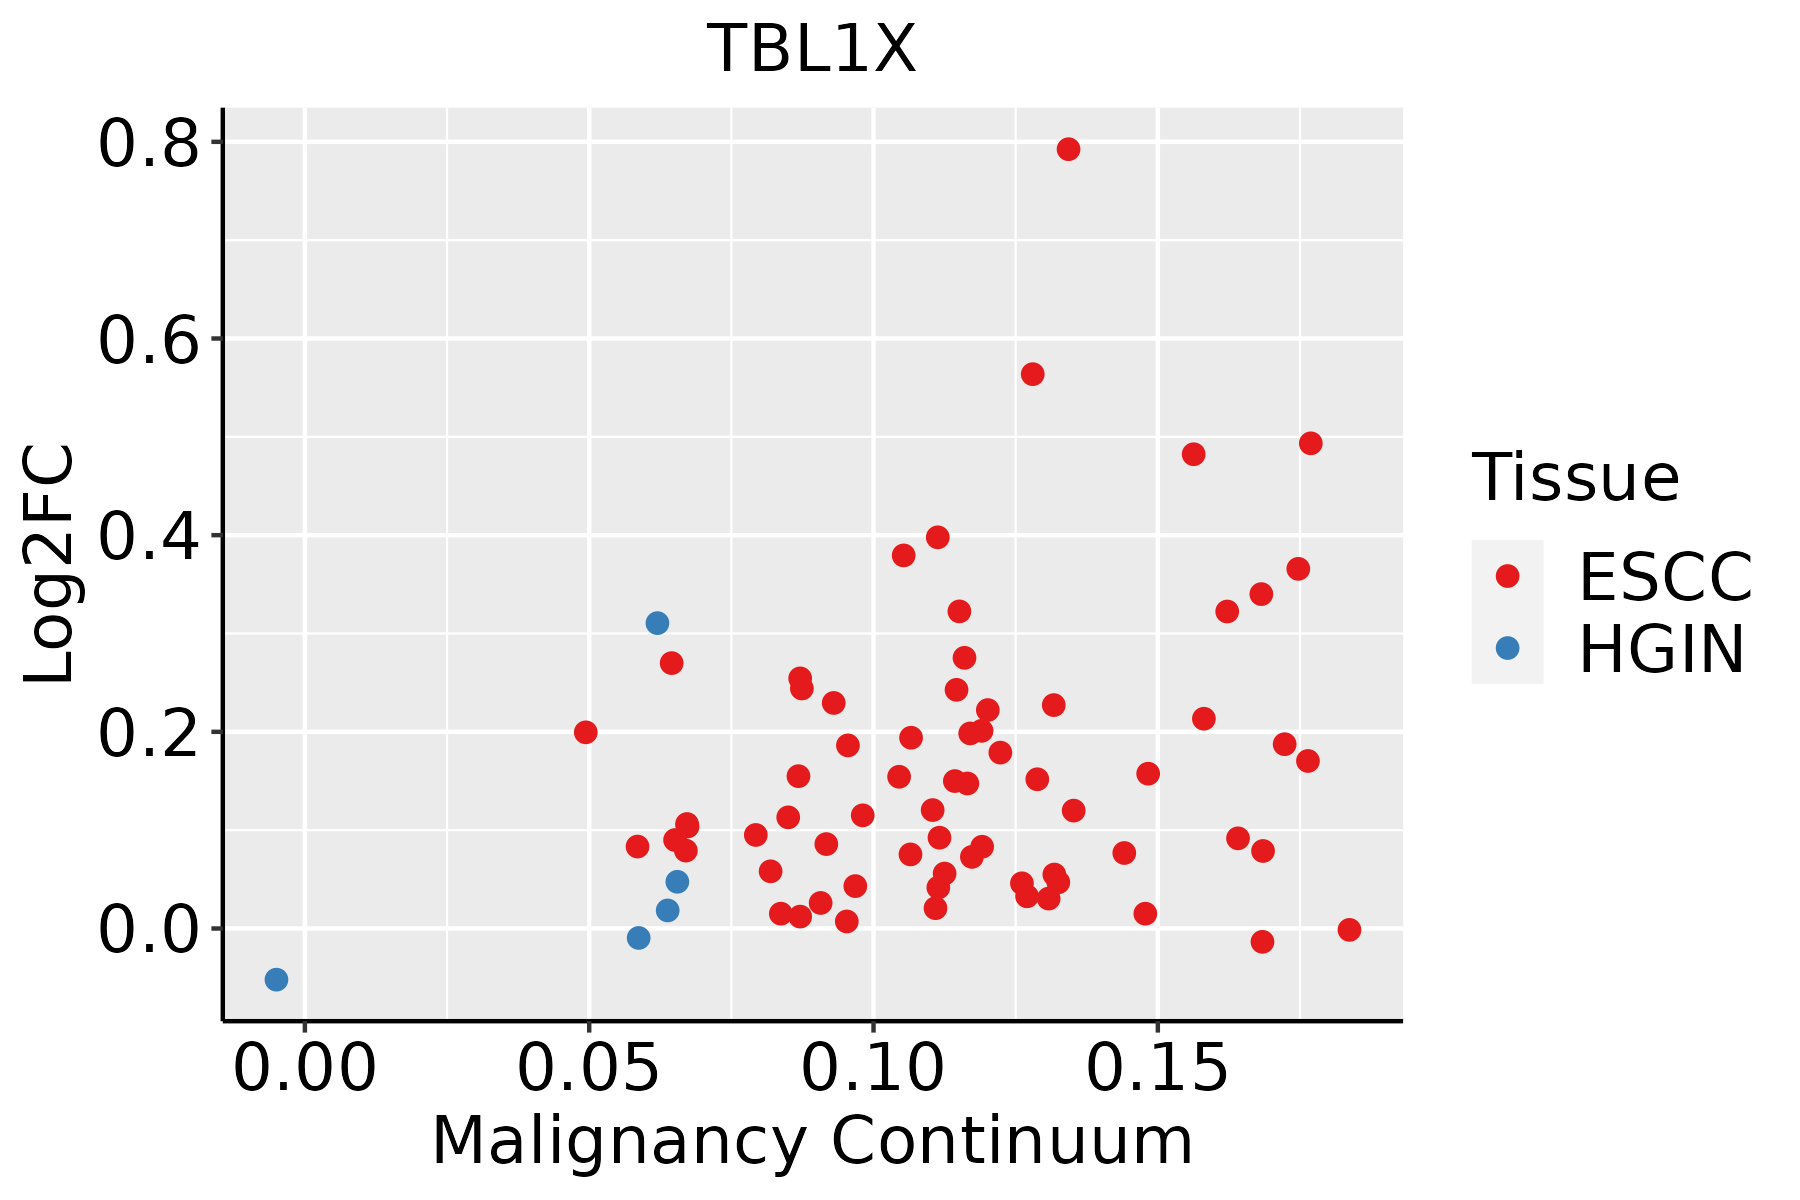 | ESCC: Esophageal squamous cell carcinoma |
| HGIN: High-grade intraepithelial neoplasias | ||
| LGIN: Low-grade intraepithelial neoplasias | ||
| Liver |  | HCC: Hepatocellular carcinoma |
| NAFLD: Non-alcoholic fatty liver disease | ||
| Lung |  | AAH: Atypical adenomatous hyperplasia |
| AIS: Adenocarcinoma in situ | ||
| IAC: Invasive lung adenocarcinoma | ||
| MIA: Minimally invasive adenocarcinoma | ||
| Thyroid | 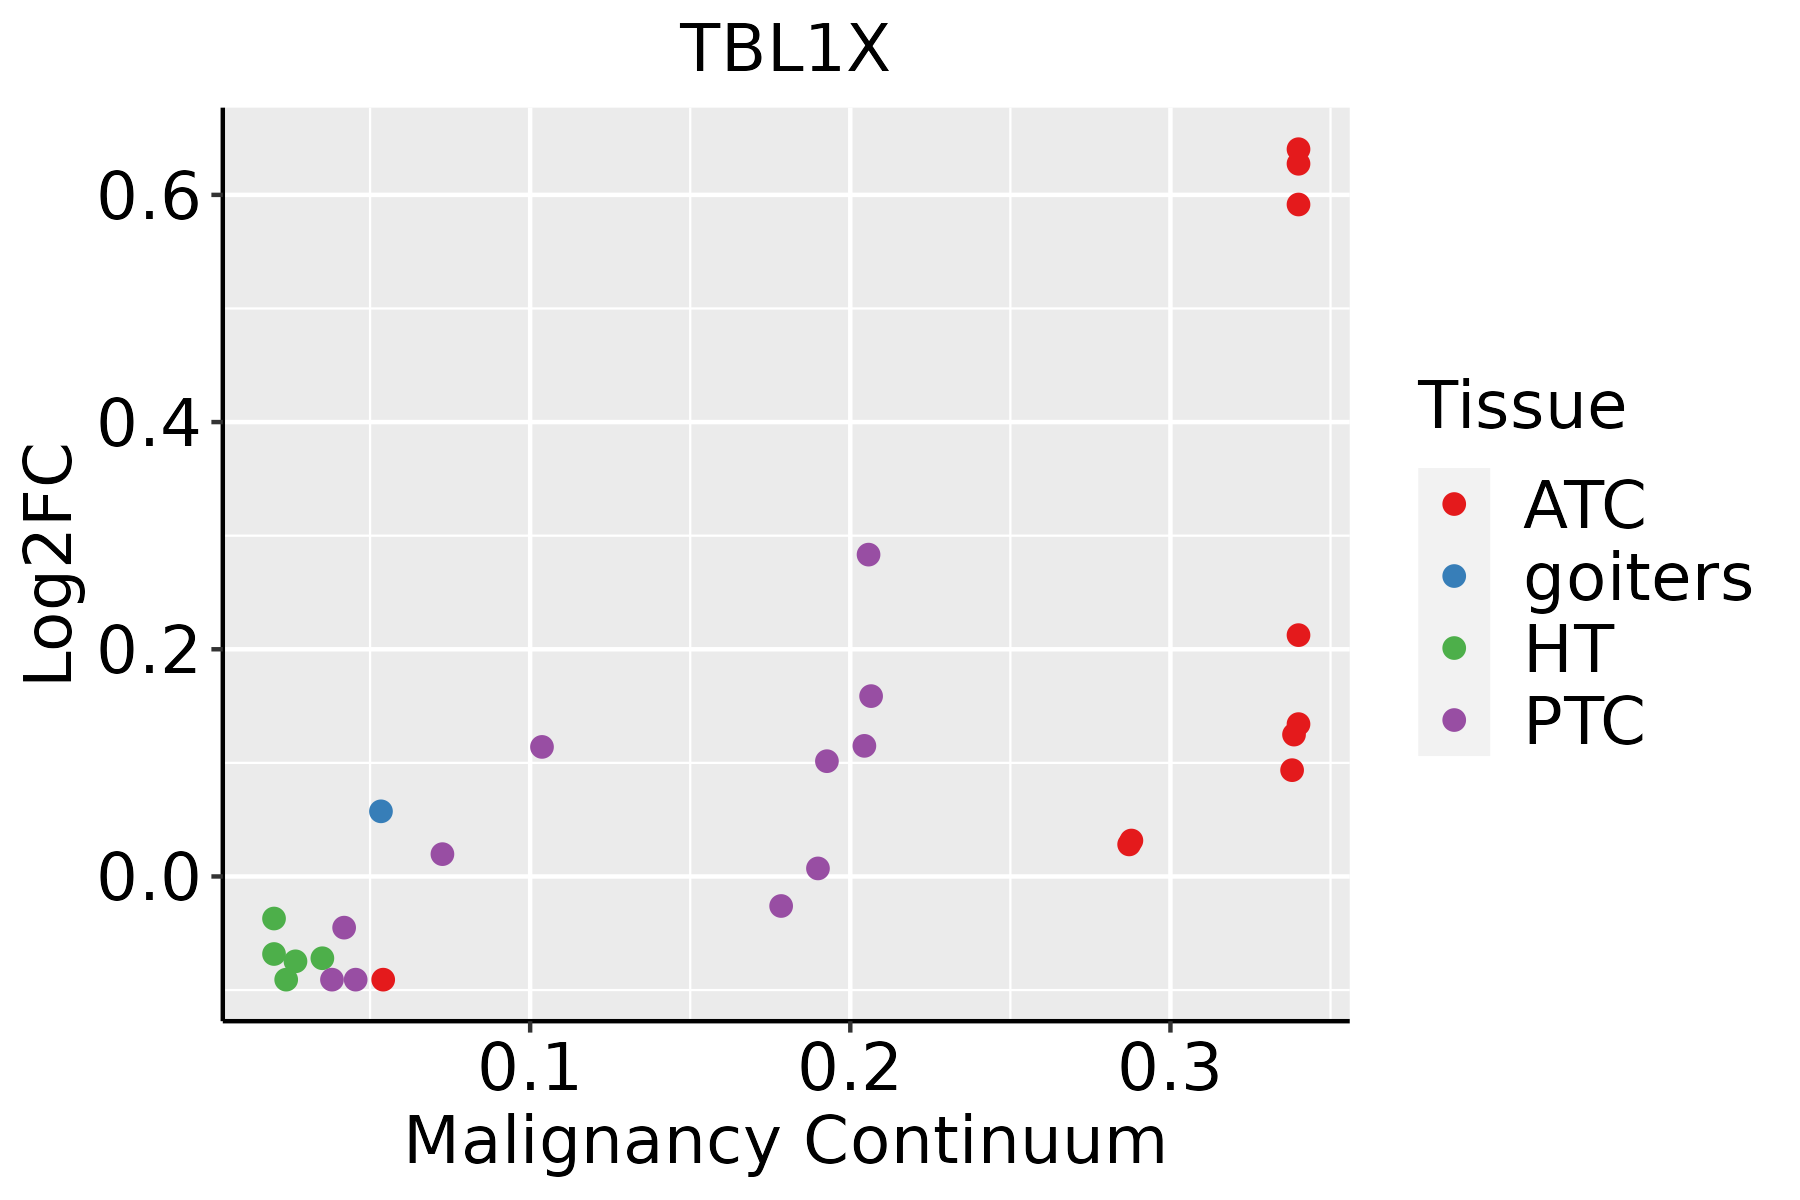 | ATC: Anaplastic thyroid cancer |
| HT: Hashimoto's thyroiditis | ||
| PTC: Papillary thyroid cancer |
| ∗log2FC in expression of this searched gene in stem-like cells from each diseased tissue sample relative to stem-like cells in normal samples in each tissue plotted against the malignancy continuum. Samples are colored based on if they are from different disease stage. |
Top |
Malignant transformation related pathway analysis |
| Find out the enriched GO biological processes and KEGG pathways involved in transition from healthy to precancer to cancer |
| Tissue | Disease Stage | Enriched GO biological Processes |
| Colorectum | AD |  |
| Colorectum | SER |  |
| Colorectum | MSS |  |
| Colorectum | MSI-H |  |
| Colorectum | FAP |  |
| ∗Top 15 enriched GO BP terms are showed in the bar plot of each disease state in each tissue. Each row represents a significant GO biological process which is colored according to the -log10(p.adjust). |
| Page: 1 2 3 4 5 6 7 8 9 |
| GO ID | Tissue | Disease Stage | Description | Gene Ratio | Bg Ratio | pvalue | p.adjust | Count |
| GO:00104989 | Breast | Precancer | proteasomal protein catabolic process | 58/1080 | 490/18723 | 1.54e-07 | 8.05e-06 | 58 |
| GO:00431619 | Breast | Precancer | proteasome-mediated ubiquitin-dependent protein catabolic process | 42/1080 | 412/18723 | 2.49e-04 | 3.72e-03 | 42 |
| GO:001049814 | Breast | IDC | proteasomal protein catabolic process | 75/1434 | 490/18723 | 5.59e-09 | 4.41e-07 | 75 |
| GO:004316114 | Breast | IDC | proteasome-mediated ubiquitin-dependent protein catabolic process | 57/1434 | 412/18723 | 9.55e-06 | 2.68e-04 | 57 |
| GO:001049824 | Breast | DCIS | proteasomal protein catabolic process | 75/1390 | 490/18723 | 1.44e-09 | 1.40e-07 | 75 |
| GO:004316124 | Breast | DCIS | proteasome-mediated ubiquitin-dependent protein catabolic process | 57/1390 | 412/18723 | 3.76e-06 | 1.16e-04 | 57 |
| GO:001049810 | Cervix | CC | proteasomal protein catabolic process | 111/2311 | 490/18723 | 8.98e-11 | 1.58e-08 | 111 |
| GO:00160557 | Cervix | CC | Wnt signaling pathway | 98/2311 | 444/18723 | 4.82e-09 | 4.65e-07 | 98 |
| GO:01987387 | Cervix | CC | cell-cell signaling by wnt | 98/2311 | 446/18723 | 6.16e-09 | 5.58e-07 | 98 |
| GO:004316110 | Cervix | CC | proteasome-mediated ubiquitin-dependent protein catabolic process | 91/2311 | 412/18723 | 1.65e-08 | 1.25e-06 | 91 |
| GO:00301117 | Cervix | CC | regulation of Wnt signaling pathway | 76/2311 | 328/18723 | 3.05e-08 | 2.08e-06 | 76 |
| GO:00608287 | Cervix | CC | regulation of canonical Wnt signaling pathway | 58/2311 | 253/18723 | 1.83e-06 | 5.89e-05 | 58 |
| GO:00600707 | Cervix | CC | canonical Wnt signaling pathway | 66/2311 | 303/18723 | 2.47e-06 | 7.35e-05 | 66 |
| GO:003164710 | Cervix | CC | regulation of protein stability | 63/2311 | 298/18723 | 1.14e-05 | 2.45e-04 | 63 |
| GO:005082110 | Cervix | CC | protein stabilization | 43/2311 | 191/18723 | 5.90e-05 | 8.54e-04 | 43 |
| GO:00165705 | Cervix | CC | histone modification | 84/2311 | 463/18723 | 1.70e-04 | 2.01e-03 | 84 |
| GO:00301776 | Cervix | CC | positive regulation of Wnt signaling pathway | 31/2311 | 140/18723 | 8.01e-04 | 7.02e-03 | 31 |
| GO:00902636 | Cervix | CC | positive regulation of canonical Wnt signaling pathway | 22/2311 | 106/18723 | 9.52e-03 | 4.72e-02 | 22 |
| GO:0010498 | Colorectum | AD | proteasomal protein catabolic process | 174/3918 | 490/18723 | 3.18e-14 | 7.66e-12 | 174 |
| GO:0043161 | Colorectum | AD | proteasome-mediated ubiquitin-dependent protein catabolic process | 141/3918 | 412/18723 | 1.77e-10 | 1.68e-08 | 141 |
| Page: 1 2 3 4 5 6 7 8 9 10 11 12 13 14 15 16 17 |
| Pathway ID | Tissue | Disease Stage | Description | Gene Ratio | Bg Ratio | pvalue | p.adjust | qvalue | Count |
| hsa043109 | Cervix | CC | Wnt signaling pathway | 43/1267 | 171/8465 | 3.03e-04 | 1.64e-03 | 9.68e-04 | 43 |
| hsa0431012 | Cervix | CC | Wnt signaling pathway | 43/1267 | 171/8465 | 3.03e-04 | 1.64e-03 | 9.68e-04 | 43 |
| hsa043108 | Lung | IAC | Wnt signaling pathway | 40/1053 | 171/8465 | 4.56e-05 | 7.06e-04 | 4.69e-04 | 40 |
| hsa0431011 | Lung | IAC | Wnt signaling pathway | 40/1053 | 171/8465 | 4.56e-05 | 7.06e-04 | 4.69e-04 | 40 |
| Page: 1 |
Top |
Cell-cell communication analysis |
| Identification of potential cell-cell interactions between two cell types and their ligand-receptor pairs for different disease states |
| Ligand | Receptor | LRpair | Pathway | Tissue | Disease Stage |
| Page: 1 |
Top |
Single-cell gene regulatory network inference analysis |
| Find out the significant the regulons (TFs) and the target genes of each regulon across cell types for different disease states |
| TF | Cell Type | Tissue | Disease Stage | Target Gene | RSS | Regulon Activity |
| ∗The dot plots of a searched regulon are shown for all cell subpopulations in each disease state of each tissue based on the regulon specific score inferred using pySCENIC and by calculating the average expression. |
| Page: 1 |
Top |
Somatic mutation of malignant transformation related genes |
| Annotation of somatic variants for genes involved in malignant transformation |
| Hugo Symbol | Variant Class | Variant Classification | dbSNP RS | HGVSc | HGVSp | HGVSp Short | SWISSPROT | BIOTYPE | SIFT | PolyPhen | Tumor Sample Barcode | Tissue | Histology | Sex | Age | Stage | Therapy Types | Drugs | Outcome |
| TBL1X | SNV | Missense_Mutation | c.1673N>T | p.Gly558Val | p.G558V | O60907 | protein_coding | deleterious(0) | probably_damaging(0.996) | TCGA-A2-A0CT-01 | Breast | breast invasive carcinoma | Female | >=65 | I/II | Chemotherapy | cytoxan | SD | |
| TBL1X | SNV | Missense_Mutation | c.947N>T | p.Thr316Met | p.T316M | O60907 | protein_coding | deleterious(0.04) | benign(0.103) | TCGA-A8-A06O-01 | Breast | breast invasive carcinoma | Female | <65 | I/II | Hormone Therapy | letrozole | SD | |
| TBL1X | SNV | Missense_Mutation | c.625N>A | p.Ala209Thr | p.A209T | O60907 | protein_coding | tolerated(0.61) | benign(0) | TCGA-A8-A09Z-01 | Breast | breast invasive carcinoma | Female | >=65 | I/II | Unknown | Unknown | SD | |
| TBL1X | SNV | Missense_Mutation | c.1011N>T | p.Trp337Cys | p.W337C | O60907 | protein_coding | deleterious(0) | probably_damaging(1) | TCGA-AN-A0FD-01 | Breast | breast invasive carcinoma | Female | >=65 | I/II | Unknown | Unknown | SD | |
| TBL1X | SNV | Missense_Mutation | c.1459N>C | p.Val487Leu | p.V487L | O60907 | protein_coding | deleterious(0.01) | possibly_damaging(0.9) | TCGA-E2-A1IL-01 | Breast | breast invasive carcinoma | Female | >=65 | I/II | Hormone Therapy | arimidex | SD | |
| TBL1X | insertion | In_Frame_Ins | novel | c.869_870insAAAATGTTTCTGGAAACAAAAGAGCCCTTTAAGTGTGTTTCT | p.Asp290delinsGluLysCysPheTrpLysGlnLysSerProLeuSerValPheLeu | p.D290delinsEKCFWKQKSPLSVFL | O60907 | protein_coding | TCGA-A8-A09D-01 | Breast | breast invasive carcinoma | Female | <65 | I/II | Chemotherapy | doxorubicin | CR | ||
| TBL1X | SNV | Missense_Mutation | c.1140N>C | p.Gln380His | p.Q380H | O60907 | protein_coding | deleterious(0.05) | probably_damaging(0.967) | TCGA-DG-A2KK-01 | Cervix | cervical & endocervical cancer | Female | <65 | III/IV | Chemotherapy | cisplatin | SD | |
| TBL1X | SNV | Missense_Mutation | rs746301021 | c.1726N>T | p.Arg576Trp | p.R576W | O60907 | protein_coding | deleterious(0) | probably_damaging(0.987) | TCGA-AA-3695-01 | Colorectum | colon adenocarcinoma | Female | <65 | III/IV | Unknown | Unknown | SD |
| TBL1X | SNV | Missense_Mutation | rs752103477 | c.1499N>T | p.Thr500Met | p.T500M | O60907 | protein_coding | deleterious(0) | probably_damaging(0.982) | TCGA-AA-3864-01 | Colorectum | colon adenocarcinoma | Male | >=65 | I/II | Unknown | Unknown | SD |
| TBL1X | SNV | Missense_Mutation | c.625N>A | p.Ala209Thr | p.A209T | O60907 | protein_coding | tolerated(0.61) | benign(0) | TCGA-G4-6304-01 | Colorectum | colon adenocarcinoma | Female | >=65 | I/II | Chemotherapy | fluorouracil | PD |
| Page: 1 2 3 4 5 6 7 |
Top |
Related drugs of malignant transformation related genes |
| Identification of chemicals and drugs interact with genes involved in malignant transfromation |
| (DGIdb 4.0) |
| Entrez ID | Symbol | Category | Interaction Types | Drug Claim Name | Drug Name | PMIDs |
| Page: 1 |

Copyright 2023-Present -The University of Texas Health Science Center at Houston |