| Tissue | Expression Dynamics | Abbreviation |
| Esophagus |  | ESCC: Esophageal squamous cell carcinoma |
| HGIN: High-grade intraepithelial neoplasias |
| LGIN: Low-grade intraepithelial neoplasias |
| Lung |  | AAH: Atypical adenomatous hyperplasia |
| AIS: Adenocarcinoma in situ |
| IAC: Invasive lung adenocarcinoma |
| MIA: Minimally invasive adenocarcinoma |
| Oral Cavity | 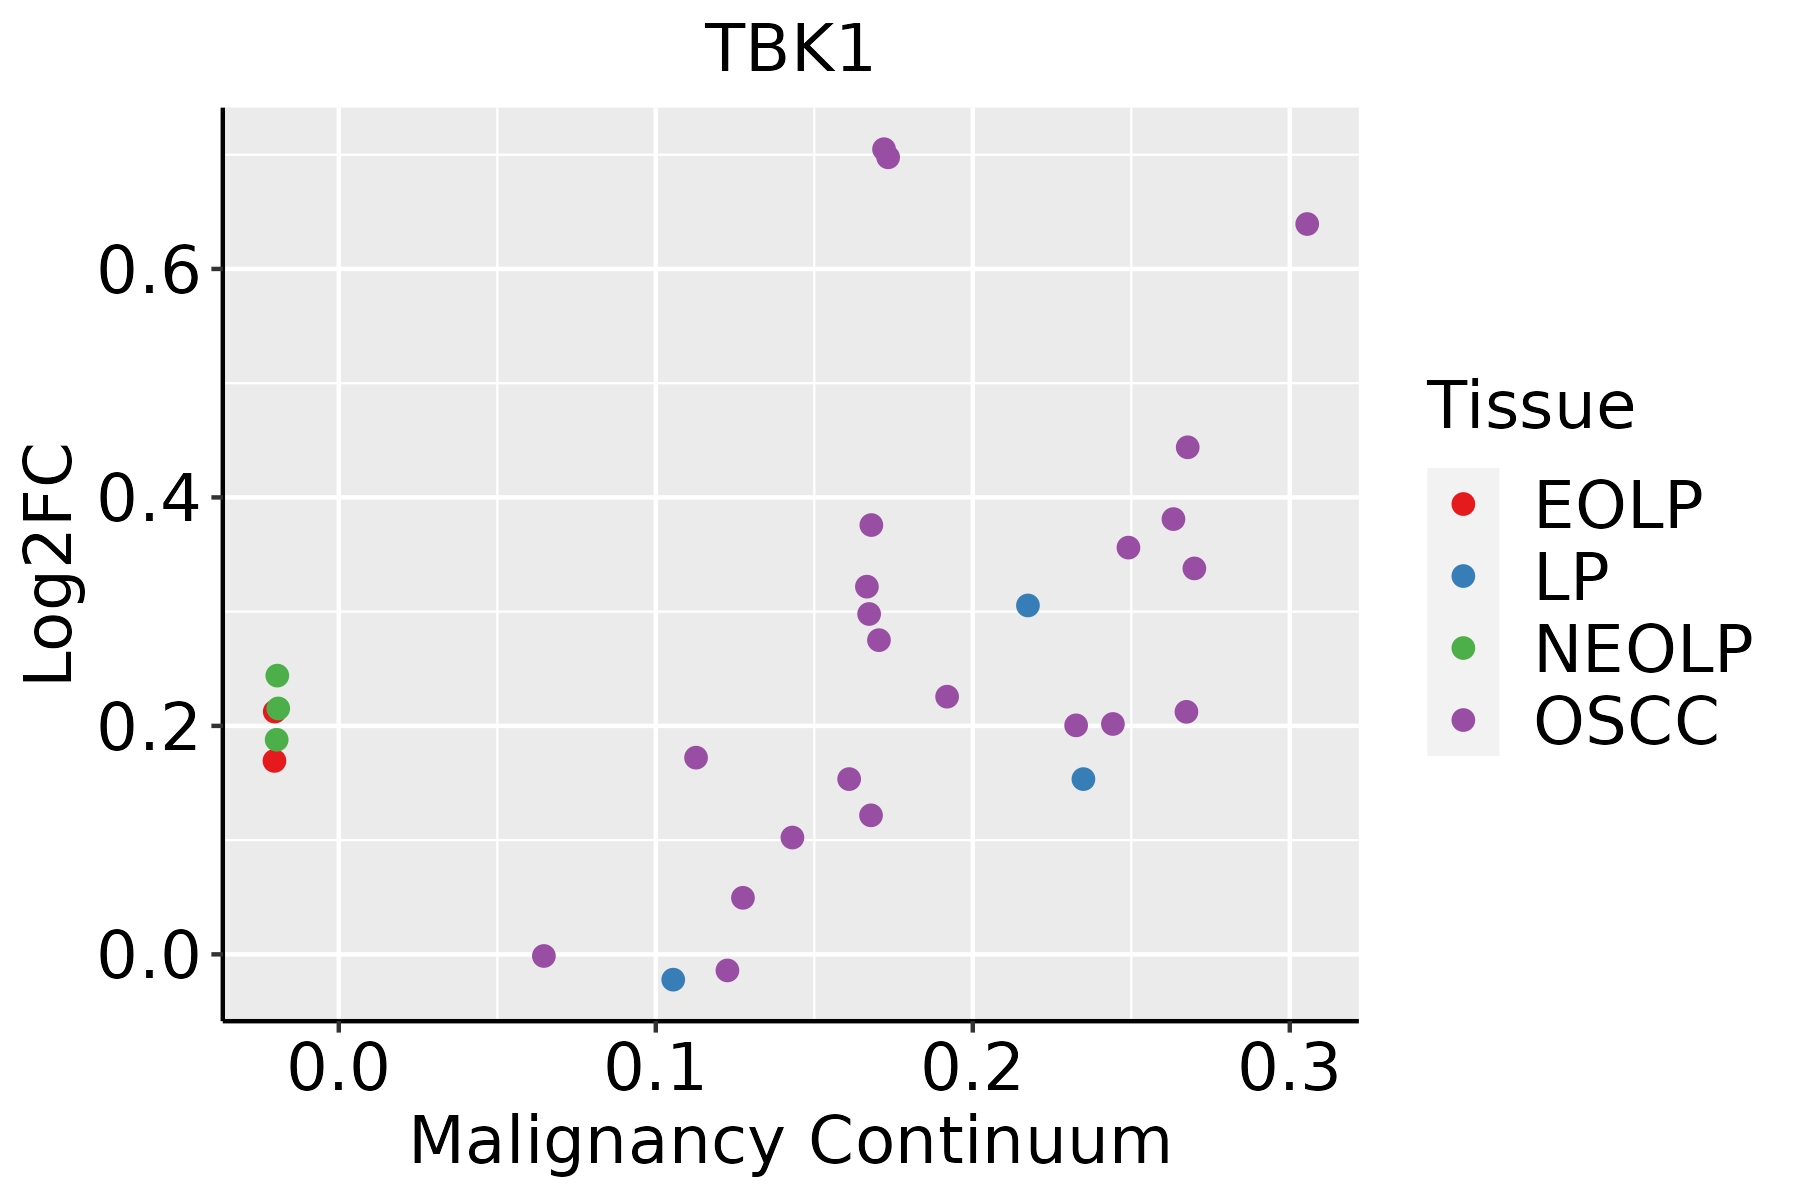 | EOLP: Erosive Oral lichen planus |
| LP: leukoplakia |
| NEOLP: Non-erosive oral lichen planus |
| OSCC: Oral squamous cell carcinoma |
| GO ID | Tissue | Disease Stage | Description | Gene Ratio | Bg Ratio | pvalue | p.adjust | Count |
| GO:001623617 | Esophagus | ESCC | macroautophagy | 216/8552 | 291/18723 | 1.94e-23 | 4.57e-21 | 216 |
| GO:0009896111 | Esophagus | ESCC | positive regulation of catabolic process | 332/8552 | 492/18723 | 4.36e-23 | 9.22e-21 | 332 |
| GO:0031331111 | Esophagus | ESCC | positive regulation of cellular catabolic process | 292/8552 | 427/18723 | 8.67e-22 | 1.53e-19 | 292 |
| GO:001050617 | Esophagus | ESCC | regulation of autophagy | 220/8552 | 317/18723 | 6.72e-18 | 6.36e-16 | 220 |
| GO:000961518 | Esophagus | ESCC | response to virus | 238/8552 | 367/18723 | 6.65e-14 | 3.32e-12 | 238 |
| GO:004312318 | Esophagus | ESCC | positive regulation of I-kappaB kinase/NF-kappaB signaling | 132/8552 | 186/18723 | 2.07e-12 | 8.58e-11 | 132 |
| GO:0043122110 | Esophagus | ESCC | regulation of I-kappaB kinase/NF-kappaB signaling | 167/8552 | 249/18723 | 6.11e-12 | 2.32e-10 | 167 |
| GO:000724919 | Esophagus | ESCC | I-kappaB kinase/NF-kappaB signaling | 183/8552 | 281/18723 | 3.02e-11 | 1.01e-09 | 183 |
| GO:001624114 | Esophagus | ESCC | regulation of macroautophagy | 102/8552 | 141/18723 | 1.09e-10 | 3.27e-09 | 102 |
| GO:00516075 | Esophagus | ESCC | defense response to virus | 171/8552 | 265/18723 | 3.91e-10 | 1.05e-08 | 171 |
| GO:01405465 | Esophagus | ESCC | defense response to symbiont | 171/8552 | 265/18723 | 3.91e-10 | 1.05e-08 | 171 |
| GO:003434013 | Esophagus | ESCC | response to type I interferon | 48/8552 | 58/18723 | 6.18e-09 | 1.26e-07 | 48 |
| GO:0070997111 | Esophagus | ESCC | neuron death | 216/8552 | 361/18723 | 3.49e-08 | 6.45e-07 | 216 |
| GO:00603375 | Esophagus | ESCC | type I interferon signaling pathway | 41/8552 | 50/18723 | 1.35e-07 | 2.17e-06 | 41 |
| GO:00713575 | Esophagus | ESCC | cellular response to type I interferon | 42/8552 | 52/18723 | 2.15e-07 | 3.30e-06 | 42 |
| GO:00028318 | Esophagus | ESCC | regulation of response to biotic stimulus | 191/8552 | 327/18723 | 2.12e-06 | 2.45e-05 | 191 |
| GO:00182099 | Esophagus | ESCC | peptidyl-serine modification | 196/8552 | 338/18723 | 3.07e-06 | 3.47e-05 | 196 |
| GO:00607595 | Esophagus | ESCC | regulation of response to cytokine stimulus | 103/8552 | 162/18723 | 3.14e-06 | 3.53e-05 | 103 |
| GO:001810515 | Esophagus | ESCC | peptidyl-serine phosphorylation | 184/8552 | 315/18723 | 3.22e-06 | 3.61e-05 | 184 |
| GO:1901214111 | Esophagus | ESCC | regulation of neuron death | 186/8552 | 319/18723 | 3.35e-06 | 3.73e-05 | 186 |
| Pathway ID | Tissue | Disease Stage | Description | Gene Ratio | Bg Ratio | pvalue | p.adjust | qvalue | Count |
| hsa05014210 | Esophagus | ESCC | Amyotrophic lateral sclerosis | 266/4205 | 364/8465 | 1.31e-20 | 2.20e-18 | 1.13e-18 | 266 |
| hsa05022210 | Esophagus | ESCC | Pathways of neurodegeneration - multiple diseases | 318/4205 | 476/8465 | 6.10e-15 | 2.04e-13 | 1.05e-13 | 318 |
| hsa05169210 | Esophagus | ESCC | Epstein-Barr virus infection | 151/4205 | 202/8465 | 1.55e-13 | 3.45e-12 | 1.77e-12 | 151 |
| hsa05131211 | Esophagus | ESCC | Shigellosis | 176/4205 | 247/8465 | 2.27e-12 | 4.01e-11 | 2.05e-11 | 176 |
| hsa05170210 | Esophagus | ESCC | Human immunodeficiency virus 1 infection | 147/4205 | 212/8465 | 3.37e-09 | 3.53e-08 | 1.81e-08 | 147 |
| hsa05167211 | Esophagus | ESCC | Kaposi sarcoma-associated herpesvirus infection | 136/4205 | 194/8465 | 4.28e-09 | 4.22e-08 | 2.16e-08 | 136 |
| hsa0516425 | Esophagus | ESCC | Influenza A | 122/4205 | 171/8465 | 5.01e-09 | 4.79e-08 | 2.45e-08 | 122 |
| hsa0516510 | Esophagus | ESCC | Human papillomavirus infection | 215/4205 | 331/8465 | 7.86e-09 | 7.12e-08 | 3.65e-08 | 215 |
| hsa0513526 | Esophagus | ESCC | Yersinia infection | 100/4205 | 137/8465 | 1.80e-08 | 1.59e-07 | 8.12e-08 | 100 |
| hsa05171211 | Esophagus | ESCC | Coronavirus disease - COVID-19 | 156/4205 | 232/8465 | 3.18e-08 | 2.68e-07 | 1.37e-07 | 156 |
| hsa0414010 | Esophagus | ESCC | Autophagy - animal | 101/4205 | 141/8465 | 7.60e-08 | 6.21e-07 | 3.18e-07 | 101 |
| hsa05417211 | Esophagus | ESCC | Lipid and atherosclerosis | 143/4205 | 215/8465 | 3.30e-07 | 2.45e-06 | 1.26e-06 | 143 |
| hsa05163210 | Esophagus | ESCC | Human cytomegalovirus infection | 148/4205 | 225/8465 | 5.73e-07 | 4.00e-06 | 2.05e-06 | 148 |
| hsa051609 | Esophagus | ESCC | Hepatitis C | 107/4205 | 157/8465 | 1.75e-06 | 1.08e-05 | 5.55e-06 | 107 |
| hsa051619 | Esophagus | ESCC | Hepatitis B | 108/4205 | 162/8465 | 7.68e-06 | 4.15e-05 | 2.12e-05 | 108 |
| hsa04137210 | Esophagus | ESCC | Mitophagy - animal | 54/4205 | 72/8465 | 9.33e-06 | 4.96e-05 | 2.54e-05 | 54 |
| hsa0465727 | Esophagus | ESCC | IL-17 signaling pathway | 66/4205 | 94/8465 | 3.93e-05 | 1.75e-04 | 8.99e-05 | 66 |
| hsa051629 | Esophagus | ESCC | Measles | 90/4205 | 139/8465 | 2.16e-04 | 7.87e-04 | 4.03e-04 | 90 |
| hsa0462122 | Esophagus | ESCC | NOD-like receptor signaling pathway | 116/4205 | 186/8465 | 2.90e-04 | 1.03e-03 | 5.30e-04 | 116 |
| hsa046234 | Esophagus | ESCC | Cytosolic DNA-sensing pathway | 49/4205 | 75/8465 | 4.35e-03 | 1.12e-02 | 5.74e-03 | 49 |
| Hugo Symbol | Variant Class | Variant Classification | dbSNP RS | HGVSc | HGVSp | HGVSp Short | SWISSPROT | BIOTYPE | SIFT | PolyPhen | Tumor Sample Barcode | Tissue | Histology | Sex | Age | Stage | Therapy Types | Drugs | Outcome |
| TBK1 | SNV | Missense_Mutation | novel | c.1664N>A | p.Leu555Gln | p.L555Q | Q9UHD2 | protein_coding | deleterious(0.01) | probably_damaging(0.995) | TCGA-A8-A07J-01 | Breast | breast invasive carcinoma | Female | <65 | I/II | Chemotherapy | 5-fluorouracil | CR |
| TBK1 | SNV | Missense_Mutation | | c.81A>T | p.Arg27Ser | p.R27S | Q9UHD2 | protein_coding | deleterious(0.01) | probably_damaging(0.991) | TCGA-AN-A0FW-01 | Breast | breast invasive carcinoma | Female | >=65 | III/IV | Unknown | Unknown | SD |
| TBK1 | SNV | Missense_Mutation | novel | c.1136N>C | p.Ile379Thr | p.I379T | Q9UHD2 | protein_coding | deleterious(0) | probably_damaging(0.966) | TCGA-LL-A73Y-01 | Breast | breast invasive carcinoma | Female | >=65 | I/II | Chemotherapy | taxotere | SD |
| TBK1 | insertion | Frame_Shift_Ins | novel | c.1662_1663insTT | p.Leu555PhefsTer3 | p.L555Ffs*3 | Q9UHD2 | protein_coding | | | TCGA-A8-A07J-01 | Breast | breast invasive carcinoma | Female | <65 | I/II | Chemotherapy | 5-fluorouracil | CR |
| TBK1 | deletion | Frame_Shift_Del | novel | c.388delN | p.Gly130ValfsTer2 | p.G130Vfs*2 | Q9UHD2 | protein_coding | | | TCGA-D8-A27V-01 | Breast | breast invasive carcinoma | Female | <65 | I/II | Hormone Therapy | tamoxiphen | SD |
| TBK1 | SNV | Missense_Mutation | novel | c.77N>A | p.Gly26Glu | p.G26E | Q9UHD2 | protein_coding | deleterious(0) | probably_damaging(1) | TCGA-C5-A2LZ-01 | Cervix | cervical & endocervical cancer | Female | >=65 | III/IV | Unknown | Unknown | PD |
| TBK1 | SNV | Missense_Mutation | novel | c.1478N>T | p.Ala493Val | p.A493V | Q9UHD2 | protein_coding | tolerated(0.3) | benign(0) | TCGA-EA-A410-01 | Cervix | cervical & endocervical cancer | Female | <65 | I/II | Unknown | Unknown | SD |
| TBK1 | SNV | Missense_Mutation | | c.19N>T | p.His7Tyr | p.H7Y | Q9UHD2 | protein_coding | tolerated(1) | benign(0) | TCGA-Q1-A73O-01 | Cervix | cervical & endocervical cancer | Female | <65 | I/II | Chemotherapy | cisplatin | CR |
| TBK1 | SNV | Missense_Mutation | | c.1738N>A | p.Glu580Lys | p.E580K | Q9UHD2 | protein_coding | deleterious(0.01) | probably_damaging(0.971) | TCGA-Q1-A73O-01 | Cervix | cervical & endocervical cancer | Female | <65 | I/II | Chemotherapy | cisplatin | CR |
| TBK1 | SNV | Missense_Mutation | | c.177N>C | p.Leu59Phe | p.L59F | Q9UHD2 | protein_coding | deleterious(0) | probably_damaging(0.998) | TCGA-VS-A9UO-01 | Cervix | cervical & endocervical cancer | Female | <65 | I/II | Chemotherapy | cisplatin | CR |
| Entrez ID | Symbol | Category | Interaction Types | Drug Claim Name | Drug Name | PMIDs |
| 29110 | TBK1 | ENZYME, SERINE THREONINE KINASE, KINASE, DRUGGABLE GENOME | | TAMATINIB | R-406 | |
| 29110 | TBK1 | ENZYME, SERINE THREONINE KINASE, KINASE, DRUGGABLE GENOME | | AZD-1775 | ADAVOSERTIB | |
| 29110 | TBK1 | ENZYME, SERINE THREONINE KINASE, KINASE, DRUGGABLE GENOME | | DNDI1417467 | CHEMBL1997335 | |
| 29110 | TBK1 | ENZYME, SERINE THREONINE KINASE, KINASE, DRUGGABLE GENOME | | Pyrimidinyl compound 6 | | |
| 29110 | TBK1 | ENZYME, SERINE THREONINE KINASE, KINASE, DRUGGABLE GENOME | | Pyrimidinyl compound 7 | | |
| 29110 | TBK1 | ENZYME, SERINE THREONINE KINASE, KINASE, DRUGGABLE GENOME | | Pyrimidinyl compound 1 | | |
| 29110 | TBK1 | ENZYME, SERINE THREONINE KINASE, KINASE, DRUGGABLE GENOME | | PF-562271 | PF-00562271 | |
| 29110 | TBK1 | ENZYME, SERINE THREONINE KINASE, KINASE, DRUGGABLE GENOME | inhibitor | 336446964 | | |
| 29110 | TBK1 | ENZYME, SERINE THREONINE KINASE, KINASE, DRUGGABLE GENOME | inhibitor | 336446965 | | |
| 29110 | TBK1 | ENZYME, SERINE THREONINE KINASE, KINASE, DRUGGABLE GENOME | | CYC-116 | CYC-116 | |


