
|
|||||
|
 | |
| |
| |
| |
| |
| |
|
Gene: TBCE |
Gene summary for TBCE |
| Gene information | Species | Human | Gene symbol | TBCE | Gene ID | 6905 |
| Gene name | tubulin folding cofactor E | |
| Gene Alias | HRD | |
| Cytomap | 1q42.3 | |
| Gene Type | protein-coding | GO ID | GO:0000226 | UniProtAcc | Q15813 |
Top |
Malignant transformation analysis |
| Identification of the aberrant gene expression in precancerous and cancerous lesions by comparing the gene expression of stem-like cells in diseased tissues with normal stem cells |
| Entrez ID | Symbol | Replicates | Species | Organ | Tissue | Adj P-value | Log2FC | Malignancy |
| 6905 | TBCE | P1T-E | Human | Esophagus | ESCC | 2.18e-08 | 2.72e-01 | 0.0875 |
| 6905 | TBCE | P2T-E | Human | Esophagus | ESCC | 1.98e-18 | 2.63e-01 | 0.1177 |
| 6905 | TBCE | P4T-E | Human | Esophagus | ESCC | 2.11e-15 | 2.44e-01 | 0.1323 |
| 6905 | TBCE | P5T-E | Human | Esophagus | ESCC | 4.88e-33 | 5.52e-01 | 0.1327 |
| 6905 | TBCE | P8T-E | Human | Esophagus | ESCC | 2.73e-35 | 1.57e-01 | 0.0889 |
| 6905 | TBCE | P9T-E | Human | Esophagus | ESCC | 1.66e-12 | 1.99e-01 | 0.1131 |
| 6905 | TBCE | P10T-E | Human | Esophagus | ESCC | 6.81e-27 | 3.98e-01 | 0.116 |
| 6905 | TBCE | P11T-E | Human | Esophagus | ESCC | 6.43e-09 | 3.87e-01 | 0.1426 |
| 6905 | TBCE | P12T-E | Human | Esophagus | ESCC | 2.60e-14 | 1.92e-01 | 0.1122 |
| 6905 | TBCE | P15T-E | Human | Esophagus | ESCC | 1.15e-15 | 3.25e-01 | 0.1149 |
| 6905 | TBCE | P16T-E | Human | Esophagus | ESCC | 1.37e-34 | 3.18e-01 | 0.1153 |
| 6905 | TBCE | P20T-E | Human | Esophagus | ESCC | 6.28e-09 | 2.26e-01 | 0.1124 |
| 6905 | TBCE | P21T-E | Human | Esophagus | ESCC | 6.33e-19 | 3.13e-01 | 0.1617 |
| 6905 | TBCE | P22T-E | Human | Esophagus | ESCC | 2.99e-19 | 1.96e-01 | 0.1236 |
| 6905 | TBCE | P23T-E | Human | Esophagus | ESCC | 1.76e-18 | 3.34e-01 | 0.108 |
| 6905 | TBCE | P24T-E | Human | Esophagus | ESCC | 2.37e-17 | 1.79e-01 | 0.1287 |
| 6905 | TBCE | P26T-E | Human | Esophagus | ESCC | 1.12e-24 | 2.73e-01 | 0.1276 |
| 6905 | TBCE | P27T-E | Human | Esophagus | ESCC | 2.73e-16 | 2.42e-01 | 0.1055 |
| 6905 | TBCE | P28T-E | Human | Esophagus | ESCC | 2.24e-15 | 2.89e-01 | 0.1149 |
| 6905 | TBCE | P30T-E | Human | Esophagus | ESCC | 3.64e-12 | 4.20e-01 | 0.137 |
| Page: 1 2 3 4 |
| Tissue | Expression Dynamics | Abbreviation |
| Esophagus | 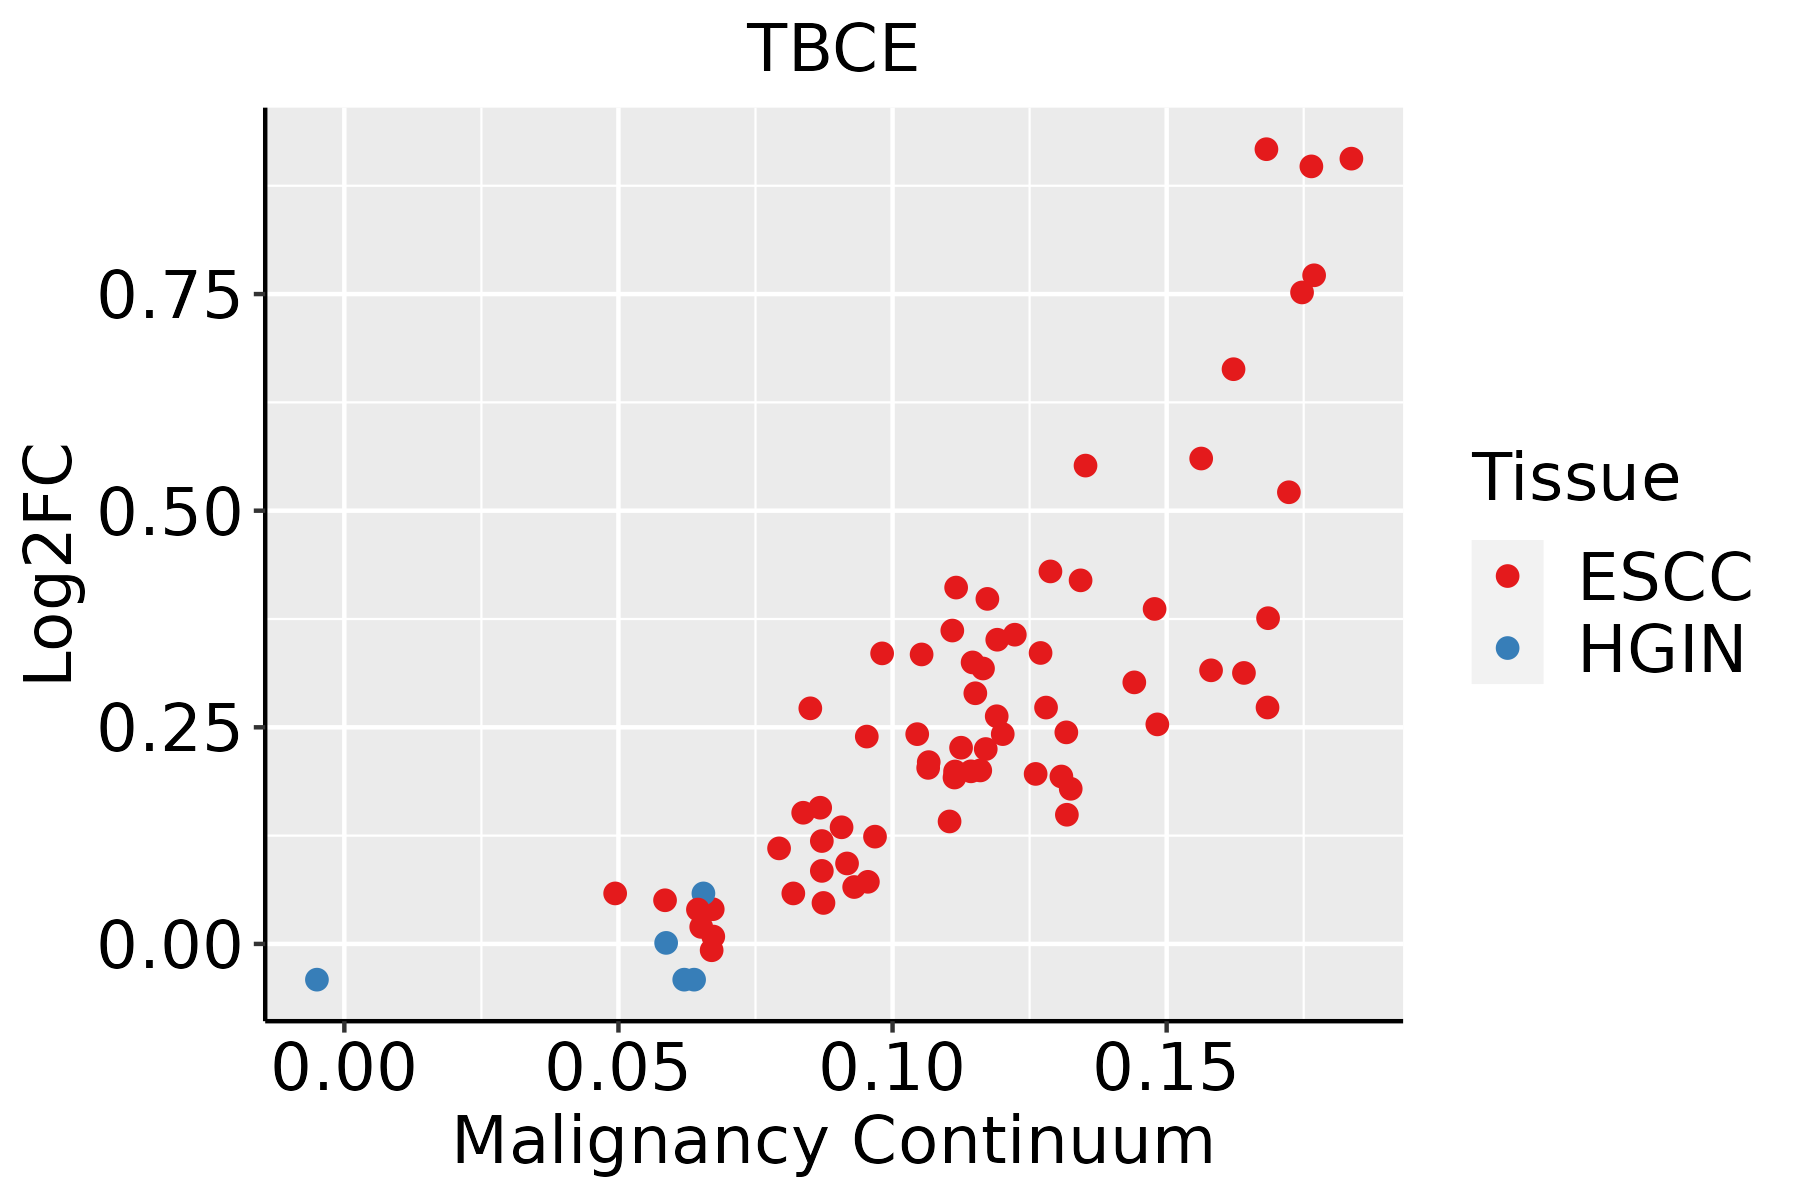 | ESCC: Esophageal squamous cell carcinoma |
| HGIN: High-grade intraepithelial neoplasias | ||
| LGIN: Low-grade intraepithelial neoplasias | ||
| Liver | 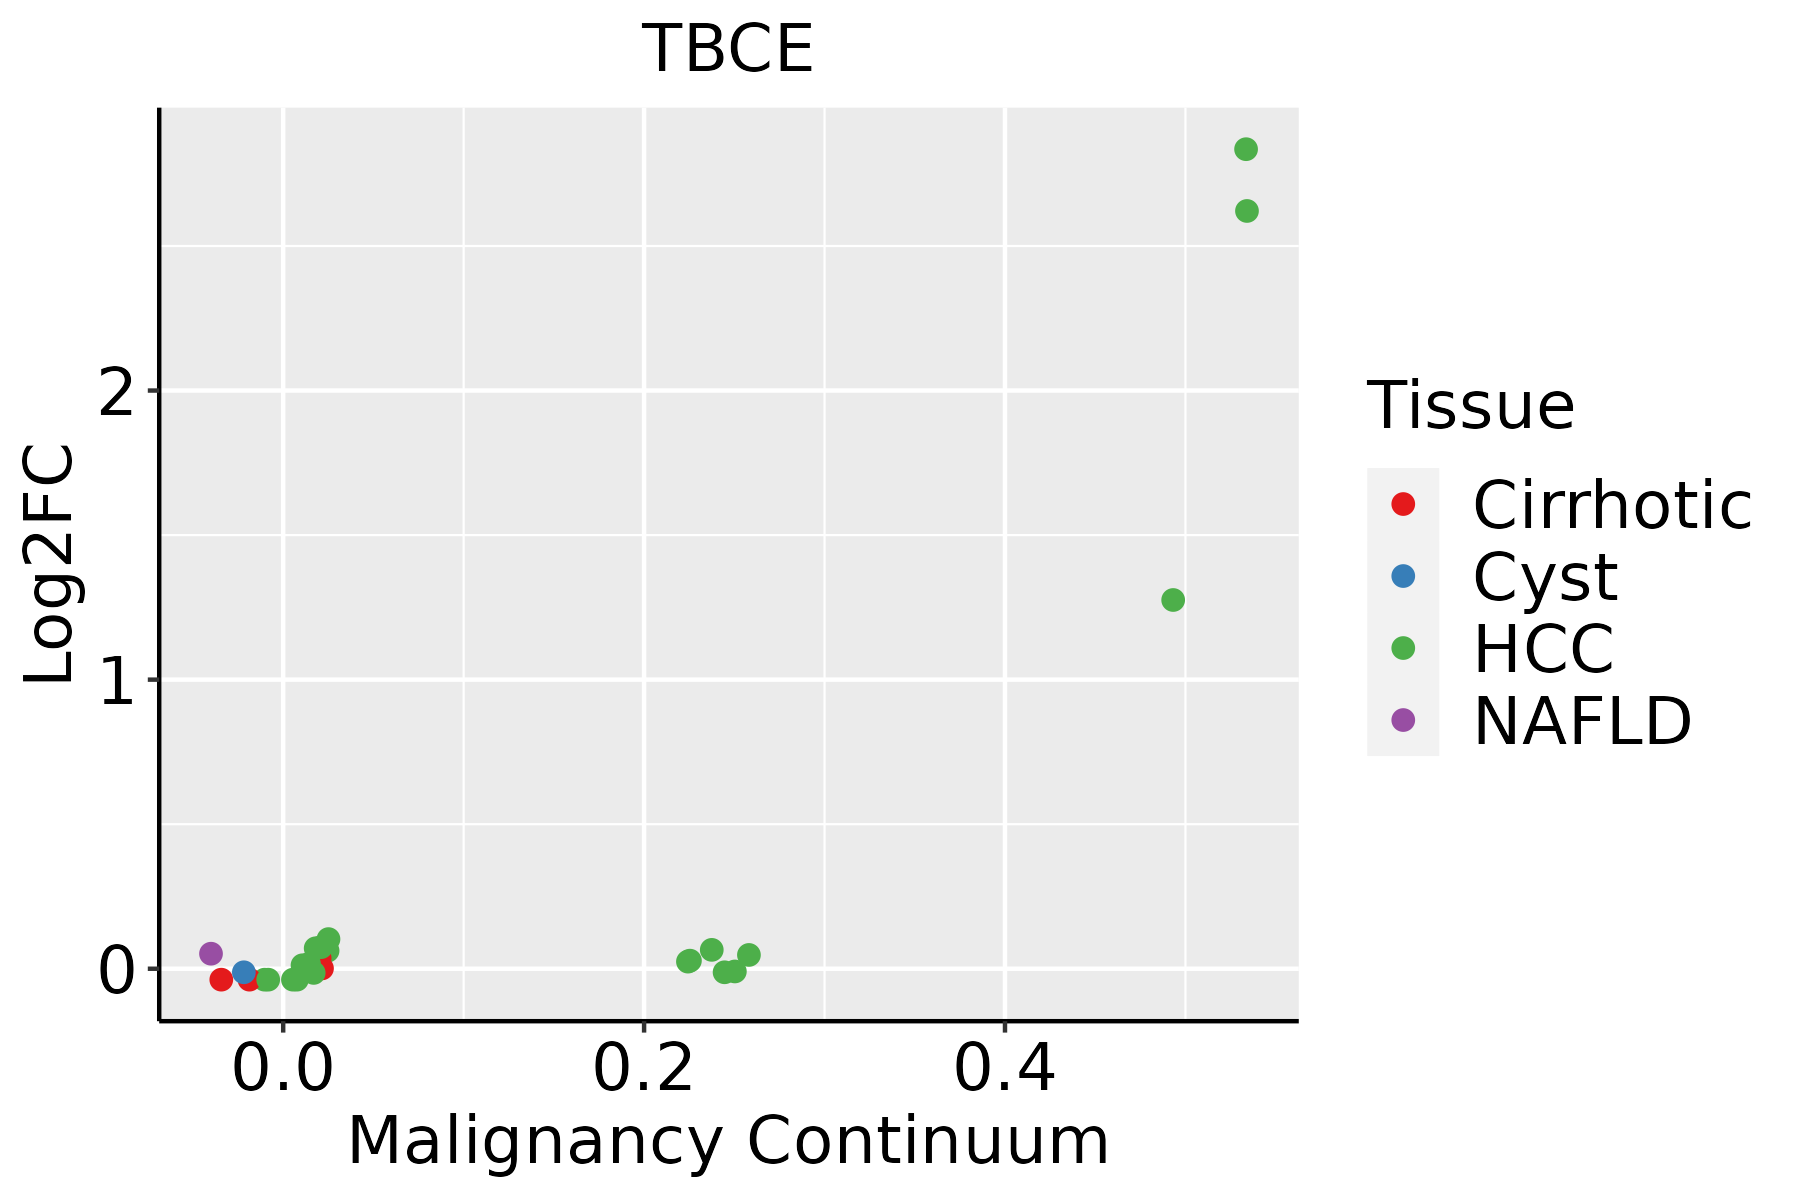 | HCC: Hepatocellular carcinoma |
| NAFLD: Non-alcoholic fatty liver disease | ||
| Oral Cavity | 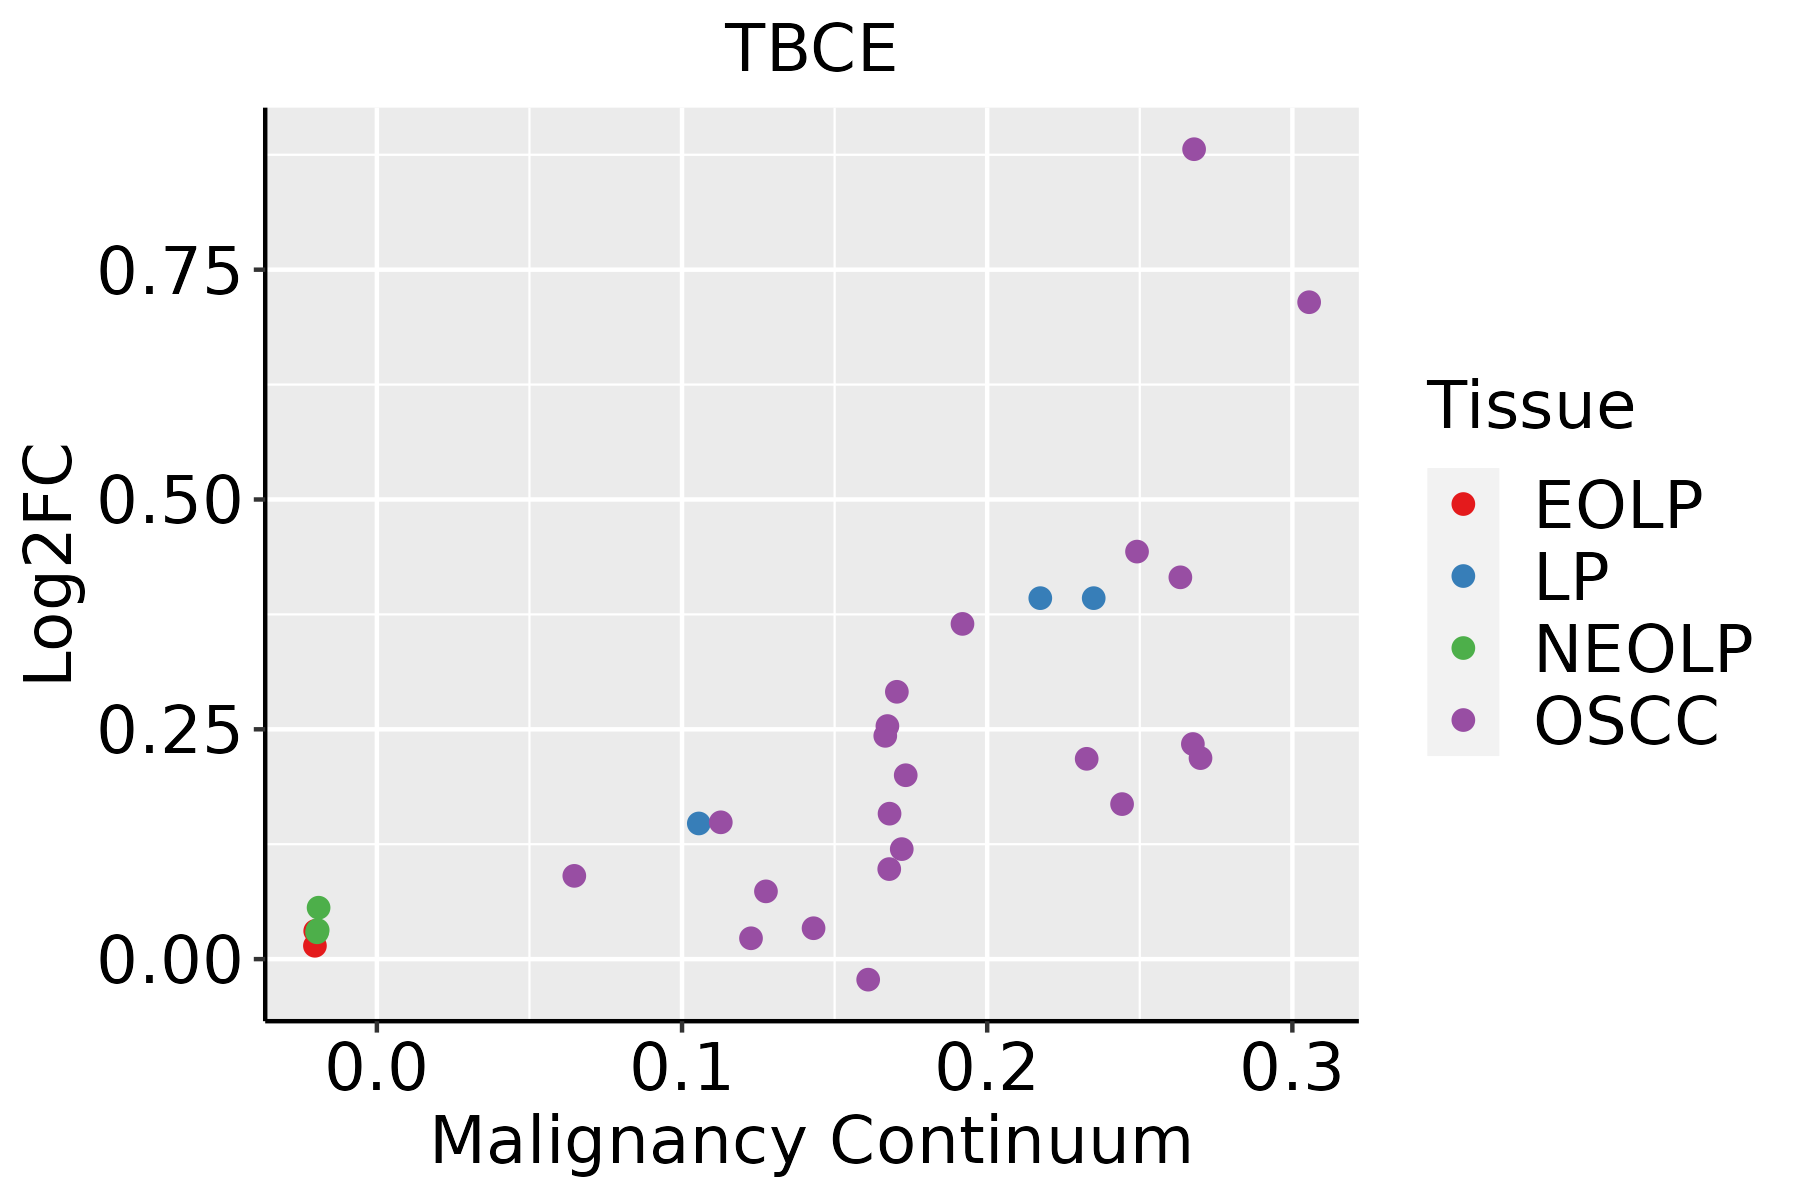 | EOLP: Erosive Oral lichen planus |
| LP: leukoplakia | ||
| NEOLP: Non-erosive oral lichen planus | ||
| OSCC: Oral squamous cell carcinoma |
| ∗log2FC in expression of this searched gene in stem-like cells from each diseased tissue sample relative to stem-like cells in normal samples in each tissue plotted against the malignancy continuum. Samples are colored based on if they are from different disease stage. |
Top |
Malignant transformation related pathway analysis |
| Find out the enriched GO biological processes and KEGG pathways involved in transition from healthy to precancer to cancer |
| Tissue | Disease Stage | Enriched GO biological Processes |
| Colorectum | AD |  |
| Colorectum | SER |  |
| Colorectum | MSS |  |
| Colorectum | MSI-H |  |
| Colorectum | FAP |  |
| ∗Top 15 enriched GO BP terms are showed in the bar plot of each disease state in each tissue. Each row represents a significant GO biological process which is colored according to the -log10(p.adjust). |
| Page: 1 2 3 4 5 6 7 8 9 |
| GO ID | Tissue | Disease Stage | Description | Gene Ratio | Bg Ratio | pvalue | p.adjust | Count |
| GO:0006457110 | Esophagus | ESCC | protein folding | 163/8552 | 212/18723 | 1.13e-20 | 1.74e-18 | 163 |
| GO:190285015 | Esophagus | ESCC | microtubule cytoskeleton organization involved in mitosis | 116/8552 | 147/18723 | 1.25e-16 | 9.91e-15 | 116 |
| GO:000705214 | Esophagus | ESCC | mitotic spindle organization | 97/8552 | 120/18723 | 2.17e-15 | 1.33e-13 | 97 |
| GO:000705114 | Esophagus | ESCC | spindle organization | 134/8552 | 184/18723 | 5.70e-14 | 2.87e-12 | 134 |
| GO:000645712 | Liver | HCC | protein folding | 160/7958 | 212/18723 | 1.07e-22 | 1.88e-20 | 160 |
| GO:000705111 | Liver | HCC | spindle organization | 116/7958 | 184/18723 | 1.40e-08 | 3.40e-07 | 116 |
| GO:000705211 | Liver | HCC | mitotic spindle organization | 80/7958 | 120/18723 | 7.43e-08 | 1.50e-06 | 80 |
| GO:190285011 | Liver | HCC | microtubule cytoskeleton organization involved in mitosis | 93/7958 | 147/18723 | 2.91e-07 | 5.09e-06 | 93 |
| GO:000645718 | Oral cavity | OSCC | protein folding | 154/7305 | 212/18723 | 1.89e-23 | 4.60e-21 | 154 |
| GO:00070526 | Oral cavity | OSCC | mitotic spindle organization | 85/7305 | 120/18723 | 1.44e-12 | 6.23e-11 | 85 |
| GO:19028506 | Oral cavity | OSCC | microtubule cytoskeleton organization involved in mitosis | 99/7305 | 147/18723 | 2.94e-12 | 1.18e-10 | 99 |
| GO:00070517 | Oral cavity | OSCC | spindle organization | 117/7305 | 184/18723 | 1.16e-11 | 4.17e-10 | 117 |
| Page: 1 |
| Pathway ID | Tissue | Disease Stage | Description | Gene Ratio | Bg Ratio | pvalue | p.adjust | qvalue | Count |
| Page: 1 |
Top |
Cell-cell communication analysis |
| Identification of potential cell-cell interactions between two cell types and their ligand-receptor pairs for different disease states |
| Ligand | Receptor | LRpair | Pathway | Tissue | Disease Stage |
| Page: 1 |
Top |
Single-cell gene regulatory network inference analysis |
| Find out the significant the regulons (TFs) and the target genes of each regulon across cell types for different disease states |
| TF | Cell Type | Tissue | Disease Stage | Target Gene | RSS | Regulon Activity |
| ∗The dot plots of a searched regulon are shown for all cell subpopulations in each disease state of each tissue based on the regulon specific score inferred using pySCENIC and by calculating the average expression. |
| Page: 1 |
Top |
Somatic mutation of malignant transformation related genes |
| Annotation of somatic variants for genes involved in malignant transformation |
| Hugo Symbol | Variant Class | Variant Classification | dbSNP RS | HGVSc | HGVSp | HGVSp Short | SWISSPROT | BIOTYPE | SIFT | PolyPhen | Tumor Sample Barcode | Tissue | Histology | Sex | Age | Stage | Therapy Types | Drugs | Outcome |
| TBCE | SNV | Missense_Mutation | novel | c.1039N>A | p.Asp347Asn | p.D347N | Q15813 | protein_coding | deleterious(0) | possibly_damaging(0.814) | TCGA-3C-AALI-01 | Breast | breast invasive carcinoma | Female | <65 | I/II | Unspecific | Poly E | Complete Response |
| TBCE | SNV | Missense_Mutation | c.421N>C | p.Cys141Arg | p.C141R | Q15813 | protein_coding | tolerated(0.38) | benign(0.013) | TCGA-A2-A0YJ-01 | Breast | breast invasive carcinoma | Female | <65 | III/IV | Chemotherapy | cytoxan | PD | |
| TBCE | SNV | Missense_Mutation | c.329N>A | p.Pro110His | p.P110H | Q15813 | protein_coding | deleterious(0.04) | benign(0.428) | TCGA-A8-A09Z-01 | Breast | breast invasive carcinoma | Female | >=65 | I/II | Unknown | Unknown | SD | |
| TBCE | SNV | Missense_Mutation | novel | c.327A>C | p.Lys109Asn | p.K109N | Q15813 | protein_coding | deleterious(0.01) | possibly_damaging(0.572) | TCGA-AC-A3QQ-01 | Breast | breast invasive carcinoma | Female | <65 | I/II | Unknown | Unknown | SD |
| TBCE | SNV | Missense_Mutation | c.586N>A | p.Gly196Ser | p.G196S | Q15813 | protein_coding | tolerated(0.43) | benign(0.003) | TCGA-AN-A0FZ-01 | Breast | breast invasive carcinoma | Female | <65 | III/IV | Unknown | Unknown | SD | |
| TBCE | SNV | Missense_Mutation | rs370534306 | c.886N>A | p.Glu296Lys | p.E296K | Q15813 | protein_coding | tolerated(0.06) | benign(0.216) | TCGA-BH-A0BR-01 | Breast | breast invasive carcinoma | Female | <65 | I/II | Unknown | Unknown | SD |
| TBCE | SNV | Missense_Mutation | c.1247T>C | p.Leu416Pro | p.L416P | Q15813 | protein_coding | deleterious(0) | probably_damaging(0.994) | TCGA-BH-A18G-01 | Breast | breast invasive carcinoma | Female | >=65 | I/II | Unknown | Unknown | SD | |
| TBCE | insertion | Frame_Shift_Ins | novel | c.82_83insGC | p.Val28GlyfsTer11 | p.V28Gfs*11 | Q15813 | protein_coding | TCGA-A2-A0D2-01 | Breast | breast invasive carcinoma | Female | <65 | I/II | Chemotherapy | adriamycin | SD | ||
| TBCE | insertion | In_Frame_Ins | novel | c.83_84insCATGCCTGTAATCCCAGCACTTTGGGAGGCAGAGGAGGG | p.Val28_Val29insMetProValIleProAlaLeuTrpGluAlaGluGluGly | p.V28_V29insMPVIPALWEAEEG | Q15813 | protein_coding | TCGA-A2-A0D2-01 | Breast | breast invasive carcinoma | Female | <65 | I/II | Chemotherapy | adriamycin | SD | ||
| TBCE | insertion | Nonsense_Mutation | novel | c.1102_1103insTGTAGGATATGCTATAAGGATTAAATAATGTATTTTTC | p.Asn368MetfsTer2 | p.N368Mfs*2 | Q15813 | protein_coding | TCGA-A8-A0A4-01 | Breast | breast invasive carcinoma | Female | >=65 | I/II | Hormone Therapy | tamoxiphen | CR |
| Page: 1 2 3 4 5 6 7 |
Top |
Related drugs of malignant transformation related genes |
| Identification of chemicals and drugs interact with genes involved in malignant transfromation |
| (DGIdb 4.0) |
| Entrez ID | Symbol | Category | Interaction Types | Drug Claim Name | Drug Name | PMIDs |
| Page: 1 |

Copyright 2023-Present -The University of Texas Health Science Center at Houston |