Schematic overview of the cellular and molecular mechanisms involved in the cancer progression, including the proposed cellular and molecular mechanisms in cancer cells trajectory. AT1: alveolar type 1 cells; AT2: alveolar type 2 cells; AAH: atypical adenomatous hyperplasia; AIS: adenocarcinoma in situ; MIA: minimally invasive adenocarcinoma; IA: invasive adenocarcinoma; EMT: epithelial-mesenchymal transition

Home

Download

Statistics

Help

Contact

Center for Computational Systems Medicine
leaf

Gene summary

leaf

Malignant transformation analysis

leaf

Malignant transformation related pathway analysis

leaf

Cell-cell communication analysis

leaf

Single-cell gene regulatory network inference analysis

leaf

Somatic mutation of malignant transformation related genes

leaf

Related drugs of malignant transformation related genes

Gene: TBCD

Gene summary for TBCD

check button Gene summary.

Gene informationSpeciesHuman
Gene symbol

TBCD

Gene ID

6904

Gene nametubulin folding cofactor D
Gene AliasPEBAT
Cytomap17q25.3
Gene Typeprotein-coding
GO ID

GO:0000226

UniProtAcc

Q9BTW9


Top

Malignant transformation analysis

check button Identification of the aberrant gene expression in precancerous and cancerous lesions by comparing the gene expression of stem-like cells in diseased tissues with normal stem cells
check button Malignant transformation involving gene list.
Entrez IDSymbolReplicatesSpeciesOrganTissueAdj P-valueLog2FCMalignancy
6904TBCDLZE7THumanEsophagusESCC4.03e-041.84e-010.0667
6904TBCDLZE24THumanEsophagusESCC1.09e-052.58e-010.0596
6904TBCDP1T-EHumanEsophagusESCC1.12e-032.12e-010.0875
6904TBCDP2T-EHumanEsophagusESCC3.49e-112.32e-010.1177
6904TBCDP4T-EHumanEsophagusESCC1.74e-101.51e-010.1323
6904TBCDP5T-EHumanEsophagusESCC1.27e-081.00e-010.1327
6904TBCDP8T-EHumanEsophagusESCC4.25e-101.48e-010.0889
6904TBCDP9T-EHumanEsophagusESCC4.16e-081.04e-010.1131
6904TBCDP10T-EHumanEsophagusESCC1.53e-103.74e-010.116
6904TBCDP11T-EHumanEsophagusESCC2.62e-104.61e-010.1426
6904TBCDP12T-EHumanEsophagusESCC2.13e-174.02e-010.1122
6904TBCDP15T-EHumanEsophagusESCC4.07e-112.55e-010.1149
6904TBCDP16T-EHumanEsophagusESCC1.33e-092.06e-010.1153
6904TBCDP21T-EHumanEsophagusESCC3.96e-152.43e-010.1617
6904TBCDP22T-EHumanEsophagusESCC2.87e-161.92e-010.1236
6904TBCDP23T-EHumanEsophagusESCC6.68e-057.60e-020.108
6904TBCDP24T-EHumanEsophagusESCC2.05e-081.86e-010.1287
6904TBCDP26T-EHumanEsophagusESCC4.38e-071.09e-010.1276
6904TBCDP27T-EHumanEsophagusESCC4.44e-082.21e-010.1055
6904TBCDP28T-EHumanEsophagusESCC1.91e-283.97e-010.1149
Page: 1 2 3 4 5 

check button Transcriptomic changes along malignancy continuum.
TissueExpression DynamicsAbbreviation
EsophagusThe image shows the transcriptomic changes along malignancy continuum.log2FC in expression of this searched gene in stem-like cells from each diseased tissue sample relative to stem-like cells in normal samples in each tissue plotted against the malignancy continuum. Samples are colored based on if they are from different disease stage.
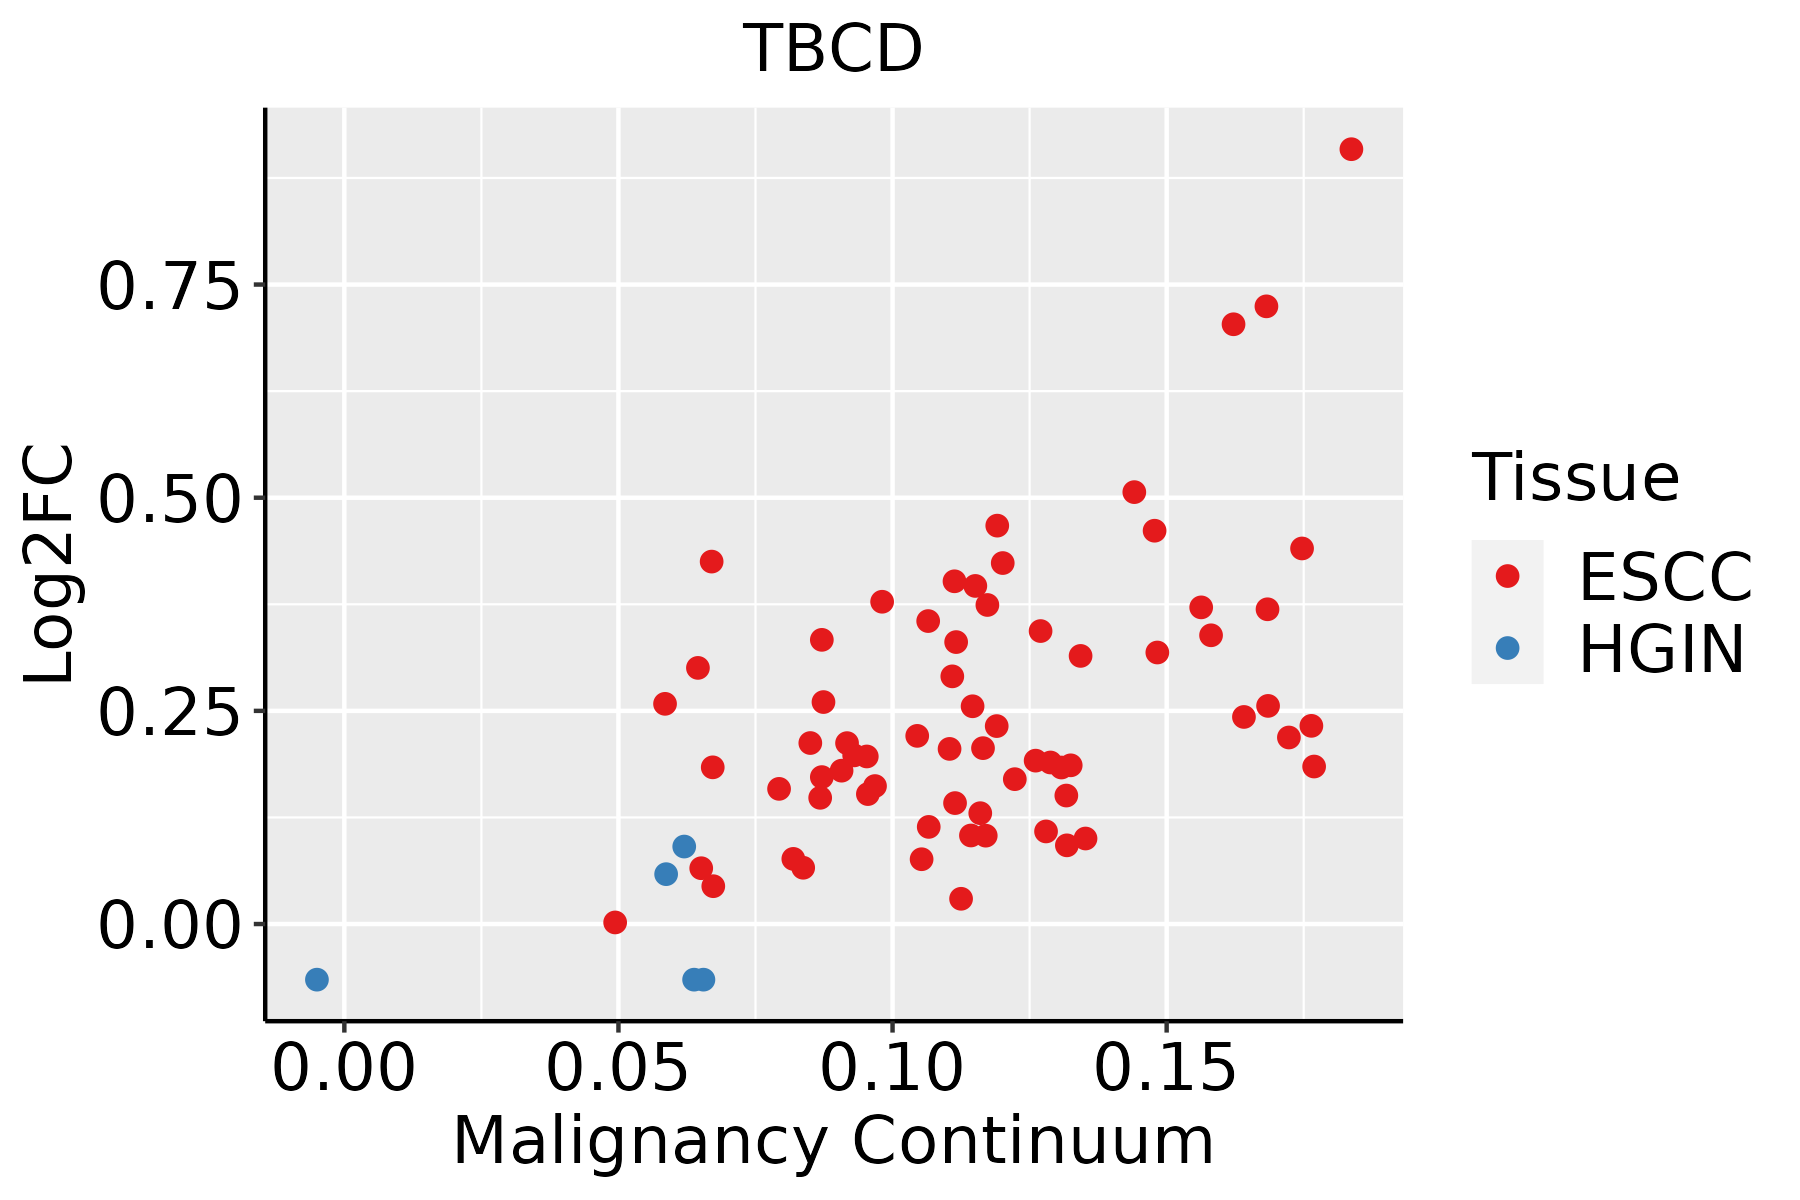
ESCC: Esophageal squamous cell carcinoma
HGIN: High-grade intraepithelial neoplasias
LGIN: Low-grade intraepithelial neoplasias
LiverThe image shows the transcriptomic changes along malignancy continuum.log2FC in expression of this searched gene in stem-like cells from each diseased tissue sample relative to stem-like cells in normal samples in each tissue plotted against the malignancy continuum. Samples are colored based on if they are from different disease stage.HCC: Hepatocellular carcinoma
NAFLD: Non-alcoholic fatty liver disease
Oral CavityThe image shows the transcriptomic changes along malignancy continuum.log2FC in expression of this searched gene in stem-like cells from each diseased tissue sample relative to stem-like cells in normal samples in each tissue plotted against the malignancy continuum. Samples are colored based on if they are from different disease stage.
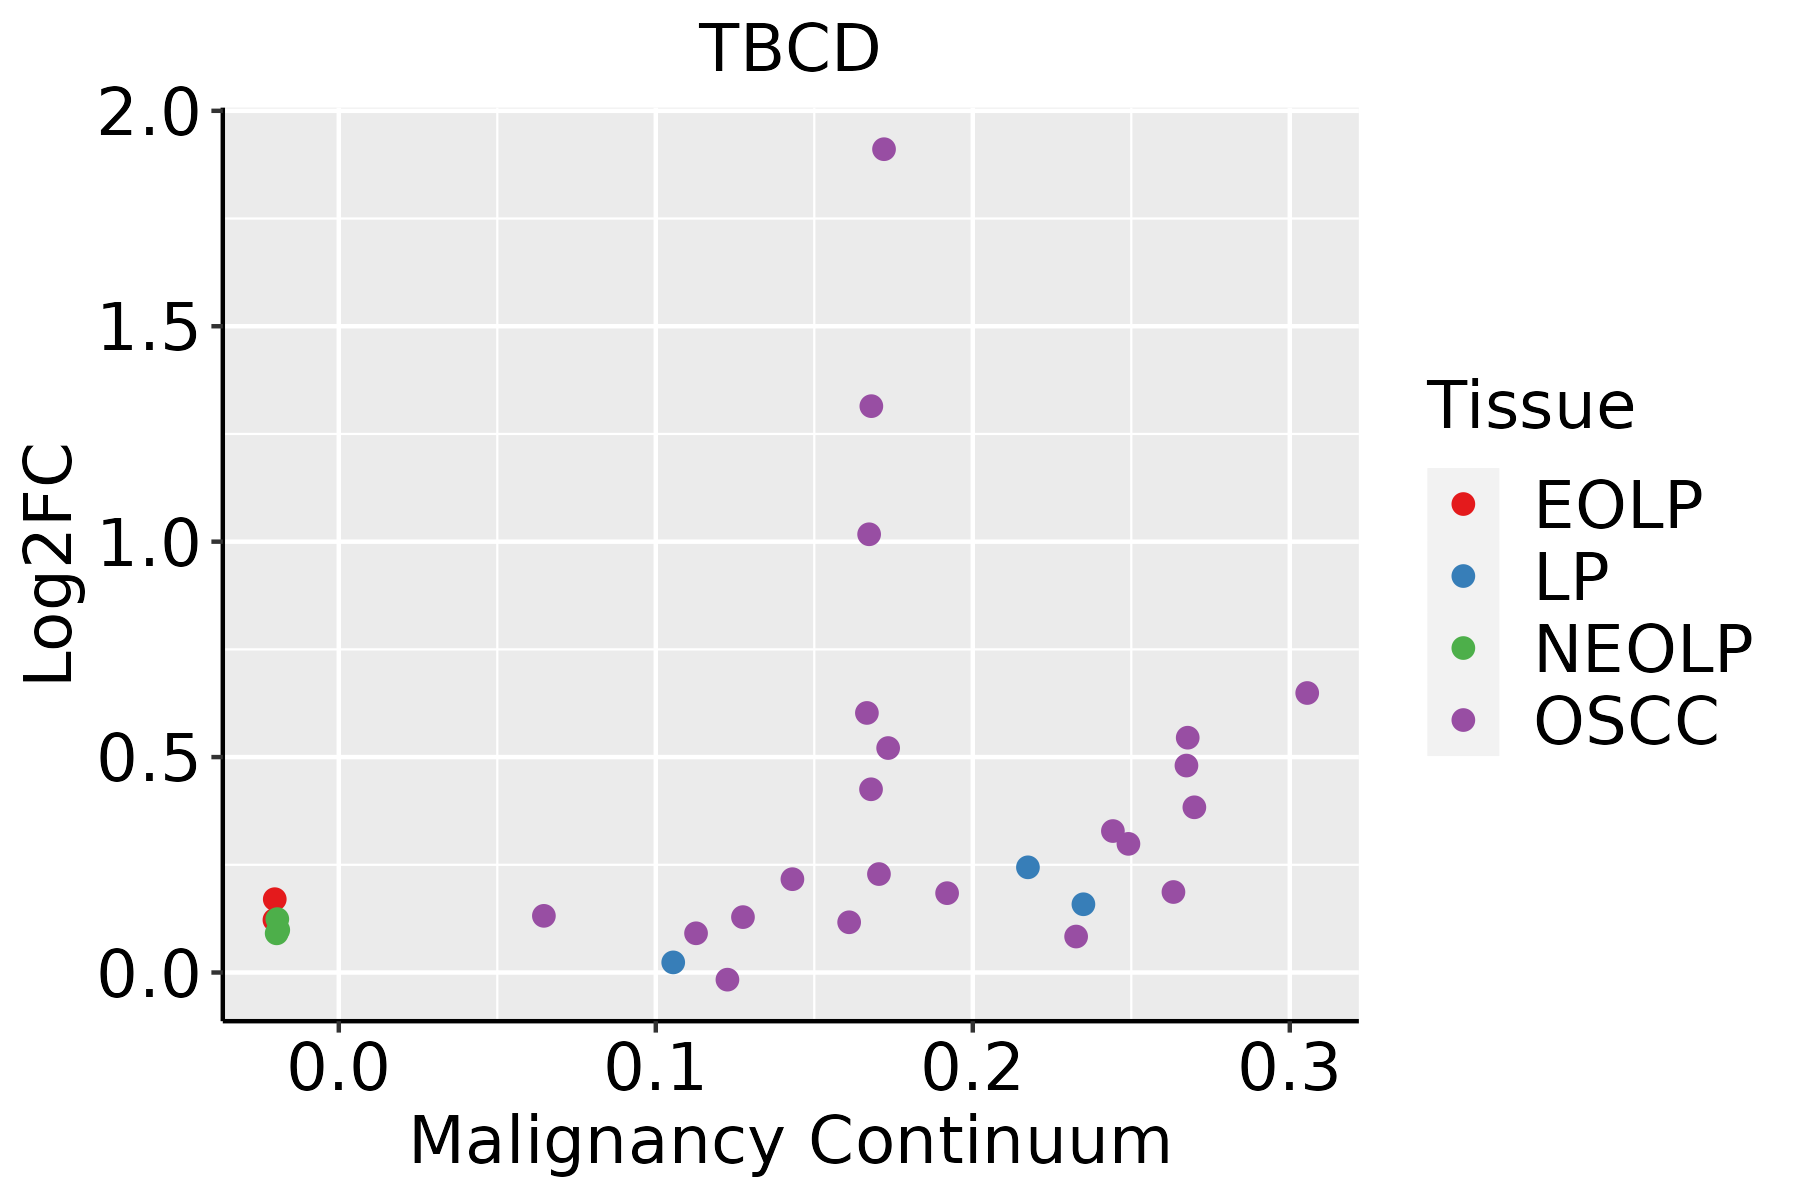
EOLP: Erosive Oral lichen planus
LP: leukoplakia
NEOLP: Non-erosive oral lichen planus
OSCC: Oral squamous cell carcinoma
ThyroidThe image shows the transcriptomic changes along malignancy continuum.log2FC in expression of this searched gene in stem-like cells from each diseased tissue sample relative to stem-like cells in normal samples in each tissue plotted against the malignancy continuum. Samples are colored based on if they are from different disease stage.ATC: Anaplastic thyroid cancer
HT: Hashimoto's thyroiditis
PTC: Papillary thyroid cancer
∗log2FC in expression of this searched gene in stem-like cells from each diseased tissue sample relative to stem-like cells in normal samples in each tissue plotted against the malignancy continuum. Samples are colored based on if they are from different disease stage.

Top

Malignant transformation related pathway analysis

check buttonFind out the enriched GO biological processes and KEGG pathways involved in transition from healthy to precancer to cancer
check button Figure of enriched GO biological processes.
TissueDisease StageEnriched GO biological Processes
ColorectumADGO analysis - Figure of enriched GO biological processes: Top 15 enriched GO BP terms are showed in the bar plot of each disease state in each tissue. Each row represents a significant GO biological process which is colored according to the -log10(p.adjust).
ColorectumSERGO analysis - Figure of enriched GO biological processes: Top 15 enriched GO BP terms are showed in the bar plot of each disease state in each tissue. Each row represents a significant GO biological process which is colored according to the -log10(p.adjust).
ColorectumMSSGO analysis - Figure of enriched GO biological processes: Top 15 enriched GO BP terms are showed in the bar plot of each disease state in each tissue. Each row represents a significant GO biological process which is colored according to the -log10(p.adjust).
ColorectumMSI-HGO analysis - Figure of enriched GO biological processes: Top 15 enriched GO BP terms are showed in the bar plot of each disease state in each tissue. Each row represents a significant GO biological process which is colored according to the -log10(p.adjust).
ColorectumFAPGO analysis - Figure of enriched GO biological processes: Top 15 enriched GO BP terms are showed in the bar plot of each disease state in each tissue. Each row represents a significant GO biological process which is colored according to the -log10(p.adjust).
∗Top 15 enriched GO BP terms are showed in the bar plot of each disease state in each tissue. Each row represents a significant GO biological process which is colored according to the -log10(p.adjust).
Page: 1 2 3 4 5 6 7 8 9 

check button Enriched GO biological processes.
GO IDTissueDisease StageDescriptionGene RatioBg Ratiopvaluep.adjustCount
GO:0006457110EsophagusESCCprotein folding163/8552212/187231.13e-201.74e-18163
GO:0043254111EsophagusESCCregulation of protein-containing complex assembly278/8552428/187233.81e-162.77e-14278
GO:1902903111EsophagusESCCregulation of supramolecular fiber organization237/8552383/187239.06e-112.75e-09237
GO:0010639110EsophagusESCCnegative regulation of organelle organization215/8552348/187238.20e-102.01e-08215
GO:003158919EsophagusESCCcell-substrate adhesion221/8552363/187233.06e-096.62e-08221
GO:001081020EsophagusESCCregulation of cell-substrate adhesion144/8552221/187233.55e-097.45e-08144
GO:0051258111EsophagusESCCprotein polymerization183/8552297/187231.94e-083.75e-07183
GO:00705078EsophagusESCCregulation of microtubule cytoskeleton organization99/8552148/187231.43e-072.29e-0699
GO:0032271111EsophagusESCCregulation of protein polymerization143/8552233/187239.21e-071.17e-05143
GO:00311094EsophagusESCCmicrotubule polymerization or depolymerization77/8552122/187237.60e-055.68e-0477
GO:00467856EsophagusESCCmicrotubule polymerization55/855283/187231.21e-048.31e-0455
GO:0031333110EsophagusESCCnegative regulation of protein-containing complex assembly86/8552141/187231.74e-041.14e-0386
GO:00311104EsophagusESCCregulation of microtubule polymerization or depolymerization57/855288/187232.32e-041.44e-0357
GO:003432918EsophagusESCCcell junction assembly227/8552420/187233.06e-041.83e-03227
GO:004521620EsophagusESCCcell-cell junction organization114/8552200/187238.04e-044.16e-03114
GO:00328864EsophagusESCCregulation of microtubule-based process134/8552240/187239.44e-044.80e-03134
GO:00311138EsophagusESCCregulation of microtubule polymerization36/855255/187232.43e-031.06e-0236
GO:004329718EsophagusESCCapical junction assembly48/855278/187233.45e-031.41e-0248
GO:000645712LiverHCCprotein folding160/7958212/187231.07e-221.88e-20160
GO:004325422LiverHCCregulation of protein-containing complex assembly264/7958428/187235.47e-164.39e-14264
Page: 1 2 3 4 5 6 

check button Enriched KEGG pathways.
Pathway IDTissueDisease StageDescriptionGene RatioBg Ratiopvaluep.adjustqvalueCount
Page: 1 

Top

Cell-cell communication analysis

check buttonIdentification of potential cell-cell interactions between two cell types and their ligand-receptor pairs for different disease states
LigandReceptorLRpairPathwayTissueDisease Stage
Page: 1 

Top

Single-cell gene regulatory network inference analysis

check buttonFind out the significant the regulons (TFs) and the target genes of each regulon across cell types for different disease states
TFCell TypeTissueDisease StageTarget GeneRSSRegulon Activity
∗The dot plots of a searched regulon are shown for all cell subpopulations in each disease state of each tissue based on the regulon specific score inferred using pySCENIC and by calculating the average expression.
Page: 1 

Top

Somatic mutation of malignant transformation related genes

check buttonAnnotation of somatic variants for genes involved in malignant transformation
Hugo SymbolVariant ClassVariant ClassificationdbSNP RSHGVScHGVSpHGVSp ShortSWISSPROTBIOTYPESIFTPolyPhenTumor Sample BarcodeTissueHistologySexAgeStageTherapy TypesDrugsOutcome
TBCDSNVMissense_Mutationc.1192N>Ap.Asp398Asnp.D398NQ9BTW9protein_codingdeleterious(0)possibly_damaging(0.632)TCGA-A2-A04W-01Breastbreast invasive carcinomaFemale<65I/IIChemotherapycytoxanSD
TBCDSNVMissense_Mutationc.1139C>Tp.Ala380Valp.A380VQ9BTW9protein_codingdeleterious(0)probably_damaging(0.958)TCGA-A2-A0D2-01Breastbreast invasive carcinomaFemale<65I/IIChemotherapyadriamycinSD
TBCDSNVMissense_Mutationnovelc.2086N>Ap.Gly696Serp.G696SQ9BTW9protein_codingtolerated(0.23)benign(0.143)TCGA-BH-A0DH-01Breastbreast invasive carcinomaFemale<65I/IIChemotherapycyclophosphamideSD
TBCDSNVMissense_Mutationc.3277N>Ap.Ala1093Thrp.A1093TQ9BTW9protein_codingtolerated(0.58)benign(0.124)TCGA-BH-A0HA-01Breastbreast invasive carcinomaFemale<65I/IIUnknownUnknownSD
TBCDSNVMissense_Mutationc.214N>Gp.His72Aspp.H72DQ9BTW9protein_codingdeleterious(0)probably_damaging(0.999)TCGA-C8-A26Y-01Breastbreast invasive carcinomaFemale>=65I/IIUnknownUnknownSD
TBCDSNVMissense_Mutationc.619N>Tp.Ala207Serp.A207SQ9BTW9protein_codingdeleterious(0.02)benign(0.197)TCGA-E9-A1RC-01Breastbreast invasive carcinomaFemale<65III/IVHormone TherapytamoxiphenSD
TBCDSNVMissense_Mutationnovelc.2720N>Ap.Ala907Aspp.A907DQ9BTW9protein_codingdeleterious(0)probably_damaging(0.947)TCGA-OL-A6VR-01Breastbreast invasive carcinomaFemale<65I/IIUnknownUnknownSD
TBCDdeletionFrame_Shift_Delnovelc.3379delAp.Thr1127ProfsTer26p.T1127Pfs*26Q9BTW9protein_codingTCGA-EW-A2FV-01Breastbreast invasive carcinomaFemale<65III/IVChemotherapydocetaxelSD
TBCDSNVMissense_Mutationnovelc.277N>Gp.Thr93Alap.T93AQ9BTW9protein_codingtolerated(0.83)benign(0)TCGA-2W-A8YY-01Cervixcervical & endocervical cancerFemale<65I/IIChemotherapycisplatinCR
TBCDSNVMissense_Mutationrs746252497c.3169N>Ap.Asp1057Asnp.D1057NQ9BTW9protein_codingdeleterious(0.04)probably_damaging(0.921)TCGA-2W-A8YY-01Cervixcervical & endocervical cancerFemale<65I/IIChemotherapycisplatinCR
Page: 1 2 3 4 5 6 7 8 9 10 11 12 

Top

Related drugs of malignant transformation related genes

check buttonIdentification of chemicals and drugs interact with genes involved in malignant transfromation
(DGIdb 4.0)
Entrez IDSymbolCategoryInteraction TypesDrug Claim NameDrug NamePMIDs
Page: 1