
|
|||||
|
 | |
| |
| |
| |
| |
| |
|
Gene: TBCCD1 |
Gene summary for TBCCD1 |
| Gene information | Species | Human | Gene symbol | TBCCD1 | Gene ID | 55171 |
| Gene name | TBCC domain containing 1 | |
| Gene Alias | TBCCD1 | |
| Cytomap | 3q27.3 | |
| Gene Type | protein-coding | GO ID | GO:0000902 | UniProtAcc | Q9NVR7 |
Top |
Malignant transformation analysis |
| Identification of the aberrant gene expression in precancerous and cancerous lesions by comparing the gene expression of stem-like cells in diseased tissues with normal stem cells |
| Entrez ID | Symbol | Replicates | Species | Organ | Tissue | Adj P-value | Log2FC | Malignancy |
| 55171 | TBCCD1 | LZE4T | Human | Esophagus | ESCC | 9.61e-10 | 4.27e-01 | 0.0811 |
| 55171 | TBCCD1 | LZE7T | Human | Esophagus | ESCC | 4.48e-05 | 3.04e-01 | 0.0667 |
| 55171 | TBCCD1 | LZE20T | Human | Esophagus | ESCC | 8.03e-06 | 1.95e-01 | 0.0662 |
| 55171 | TBCCD1 | LZE21D1 | Human | Esophagus | HGIN | 9.74e-03 | 4.42e-01 | 0.0632 |
| 55171 | TBCCD1 | LZE24T | Human | Esophagus | ESCC | 2.27e-08 | 2.85e-01 | 0.0596 |
| 55171 | TBCCD1 | LZE21T | Human | Esophagus | ESCC | 4.63e-06 | 4.36e-01 | 0.0655 |
| 55171 | TBCCD1 | LZE6T | Human | Esophagus | ESCC | 1.03e-03 | 1.75e-01 | 0.0845 |
| 55171 | TBCCD1 | P1T-E | Human | Esophagus | ESCC | 4.58e-02 | 1.90e-01 | 0.0875 |
| 55171 | TBCCD1 | P2T-E | Human | Esophagus | ESCC | 7.65e-33 | 5.77e-01 | 0.1177 |
| 55171 | TBCCD1 | P4T-E | Human | Esophagus | ESCC | 9.67e-23 | 5.15e-01 | 0.1323 |
| 55171 | TBCCD1 | P5T-E | Human | Esophagus | ESCC | 7.24e-19 | 3.18e-01 | 0.1327 |
| 55171 | TBCCD1 | P8T-E | Human | Esophagus | ESCC | 9.67e-18 | 3.40e-01 | 0.0889 |
| 55171 | TBCCD1 | P9T-E | Human | Esophagus | ESCC | 2.36e-08 | 1.62e-01 | 0.1131 |
| 55171 | TBCCD1 | P10T-E | Human | Esophagus | ESCC | 7.28e-26 | 4.44e-01 | 0.116 |
| 55171 | TBCCD1 | P11T-E | Human | Esophagus | ESCC | 1.47e-10 | 4.14e-01 | 0.1426 |
| 55171 | TBCCD1 | P12T-E | Human | Esophagus | ESCC | 6.62e-20 | 3.46e-01 | 0.1122 |
| 55171 | TBCCD1 | P15T-E | Human | Esophagus | ESCC | 2.05e-18 | 4.99e-01 | 0.1149 |
| 55171 | TBCCD1 | P16T-E | Human | Esophagus | ESCC | 4.14e-21 | 4.01e-01 | 0.1153 |
| 55171 | TBCCD1 | P19T-E | Human | Esophagus | ESCC | 4.28e-04 | 3.32e-01 | 0.1662 |
| 55171 | TBCCD1 | P20T-E | Human | Esophagus | ESCC | 3.60e-11 | 2.89e-01 | 0.1124 |
| Page: 1 2 3 4 |
| Tissue | Expression Dynamics | Abbreviation |
| Esophagus | 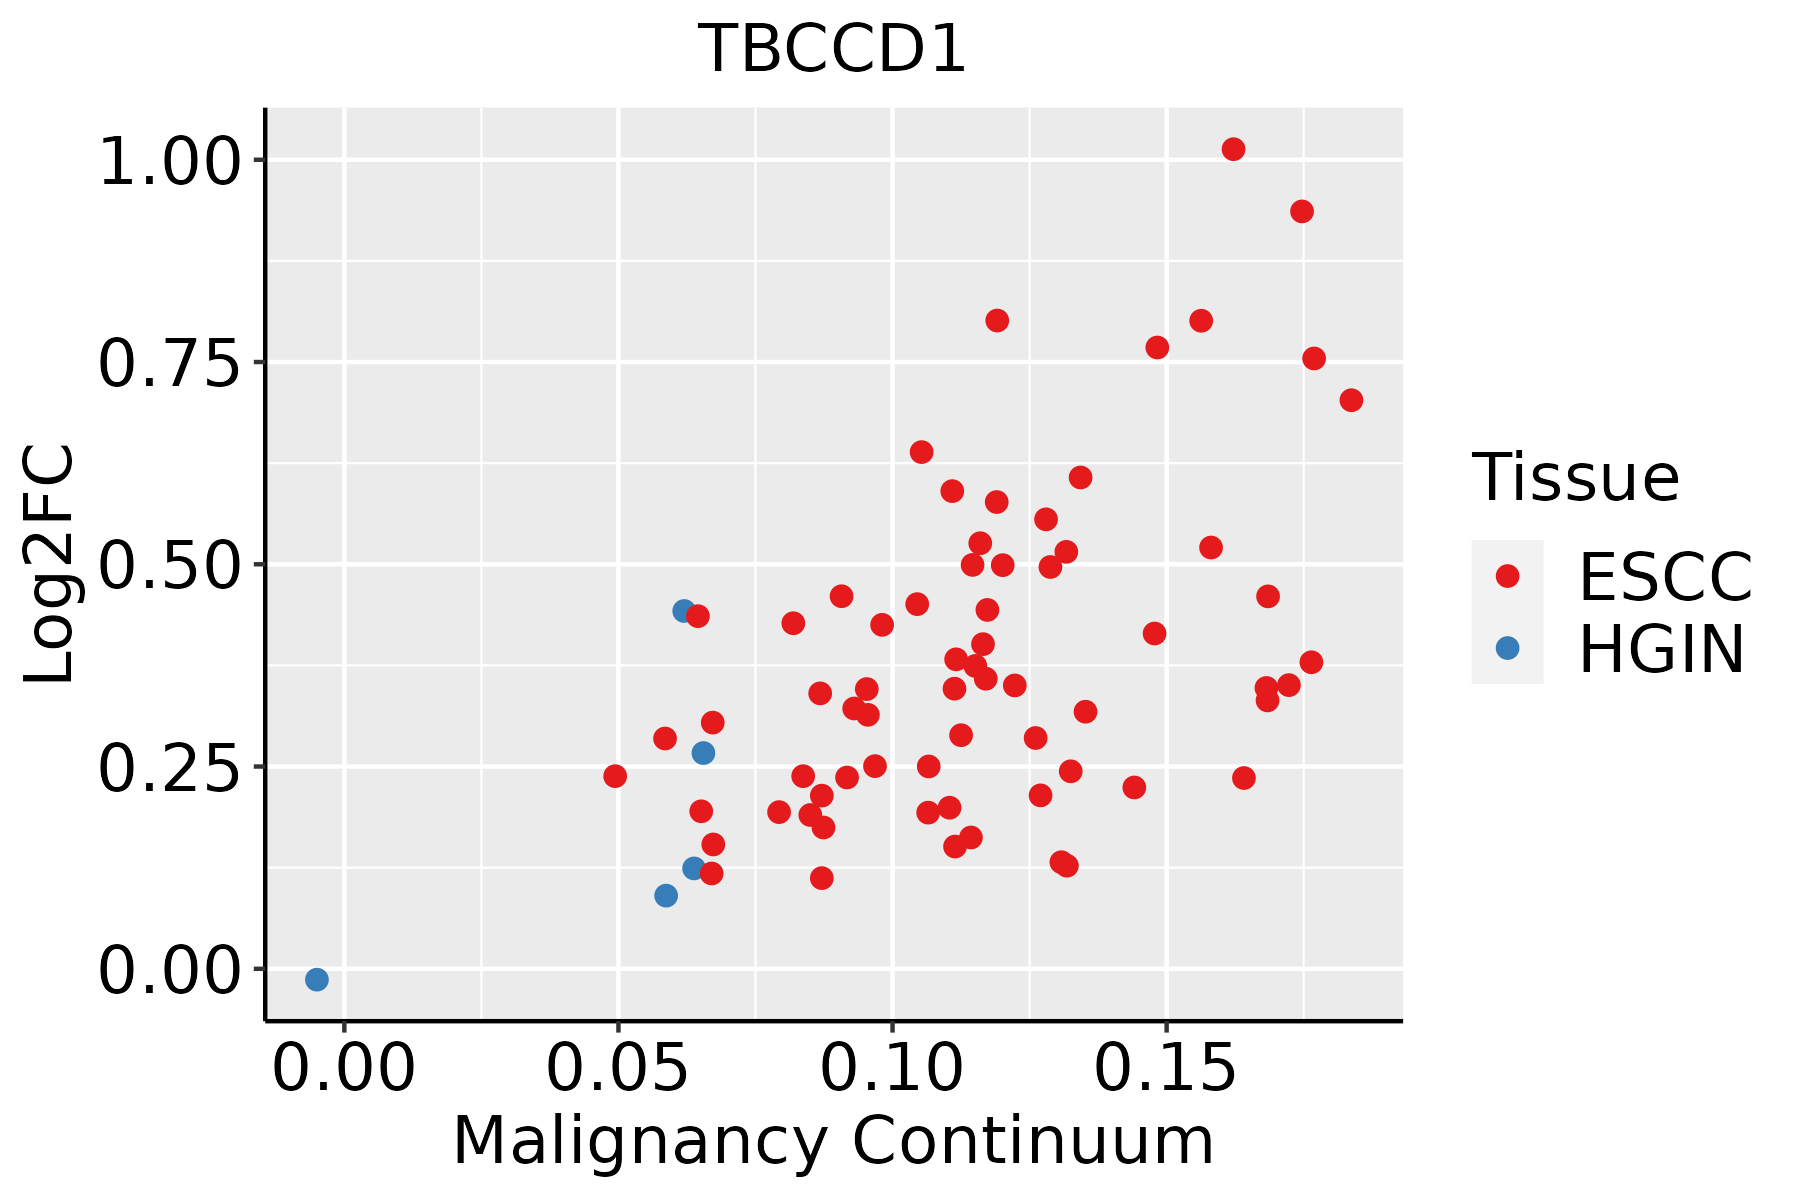 | ESCC: Esophageal squamous cell carcinoma |
| HGIN: High-grade intraepithelial neoplasias | ||
| LGIN: Low-grade intraepithelial neoplasias |
| ∗log2FC in expression of this searched gene in stem-like cells from each diseased tissue sample relative to stem-like cells in normal samples in each tissue plotted against the malignancy continuum. Samples are colored based on if they are from different disease stage. |
Top |
Malignant transformation related pathway analysis |
| Find out the enriched GO biological processes and KEGG pathways involved in transition from healthy to precancer to cancer |
| Tissue | Disease Stage | Enriched GO biological Processes |
| Colorectum | AD |  |
| Colorectum | SER |  |
| Colorectum | MSS |  |
| Colorectum | MSI-H |  |
| Colorectum | FAP |  |
| ∗Top 15 enriched GO BP terms are showed in the bar plot of each disease state in each tissue. Each row represents a significant GO biological process which is colored according to the -log10(p.adjust). |
| Page: 1 2 3 4 5 6 7 8 9 |
| GO ID | Tissue | Disease Stage | Description | Gene Ratio | Bg Ratio | pvalue | p.adjust | Count |
| GO:005165126 | Esophagus | HGIN | maintenance of location in cell | 53/2587 | 214/18723 | 1.22e-05 | 3.45e-04 | 53 |
| GO:005123520 | Esophagus | HGIN | maintenance of location | 73/2587 | 327/18723 | 1.73e-05 | 4.71e-04 | 73 |
| GO:00516455 | Esophagus | HGIN | Golgi localization | 7/2587 | 14/18723 | 1.34e-03 | 1.57e-02 | 7 |
| GO:0051235110 | Esophagus | ESCC | maintenance of location | 200/8552 | 327/18723 | 1.01e-08 | 2.02e-07 | 200 |
| GO:00618428 | Esophagus | ESCC | microtubule organizing center localization | 28/8552 | 33/18723 | 3.80e-06 | 4.12e-05 | 28 |
| GO:002260420 | Esophagus | ESCC | regulation of cell morphogenesis | 180/8552 | 309/18723 | 5.19e-06 | 5.45e-05 | 180 |
| GO:00516428 | Esophagus | ESCC | centrosome localization | 27/8552 | 32/18723 | 7.10e-06 | 7.12e-05 | 27 |
| GO:0051651111 | Esophagus | ESCC | maintenance of location in cell | 126/8552 | 214/18723 | 6.57e-05 | 5.00e-04 | 126 |
| GO:000836018 | Esophagus | ESCC | regulation of cell shape | 92/8552 | 154/18723 | 3.00e-04 | 1.81e-03 | 92 |
| GO:005164512 | Esophagus | ESCC | Golgi localization | 11/8552 | 14/18723 | 1.30e-02 | 4.27e-02 | 11 |
| Page: 1 |
| Pathway ID | Tissue | Disease Stage | Description | Gene Ratio | Bg Ratio | pvalue | p.adjust | qvalue | Count |
| Page: 1 |
Top |
Cell-cell communication analysis |
| Identification of potential cell-cell interactions between two cell types and their ligand-receptor pairs for different disease states |
| Ligand | Receptor | LRpair | Pathway | Tissue | Disease Stage |
| Page: 1 |
Top |
Single-cell gene regulatory network inference analysis |
| Find out the significant the regulons (TFs) and the target genes of each regulon across cell types for different disease states |
| TF | Cell Type | Tissue | Disease Stage | Target Gene | RSS | Regulon Activity |
| ∗The dot plots of a searched regulon are shown for all cell subpopulations in each disease state of each tissue based on the regulon specific score inferred using pySCENIC and by calculating the average expression. |
| Page: 1 |
Top |
Somatic mutation of malignant transformation related genes |
| Annotation of somatic variants for genes involved in malignant transformation |
| Hugo Symbol | Variant Class | Variant Classification | dbSNP RS | HGVSc | HGVSp | HGVSp Short | SWISSPROT | BIOTYPE | SIFT | PolyPhen | Tumor Sample Barcode | Tissue | Histology | Sex | Age | Stage | Therapy Types | Drugs | Outcome |
| TBCCD1 | SNV | Missense_Mutation | novel | c.19C>T | p.Leu7Phe | p.L7F | Q9NVR7 | protein_coding | tolerated(0.7) | benign(0) | TCGA-LD-A74U-01 | Breast | breast invasive carcinoma | Female | >=65 | III/IV | Chemotherapy | taxotere | SD |
| TBCCD1 | SNV | Missense_Mutation | novel | c.202N>T | p.Ala68Ser | p.A68S | Q9NVR7 | protein_coding | tolerated(0.45) | benign(0.001) | TCGA-PE-A5DD-01 | Breast | breast invasive carcinoma | Female | <65 | I/II | Chemotherapy | CR | |
| TBCCD1 | insertion | Nonsense_Mutation | novel | c.40_41insTTTTGGAAAGAAACCATTCTTTTTTAAATTAAAAAATGTTTTTGCTT | p.Pro14LeufsTer11 | p.P14Lfs*11 | Q9NVR7 | protein_coding | TCGA-A7-A0CJ-01 | Breast | breast invasive carcinoma | Female | <65 | I/II | Chemotherapy | cytoxan | SD | ||
| TBCCD1 | insertion | In_Frame_Ins | novel | c.101_102insCCTCCCAAAGTGTTGGGATTACAGGCATAAGCCAAG | p.Leu33_Arg34insSerLeuProLysCysTrpAspTyrArgHisLysPro | p.L33_R34insSLPKCWDYRHKP | Q9NVR7 | protein_coding | TCGA-A8-A06X-01 | Breast | breast invasive carcinoma | Female | >=65 | I/II | Unknown | Unknown | SD | ||
| TBCCD1 | insertion | Frame_Shift_Ins | novel | c.1223_1224insACATGTGAAAAGCTCCTGCATATACATGTGCAGACTGTGGGATGTAA | p.Ser409HisfsTer22 | p.S409Hfs*22 | Q9NVR7 | protein_coding | TCGA-A8-A095-01 | Breast | breast invasive carcinoma | Female | <65 | I/II | Chemotherapy | 5-fluorouracil | CR | ||
| TBCCD1 | insertion | Nonsense_Mutation | novel | c.1059_1060insTAAAAAATCATACATA | p.Glu354Ter | p.E354* | Q9NVR7 | protein_coding | TCGA-AN-A0G0-01 | Breast | breast invasive carcinoma | Female | <65 | I/II | Unknown | Unknown | SD | ||
| TBCCD1 | insertion | In_Frame_Ins | novel | c.1112_1113insAATGAG | p.His371delinsGlnMetSer | p.H371delinsQMS | Q9NVR7 | protein_coding | TCGA-B6-A0IA-01 | Breast | breast invasive carcinoma | Female | <65 | I/II | Unknown | Unknown | SD | ||
| TBCCD1 | SNV | Missense_Mutation | novel | c.1165N>T | p.Ile389Phe | p.I389F | Q9NVR7 | protein_coding | deleterious(0.01) | benign(0.238) | TCGA-C5-A8YT-01 | Cervix | cervical & endocervical cancer | Female | <65 | I/II | Chemotherapy | cisplatin | PD |
| TBCCD1 | SNV | Missense_Mutation | rs552386653 | c.1615N>T | p.Arg539Cys | p.R539C | Q9NVR7 | protein_coding | deleterious(0) | benign(0.306) | TCGA-A6-5656-01 | Colorectum | colon adenocarcinoma | Male | >=65 | I/II | Unknown | Unknown | SD |
| TBCCD1 | SNV | Missense_Mutation | c.1578N>T | p.Glu526Asp | p.E526D | Q9NVR7 | protein_coding | tolerated(0.05) | benign(0.311) | TCGA-AA-3977-01 | Colorectum | colon adenocarcinoma | Male | >=65 | I/II | Unknown | Unknown | SD |
| Page: 1 2 3 4 5 6 |
Top |
Related drugs of malignant transformation related genes |
| Identification of chemicals and drugs interact with genes involved in malignant transfromation |
| (DGIdb 4.0) |
| Entrez ID | Symbol | Category | Interaction Types | Drug Claim Name | Drug Name | PMIDs |
| Page: 1 |

Copyright 2023-Present -The University of Texas Health Science Center at Houston |