
|
|||||
|
 | |
| |
| |
| |
| |
| |
|
Gene: TBCC |
Gene summary for TBCC |
| Gene information | Species | Human | Gene symbol | TBCC | Gene ID | 6903 |
| Gene name | tubulin folding cofactor C | |
| Gene Alias | CFC | |
| Cytomap | 6p21.1 | |
| Gene Type | protein-coding | GO ID | GO:0000902 | UniProtAcc | Q15814 |
Top |
Malignant transformation analysis |
| Identification of the aberrant gene expression in precancerous and cancerous lesions by comparing the gene expression of stem-like cells in diseased tissues with normal stem cells |
| Entrez ID | Symbol | Replicates | Species | Organ | Tissue | Adj P-value | Log2FC | Malignancy |
| 6903 | TBCC | LZE2T | Human | Esophagus | ESCC | 6.95e-06 | 9.29e-01 | 0.082 |
| 6903 | TBCC | LZE4T | Human | Esophagus | ESCC | 5.02e-13 | 3.61e-01 | 0.0811 |
| 6903 | TBCC | LZE7T | Human | Esophagus | ESCC | 1.18e-14 | 5.28e-01 | 0.0667 |
| 6903 | TBCC | LZE8T | Human | Esophagus | ESCC | 1.21e-09 | 2.32e-01 | 0.067 |
| 6903 | TBCC | LZE20T | Human | Esophagus | ESCC | 3.61e-09 | 3.22e-01 | 0.0662 |
| 6903 | TBCC | LZE22T | Human | Esophagus | ESCC | 1.61e-04 | 3.61e-01 | 0.068 |
| 6903 | TBCC | LZE24T | Human | Esophagus | ESCC | 4.19e-25 | 5.84e-01 | 0.0596 |
| 6903 | TBCC | LZE21T | Human | Esophagus | ESCC | 4.85e-07 | 3.24e-01 | 0.0655 |
| 6903 | TBCC | P1T-E | Human | Esophagus | ESCC | 4.25e-13 | 6.96e-01 | 0.0875 |
| 6903 | TBCC | P2T-E | Human | Esophagus | ESCC | 3.45e-21 | 4.93e-01 | 0.1177 |
| 6903 | TBCC | P4T-E | Human | Esophagus | ESCC | 3.76e-24 | 6.00e-01 | 0.1323 |
| 6903 | TBCC | P5T-E | Human | Esophagus | ESCC | 9.23e-16 | 3.75e-01 | 0.1327 |
| 6903 | TBCC | P8T-E | Human | Esophagus | ESCC | 6.06e-09 | 2.47e-01 | 0.0889 |
| 6903 | TBCC | P9T-E | Human | Esophagus | ESCC | 8.79e-14 | 2.97e-01 | 0.1131 |
| 6903 | TBCC | P10T-E | Human | Esophagus | ESCC | 1.12e-23 | 4.14e-01 | 0.116 |
| 6903 | TBCC | P11T-E | Human | Esophagus | ESCC | 1.04e-24 | 1.00e+00 | 0.1426 |
| 6903 | TBCC | P12T-E | Human | Esophagus | ESCC | 1.68e-25 | 5.60e-01 | 0.1122 |
| 6903 | TBCC | P15T-E | Human | Esophagus | ESCC | 3.25e-25 | 4.86e-01 | 0.1149 |
| 6903 | TBCC | P16T-E | Human | Esophagus | ESCC | 7.52e-25 | 5.05e-01 | 0.1153 |
| 6903 | TBCC | P17T-E | Human | Esophagus | ESCC | 5.93e-13 | 4.42e-01 | 0.1278 |
| Page: 1 2 3 4 5 6 |
| Tissue | Expression Dynamics | Abbreviation |
| Esophagus |  | ESCC: Esophageal squamous cell carcinoma |
| HGIN: High-grade intraepithelial neoplasias | ||
| LGIN: Low-grade intraepithelial neoplasias | ||
| Oral Cavity | 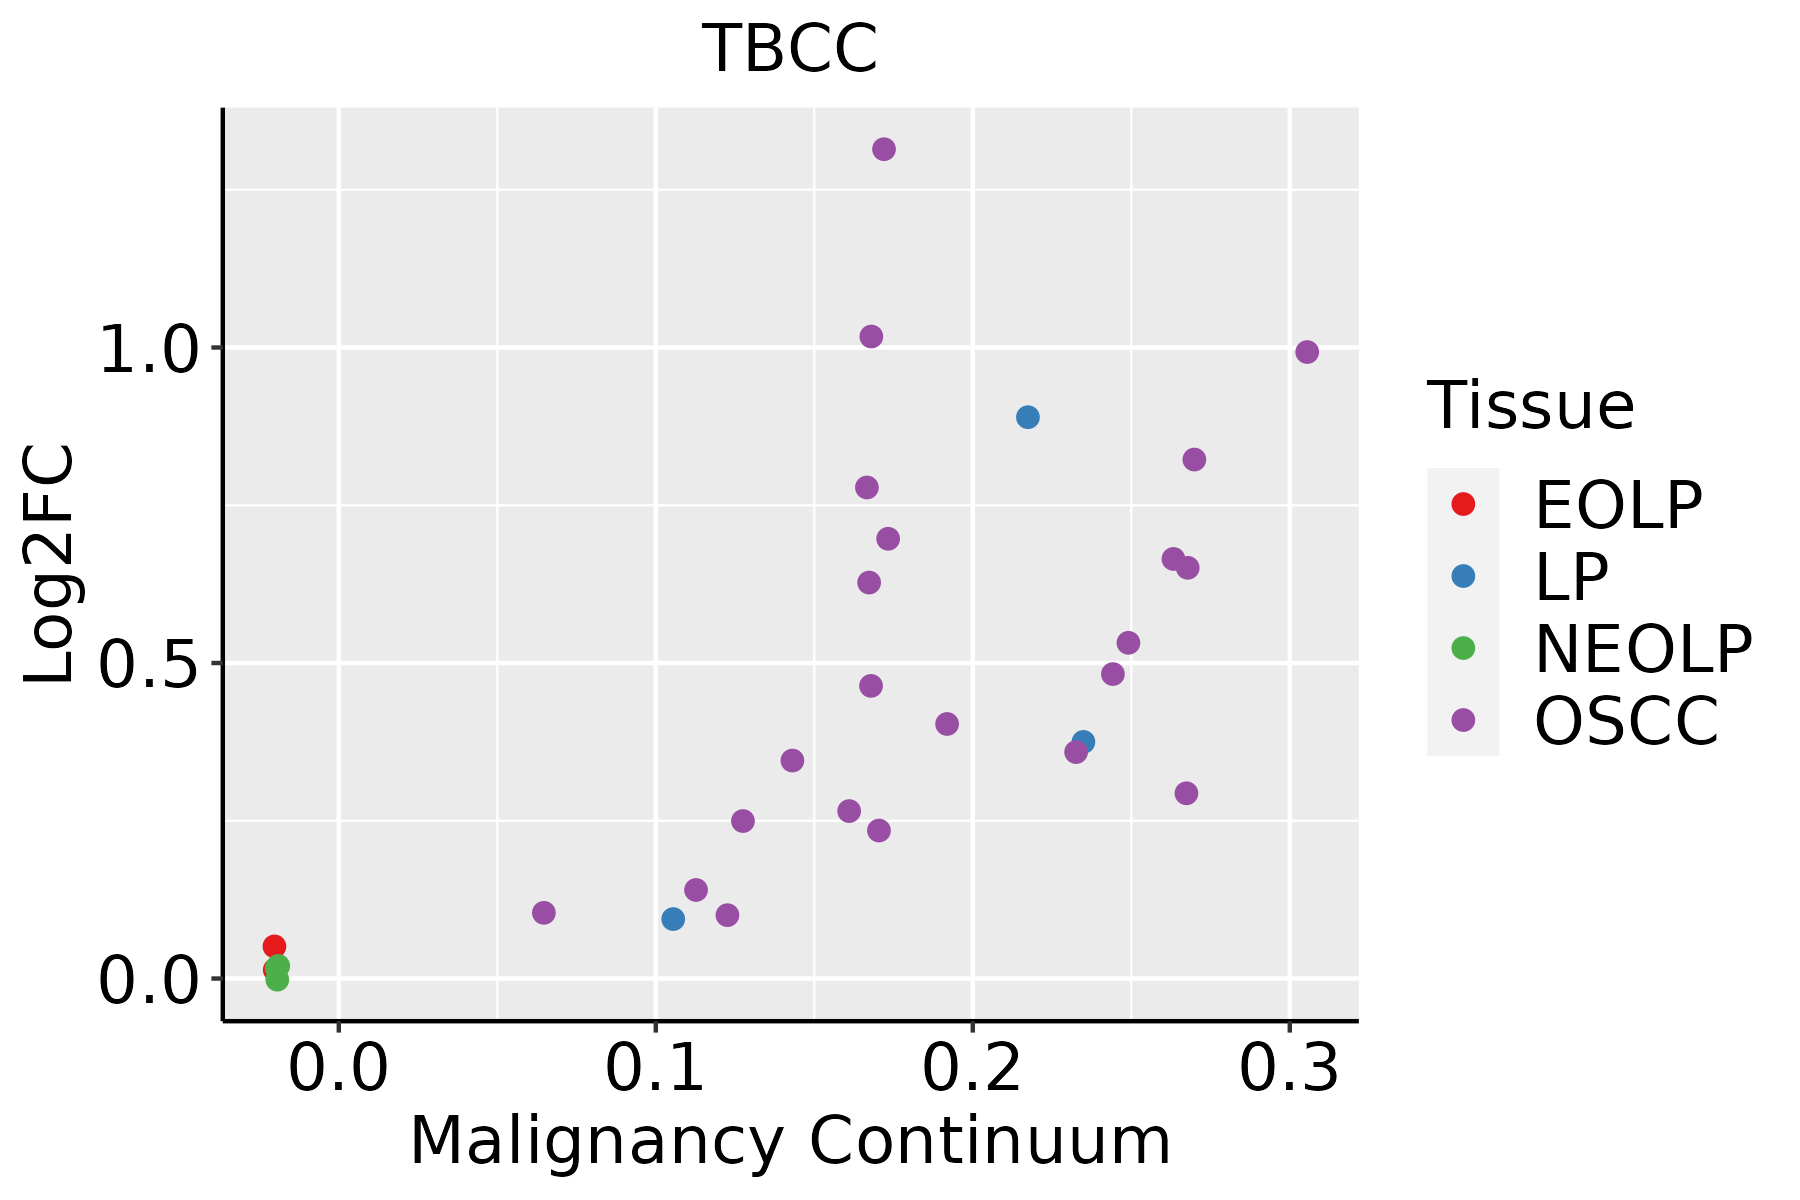 | EOLP: Erosive Oral lichen planus |
| LP: leukoplakia | ||
| NEOLP: Non-erosive oral lichen planus | ||
| OSCC: Oral squamous cell carcinoma | ||
| Skin | 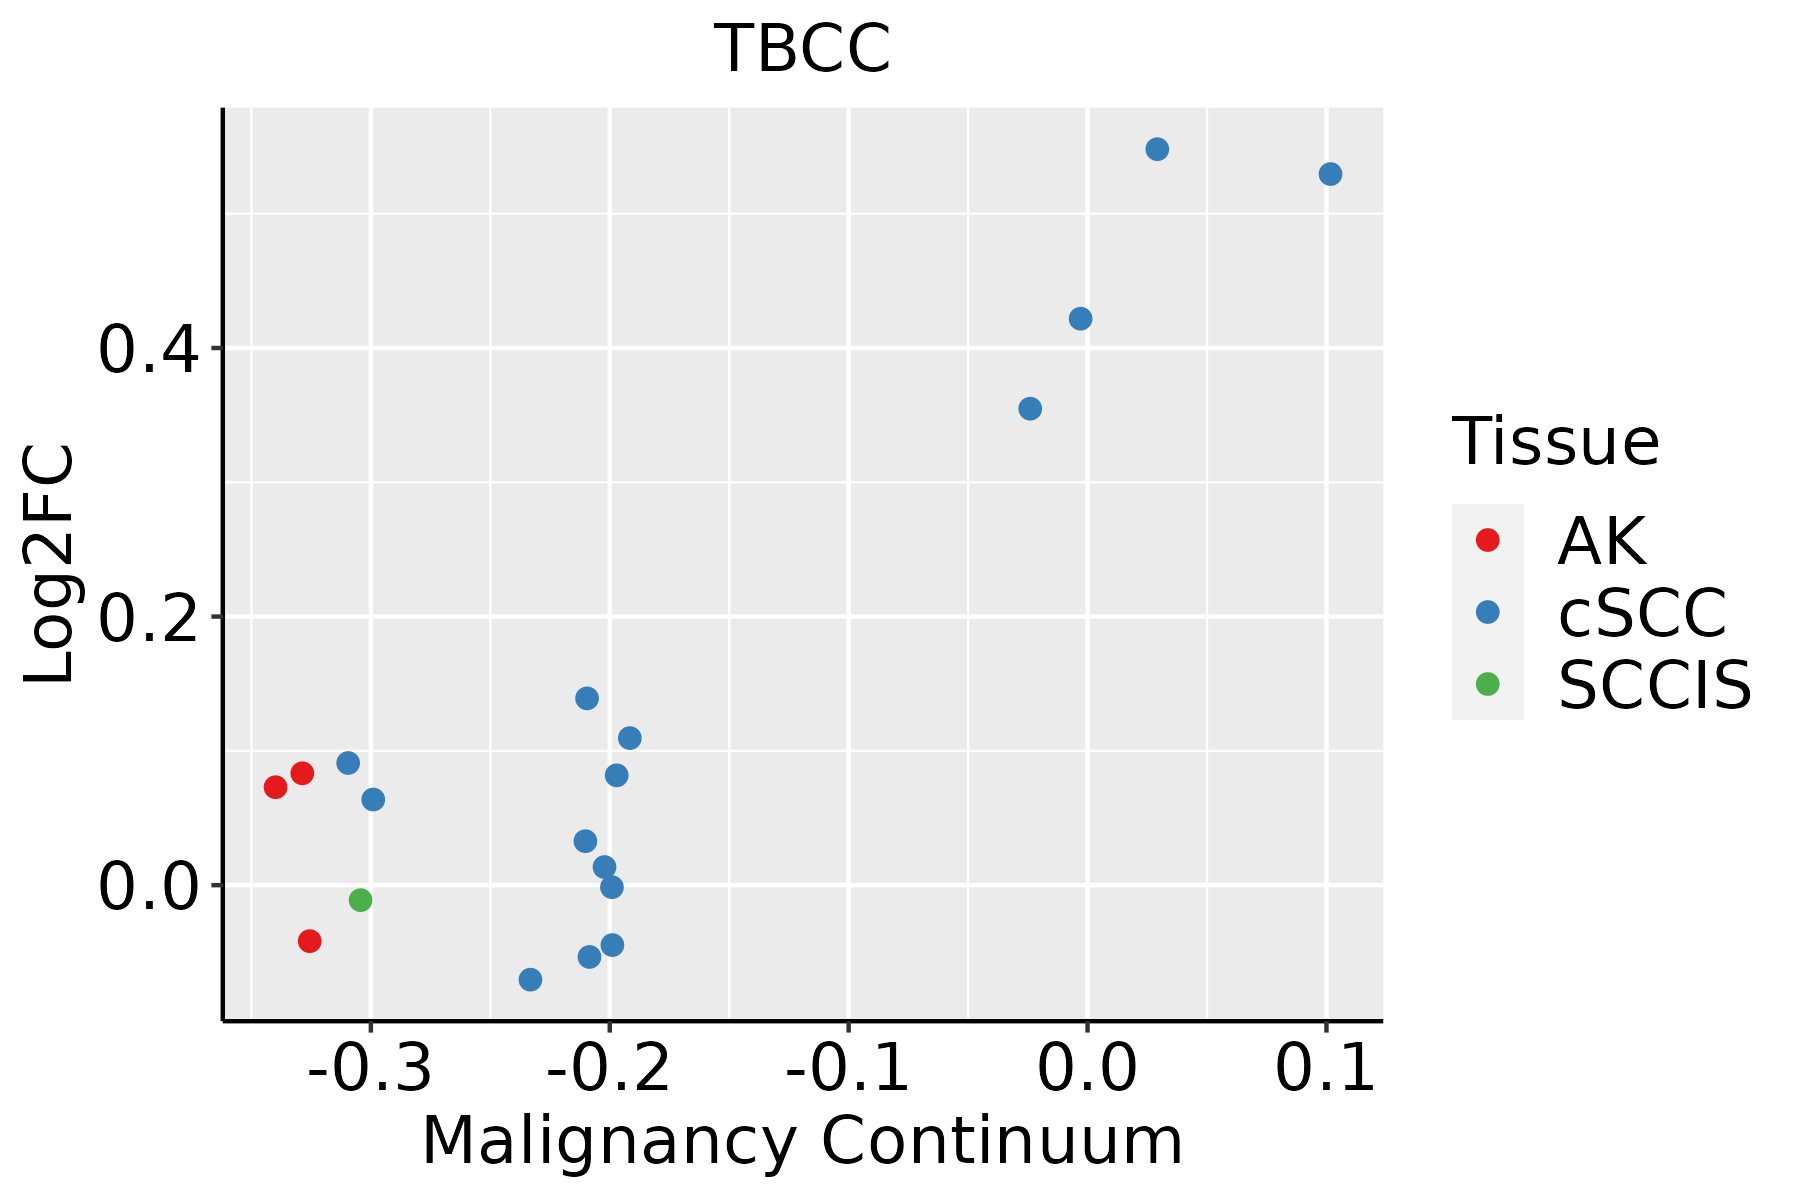 | AK: Actinic keratosis |
| cSCC: Cutaneous squamous cell carcinoma | ||
| SCCIS:squamous cell carcinoma in situ | ||
| Thyroid | 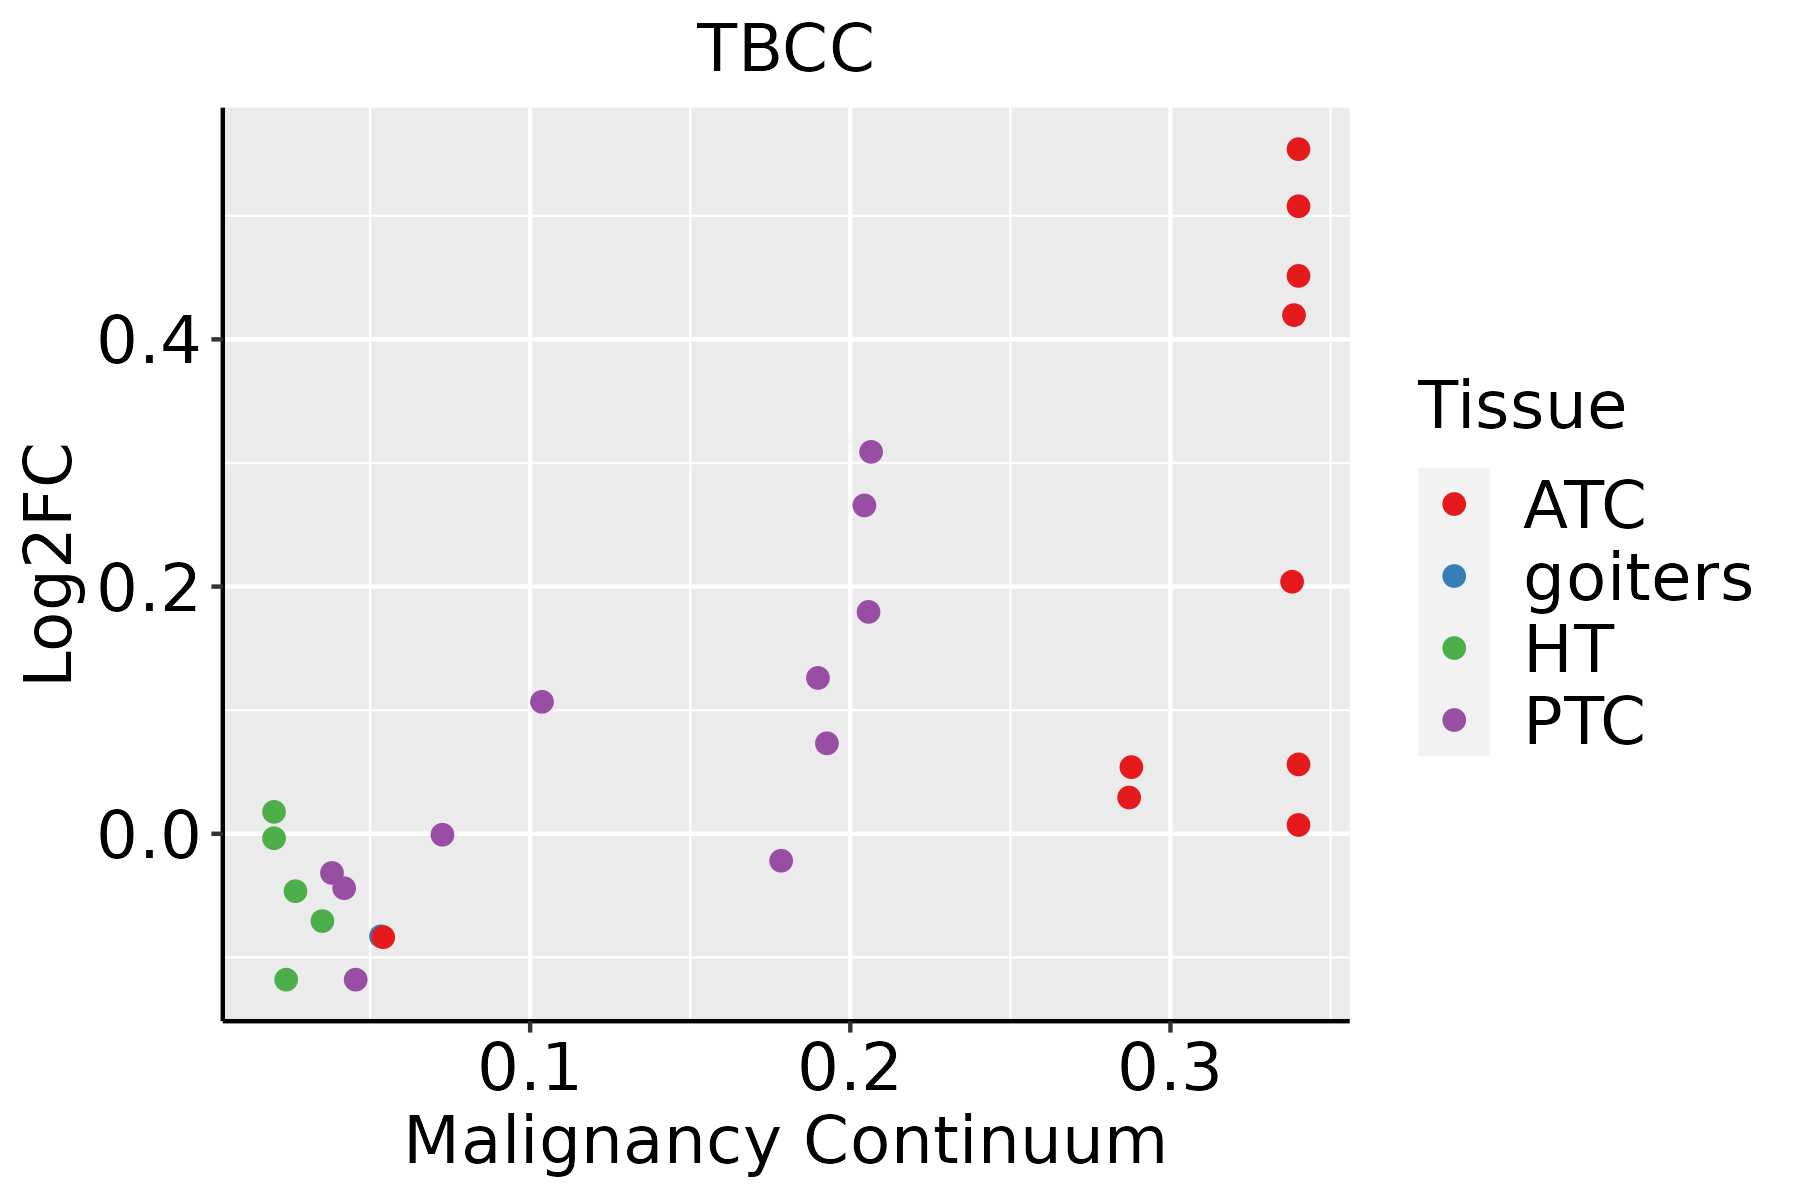 | ATC: Anaplastic thyroid cancer |
| HT: Hashimoto's thyroiditis | ||
| PTC: Papillary thyroid cancer |
| ∗log2FC in expression of this searched gene in stem-like cells from each diseased tissue sample relative to stem-like cells in normal samples in each tissue plotted against the malignancy continuum. Samples are colored based on if they are from different disease stage. |
Top |
Malignant transformation related pathway analysis |
| Find out the enriched GO biological processes and KEGG pathways involved in transition from healthy to precancer to cancer |
| Tissue | Disease Stage | Enriched GO biological Processes |
| Colorectum | AD |  |
| Colorectum | SER |  |
| Colorectum | MSS |  |
| Colorectum | MSI-H |  |
| Colorectum | FAP |  |
| ∗Top 15 enriched GO BP terms are showed in the bar plot of each disease state in each tissue. Each row represents a significant GO biological process which is colored according to the -log10(p.adjust). |
| Page: 1 2 3 4 5 6 7 8 9 |
| GO ID | Tissue | Disease Stage | Description | Gene Ratio | Bg Ratio | pvalue | p.adjust | Count |
| GO:005165126 | Esophagus | HGIN | maintenance of location in cell | 53/2587 | 214/18723 | 1.22e-05 | 3.45e-04 | 53 |
| GO:005123520 | Esophagus | HGIN | maintenance of location | 73/2587 | 327/18723 | 1.73e-05 | 4.71e-04 | 73 |
| GO:00516455 | Esophagus | HGIN | Golgi localization | 7/2587 | 14/18723 | 1.34e-03 | 1.57e-02 | 7 |
| GO:0006457110 | Esophagus | ESCC | protein folding | 163/8552 | 212/18723 | 1.13e-20 | 1.74e-18 | 163 |
| GO:0051235110 | Esophagus | ESCC | maintenance of location | 200/8552 | 327/18723 | 1.01e-08 | 2.02e-07 | 200 |
| GO:00618428 | Esophagus | ESCC | microtubule organizing center localization | 28/8552 | 33/18723 | 3.80e-06 | 4.12e-05 | 28 |
| GO:002260420 | Esophagus | ESCC | regulation of cell morphogenesis | 180/8552 | 309/18723 | 5.19e-06 | 5.45e-05 | 180 |
| GO:00516428 | Esophagus | ESCC | centrosome localization | 27/8552 | 32/18723 | 7.10e-06 | 7.12e-05 | 27 |
| GO:0051651111 | Esophagus | ESCC | maintenance of location in cell | 126/8552 | 214/18723 | 6.57e-05 | 5.00e-04 | 126 |
| GO:000836018 | Esophagus | ESCC | regulation of cell shape | 92/8552 | 154/18723 | 3.00e-04 | 1.81e-03 | 92 |
| GO:005164512 | Esophagus | ESCC | Golgi localization | 11/8552 | 14/18723 | 1.30e-02 | 4.27e-02 | 11 |
| GO:000645718 | Oral cavity | OSCC | protein folding | 154/7305 | 212/18723 | 1.89e-23 | 4.60e-21 | 154 |
| GO:000645719 | Oral cavity | LP | protein folding | 125/4623 | 212/18723 | 1.62e-26 | 8.45e-24 | 125 |
| GO:0006457111 | Skin | cSCC | protein folding | 131/4864 | 212/18723 | 2.96e-28 | 1.32e-25 | 131 |
| GO:0006457112 | Thyroid | PTC | protein folding | 137/5968 | 212/18723 | 8.29e-23 | 2.01e-20 | 137 |
| GO:000645733 | Thyroid | ATC | protein folding | 140/6293 | 212/18723 | 3.46e-22 | 8.09e-20 | 140 |
| Page: 1 |
| Pathway ID | Tissue | Disease Stage | Description | Gene Ratio | Bg Ratio | pvalue | p.adjust | qvalue | Count |
| Page: 1 |
Top |
Cell-cell communication analysis |
| Identification of potential cell-cell interactions between two cell types and their ligand-receptor pairs for different disease states |
| Ligand | Receptor | LRpair | Pathway | Tissue | Disease Stage |
| Page: 1 |
Top |
Single-cell gene regulatory network inference analysis |
| Find out the significant the regulons (TFs) and the target genes of each regulon across cell types for different disease states |
| TF | Cell Type | Tissue | Disease Stage | Target Gene | RSS | Regulon Activity |
| ∗The dot plots of a searched regulon are shown for all cell subpopulations in each disease state of each tissue based on the regulon specific score inferred using pySCENIC and by calculating the average expression. |
| Page: 1 |
Top |
Somatic mutation of malignant transformation related genes |
| Annotation of somatic variants for genes involved in malignant transformation |
| Hugo Symbol | Variant Class | Variant Classification | dbSNP RS | HGVSc | HGVSp | HGVSp Short | SWISSPROT | BIOTYPE | SIFT | PolyPhen | Tumor Sample Barcode | Tissue | Histology | Sex | Age | Stage | Therapy Types | Drugs | Outcome |
| TBCC | SNV | Missense_Mutation | c.239C>T | p.Ser80Leu | p.S80L | Q15814 | protein_coding | tolerated(0.22) | benign(0.176) | TCGA-A2-A0CT-01 | Breast | breast invasive carcinoma | Female | >=65 | I/II | Chemotherapy | cytoxan | SD | |
| TBCC | SNV | Missense_Mutation | rs769836035 | c.484N>T | p.Val162Phe | p.V162F | Q15814 | protein_coding | deleterious(0.03) | benign(0.059) | TCGA-A2-A0T6-01 | Breast | breast invasive carcinoma | Female | <65 | I/II | Chemotherapy | adriamycin | SD |
| TBCC | SNV | Missense_Mutation | novel | c.942N>A | p.Asn314Lys | p.N314K | Q15814 | protein_coding | deleterious(0.01) | benign(0.15) | TCGA-A7-A6VX-01 | Breast | breast invasive carcinoma | Female | >=65 | I/II | Chemotherapy | docetaxel | CR |
| TBCC | SNV | Missense_Mutation | c.159G>C | p.Glu53Asp | p.E53D | Q15814 | protein_coding | tolerated(0.39) | benign(0.04) | TCGA-AR-A0TX-01 | Breast | breast invasive carcinoma | Female | <65 | I/II | Unknown | Unknown | SD | |
| TBCC | SNV | Missense_Mutation | c.874T>C | p.Tyr292His | p.Y292H | Q15814 | protein_coding | deleterious(0) | probably_damaging(0.999) | TCGA-E2-A1IL-01 | Breast | breast invasive carcinoma | Female | >=65 | I/II | Hormone Therapy | arimidex | SD | |
| TBCC | SNV | Missense_Mutation | c.949N>A | p.Asp317Asn | p.D317N | Q15814 | protein_coding | tolerated(0.15) | benign(0.003) | TCGA-EW-A1J5-01 | Breast | breast invasive carcinoma | Female | <65 | I/II | Chemotherapy | adriamycin | SD | |
| TBCC | insertion | In_Frame_Ins | novel | c.782_783insGAG | p.Leu261_Arg262insSer | p.L261_R262insS | Q15814 | protein_coding | TCGA-A8-A08H-01 | Breast | breast invasive carcinoma | Female | >=65 | I/II | Unknown | Unknown | SD | ||
| TBCC | deletion | Frame_Shift_Del | novel | c.616_652delNNNNNNNNNNNNNNNNNNNNNNNNNNNNNNNNNNNNN | p.Val206CysfsTer10 | p.V206Cfs*10 | Q15814 | protein_coding | TCGA-LP-A4AW-01 | Cervix | cervical & endocervical cancer | Female | <65 | I/II | Unknown | Unknown | SD | ||
| TBCC | SNV | Missense_Mutation | c.898N>A | p.Asp300Asn | p.D300N | Q15814 | protein_coding | deleterious(0.01) | benign(0.385) | TCGA-AA-3712-01 | Colorectum | colon adenocarcinoma | Male | >=65 | III/IV | Unknown | Unknown | SD | |
| TBCC | SNV | Missense_Mutation | c.260N>A | p.Ala87Glu | p.A87E | Q15814 | protein_coding | deleterious(0.01) | probably_damaging(0.993) | TCGA-AA-3715-01 | Colorectum | colon adenocarcinoma | Male | >=65 | I/II | Unknown | Unknown | PD |
| Page: 1 2 3 |
Top |
Related drugs of malignant transformation related genes |
| Identification of chemicals and drugs interact with genes involved in malignant transfromation |
| (DGIdb 4.0) |
| Entrez ID | Symbol | Category | Interaction Types | Drug Claim Name | Drug Name | PMIDs |
| Page: 1 |

Copyright 2023-Present -The University of Texas Health Science Center at Houston |