
|
|||||
|
 | |
| |
| |
| |
| |
| |
|
Gene: TBCB |
Gene summary for TBCB |
| Gene information | Species | Human | Gene symbol | TBCB | Gene ID | 1155 |
| Gene name | tubulin folding cofactor B | |
| Gene Alias | CG22 | |
| Cytomap | 19q13.12 | |
| Gene Type | protein-coding | GO ID | GO:0007275 | UniProtAcc | Q99426 |
Top |
Malignant transformation analysis |
| Identification of the aberrant gene expression in precancerous and cancerous lesions by comparing the gene expression of stem-like cells in diseased tissues with normal stem cells |
| Entrez ID | Symbol | Replicates | Species | Organ | Tissue | Adj P-value | Log2FC | Malignancy |
| 1155 | TBCB | GSM4909281 | Human | Breast | IDC | 8.34e-13 | 5.04e-01 | 0.21 |
| 1155 | TBCB | GSM4909282 | Human | Breast | IDC | 4.97e-19 | 6.05e-01 | -0.0288 |
| 1155 | TBCB | GSM4909285 | Human | Breast | IDC | 4.50e-31 | 6.99e-01 | 0.21 |
| 1155 | TBCB | GSM4909294 | Human | Breast | IDC | 8.98e-03 | -1.15e-01 | 0.2022 |
| 1155 | TBCB | GSM4909296 | Human | Breast | IDC | 2.51e-10 | 1.05e-01 | 0.1524 |
| 1155 | TBCB | GSM4909297 | Human | Breast | IDC | 4.81e-15 | 2.72e-01 | 0.1517 |
| 1155 | TBCB | GSM4909301 | Human | Breast | IDC | 3.11e-27 | 7.11e-01 | 0.1577 |
| 1155 | TBCB | GSM4909304 | Human | Breast | IDC | 6.93e-07 | 3.38e-01 | 0.1636 |
| 1155 | TBCB | GSM4909307 | Human | Breast | IDC | 7.92e-05 | 3.33e-01 | 0.1569 |
| 1155 | TBCB | GSM4909311 | Human | Breast | IDC | 2.43e-24 | -1.17e-01 | 0.1534 |
| 1155 | TBCB | GSM4909312 | Human | Breast | IDC | 6.28e-08 | 7.27e-02 | 0.1552 |
| 1155 | TBCB | GSM4909316 | Human | Breast | IDC | 8.15e-03 | 2.59e-01 | 0.21 |
| 1155 | TBCB | GSM4909319 | Human | Breast | IDC | 3.69e-32 | 3.92e-02 | 0.1563 |
| 1155 | TBCB | GSM4909320 | Human | Breast | IDC | 1.86e-14 | 4.61e-01 | 0.1575 |
| 1155 | TBCB | GSM4909321 | Human | Breast | IDC | 2.12e-17 | 2.86e-01 | 0.1559 |
| 1155 | TBCB | brca1 | Human | Breast | Precancer | 1.97e-02 | 3.73e-01 | -0.0338 |
| 1155 | TBCB | brca2 | Human | Breast | Precancer | 7.57e-09 | 3.37e-01 | -0.024 |
| 1155 | TBCB | brca3 | Human | Breast | Precancer | 3.44e-04 | 2.81e-01 | -0.0263 |
| 1155 | TBCB | NCCBC14 | Human | Breast | DCIS | 1.57e-05 | -6.06e-02 | 0.2021 |
| 1155 | TBCB | NCCBC2 | Human | Breast | DCIS | 2.34e-05 | 1.95e-01 | 0.1554 |
| Page: 1 2 3 4 5 6 7 8 9 10 |
| Tissue | Expression Dynamics | Abbreviation |
| Breast | 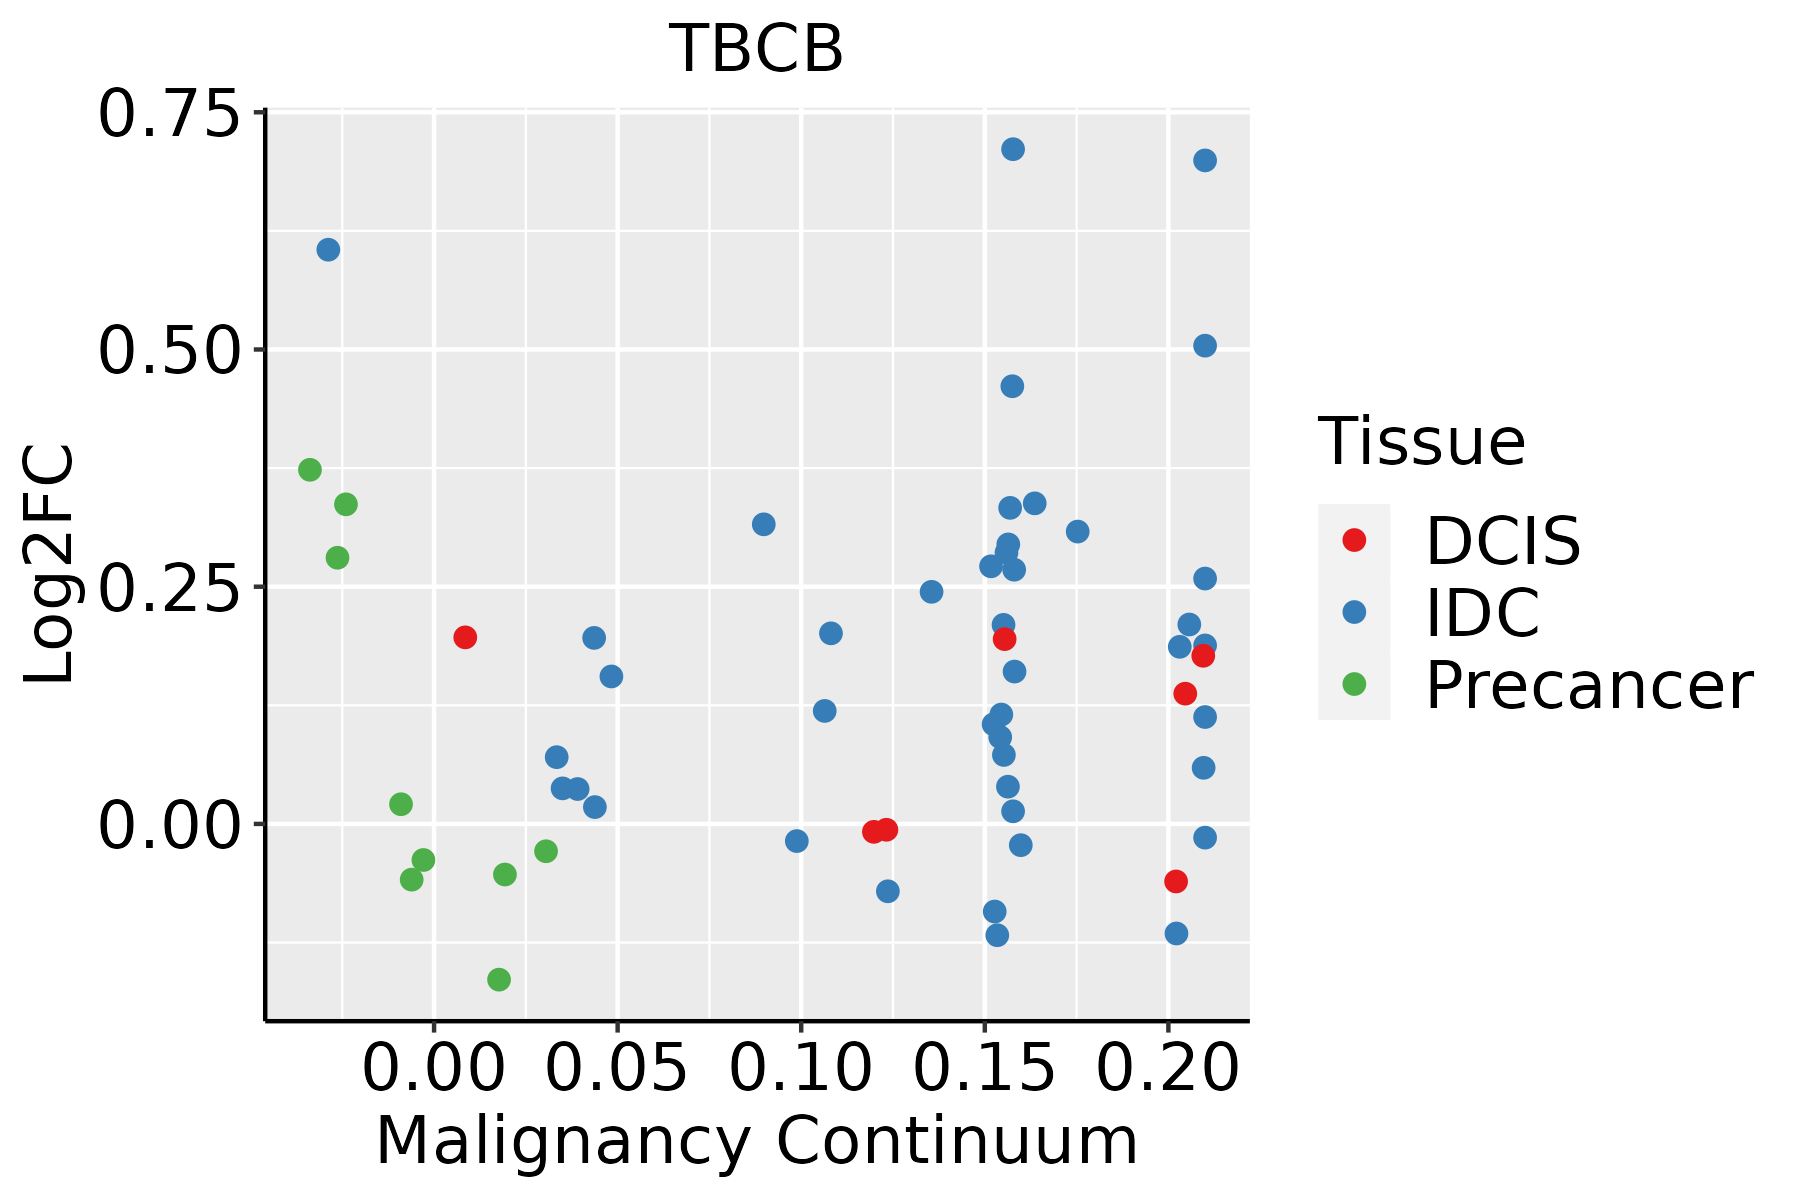 | IDC: Invasive ductal carcinoma |
| DCIS: Ductal carcinoma in situ | ||
| Precancer(BRCA1-mut): Precancerous lesion from BRCA1 mutation carriers | ||
| Colorectum (GSE201348) |  | FAP: Familial adenomatous polyposis |
| CRC: Colorectal cancer | ||
| Colorectum (HTA11) |  | AD: Adenomas |
| SER: Sessile serrated lesions | ||
| MSI-H: Microsatellite-high colorectal cancer | ||
| MSS: Microsatellite stable colorectal cancer | ||
| Endometrium |  | AEH: Atypical endometrial hyperplasia |
| EEC: Endometrioid Cancer | ||
| Esophagus | 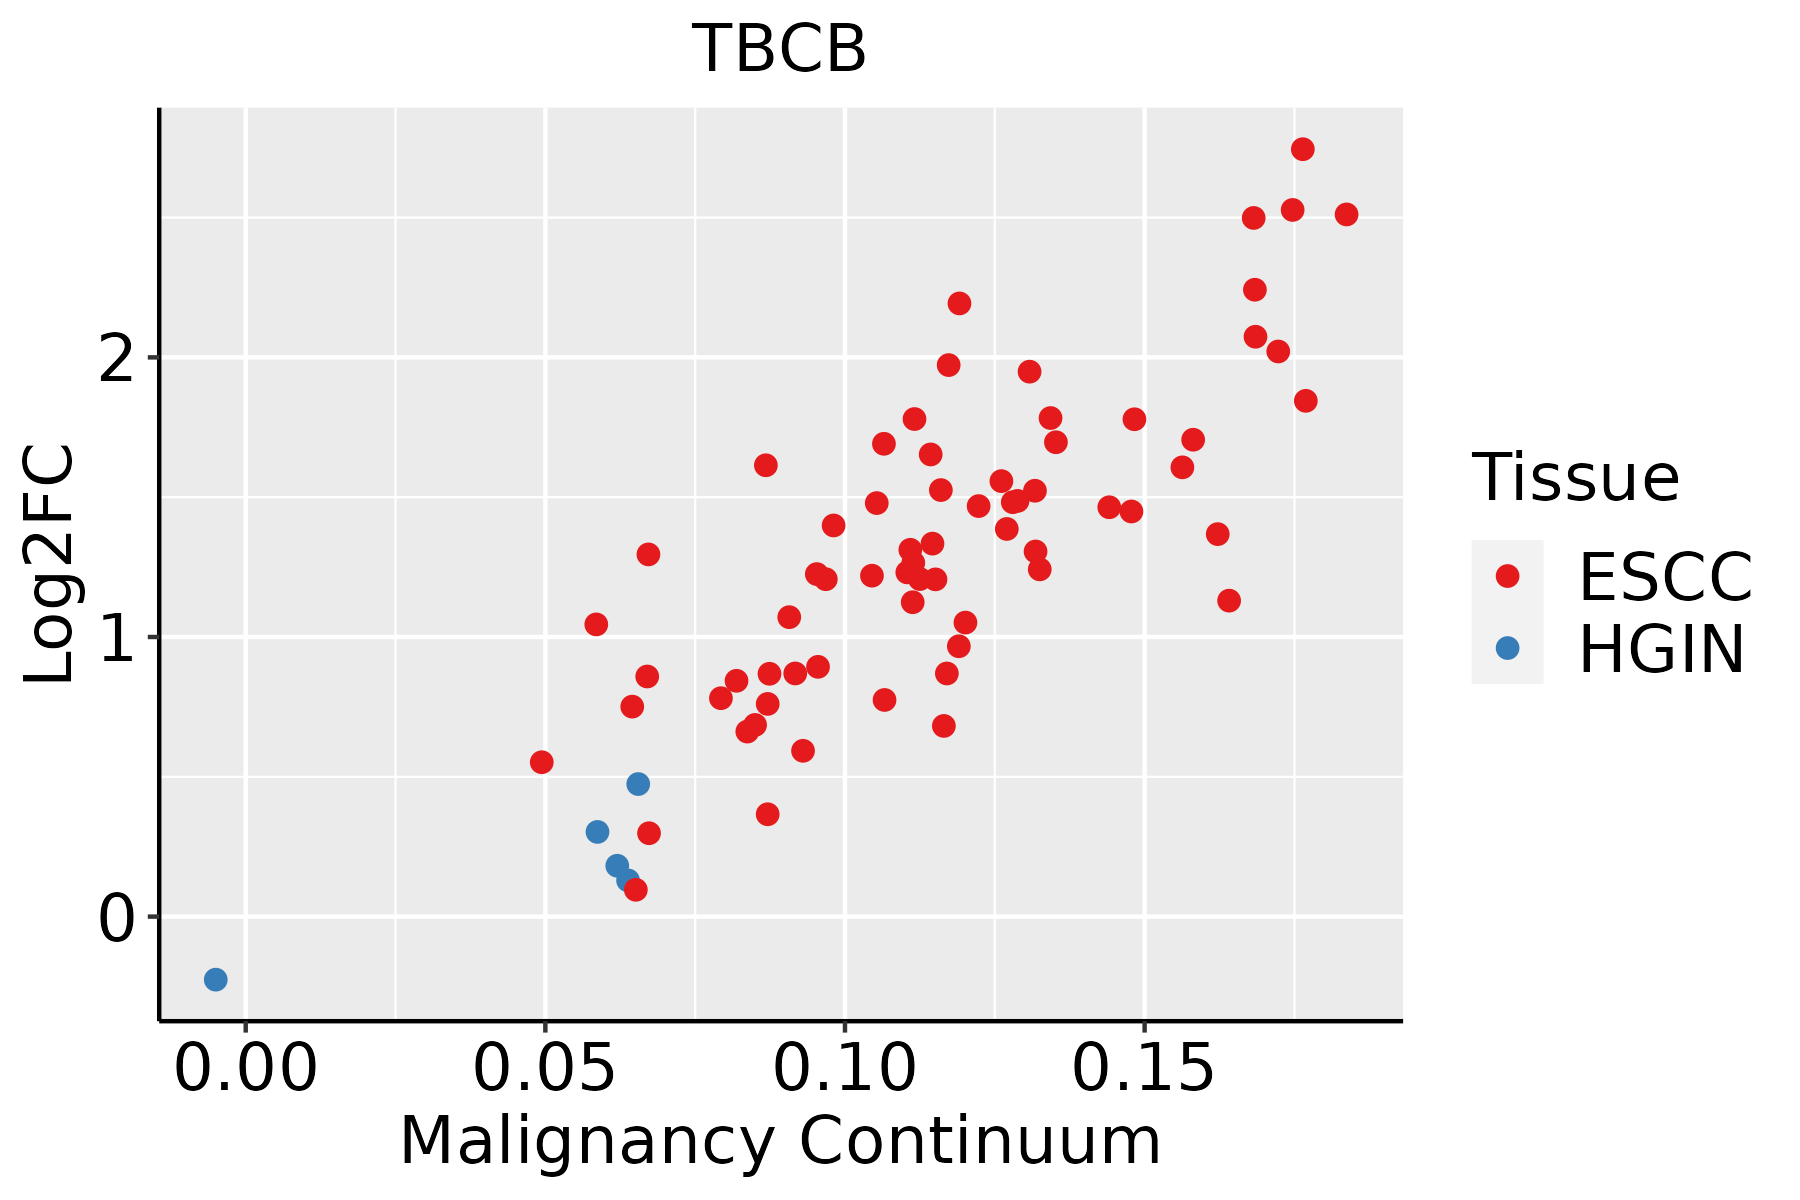 | ESCC: Esophageal squamous cell carcinoma |
| HGIN: High-grade intraepithelial neoplasias | ||
| LGIN: Low-grade intraepithelial neoplasias | ||
| Liver | 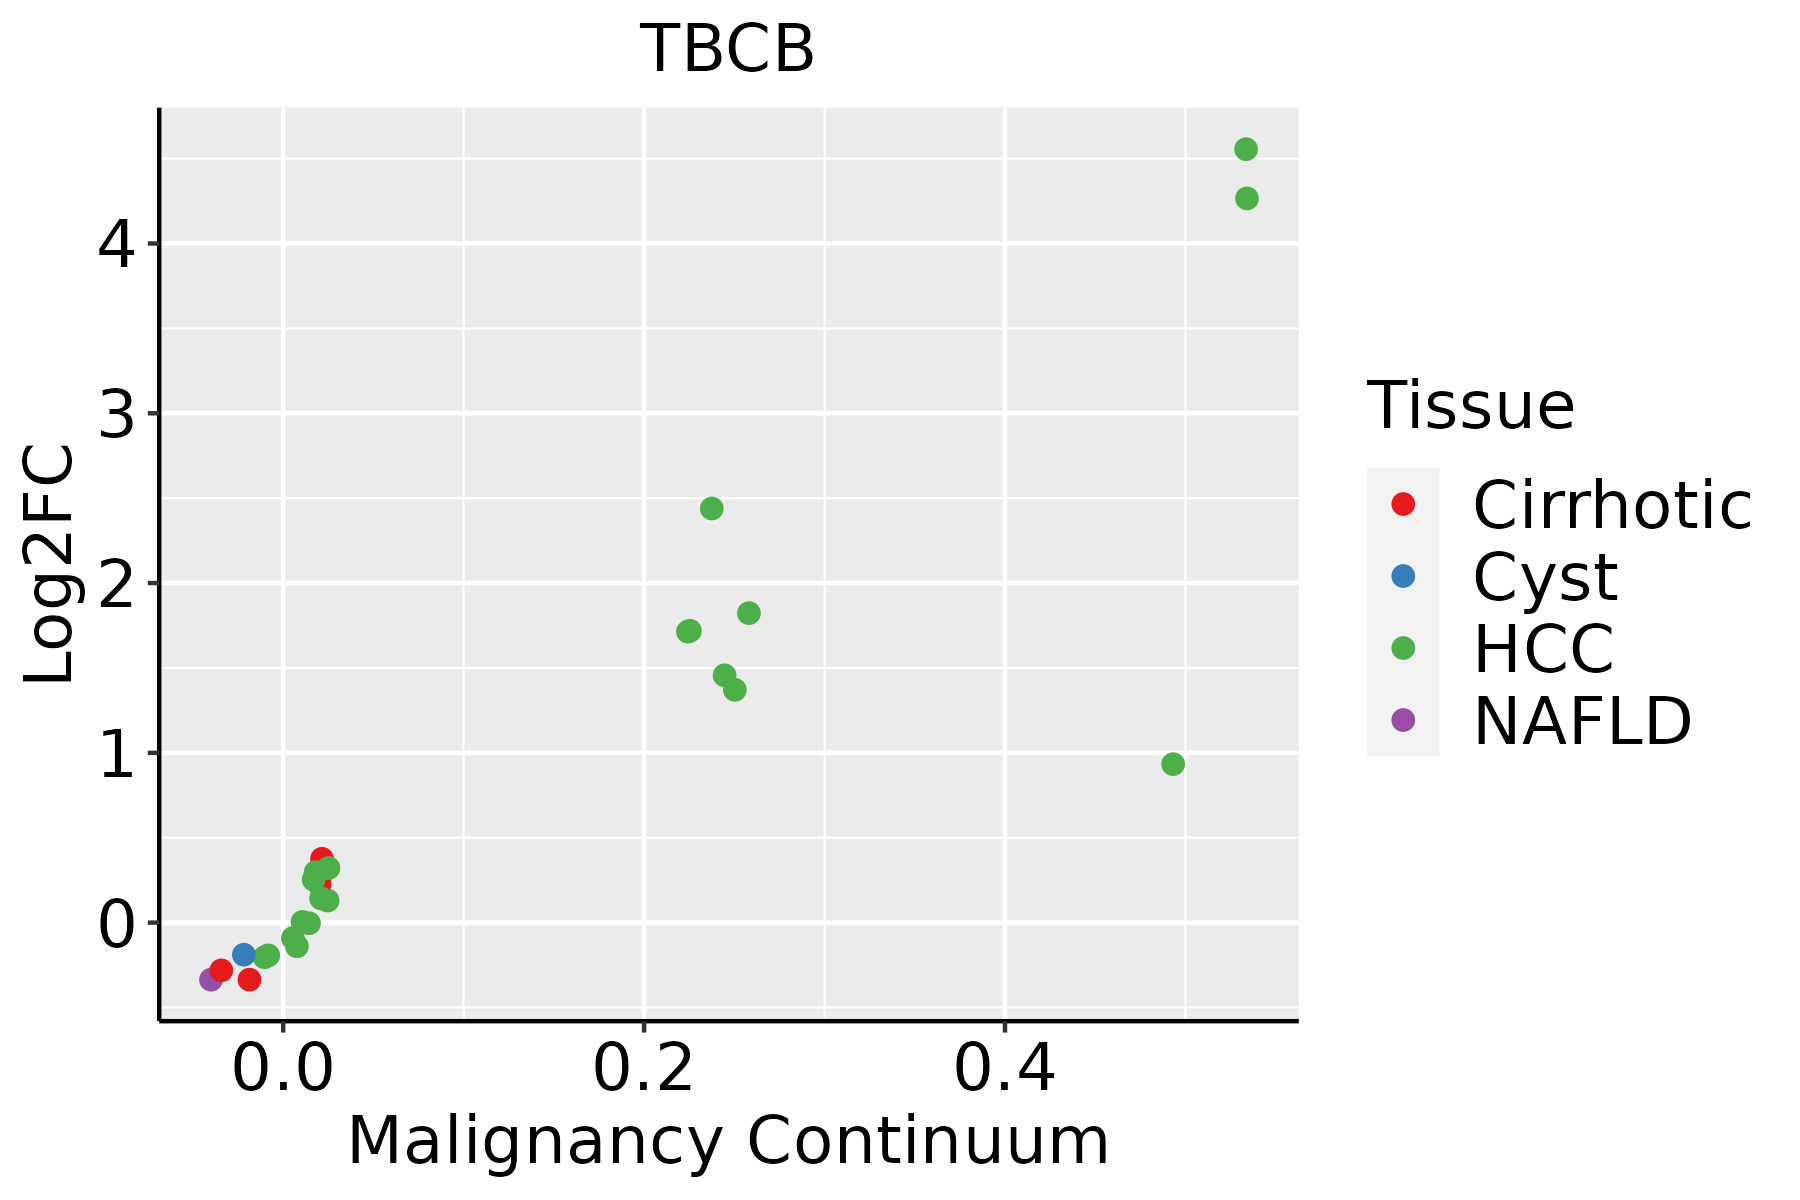 | HCC: Hepatocellular carcinoma |
| NAFLD: Non-alcoholic fatty liver disease | ||
| Oral Cavity | 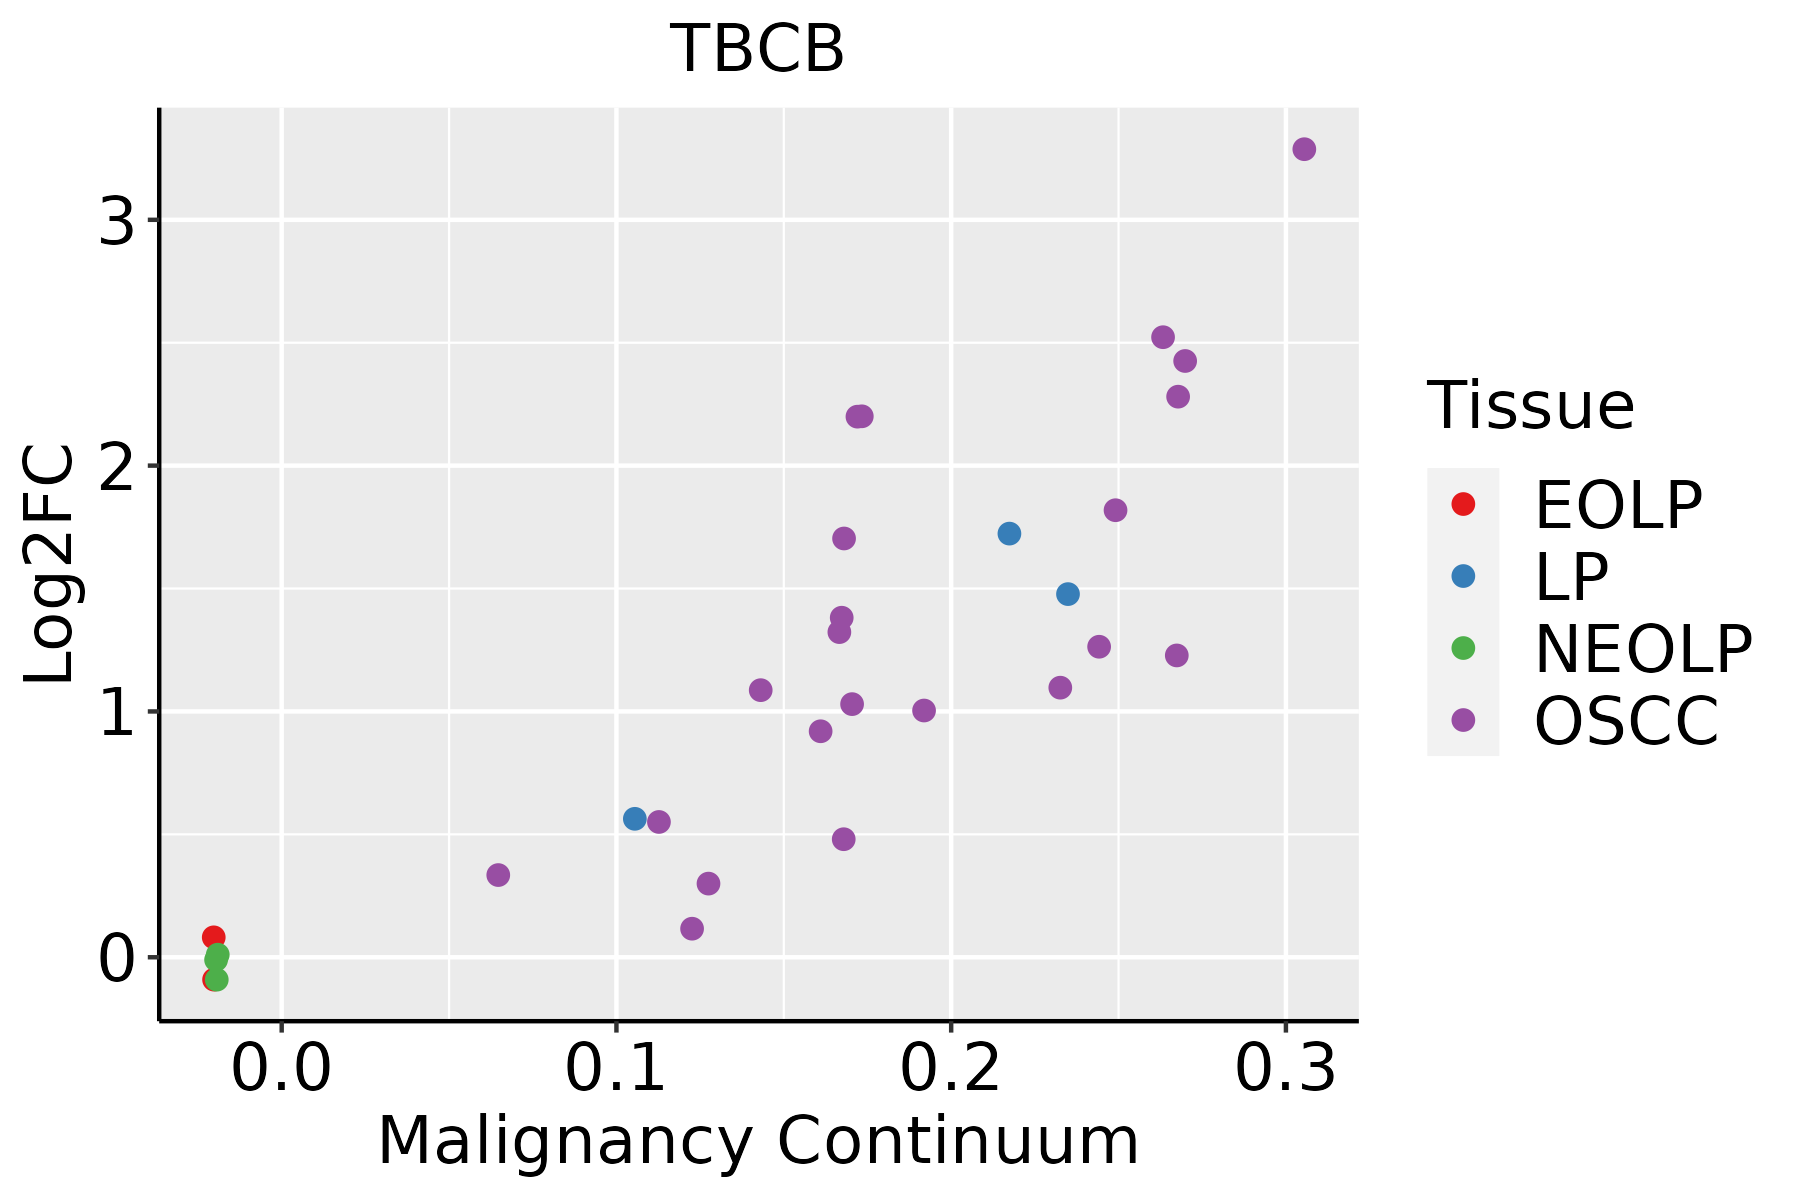 | EOLP: Erosive Oral lichen planus |
| LP: leukoplakia | ||
| NEOLP: Non-erosive oral lichen planus | ||
| OSCC: Oral squamous cell carcinoma | ||
| Skin | 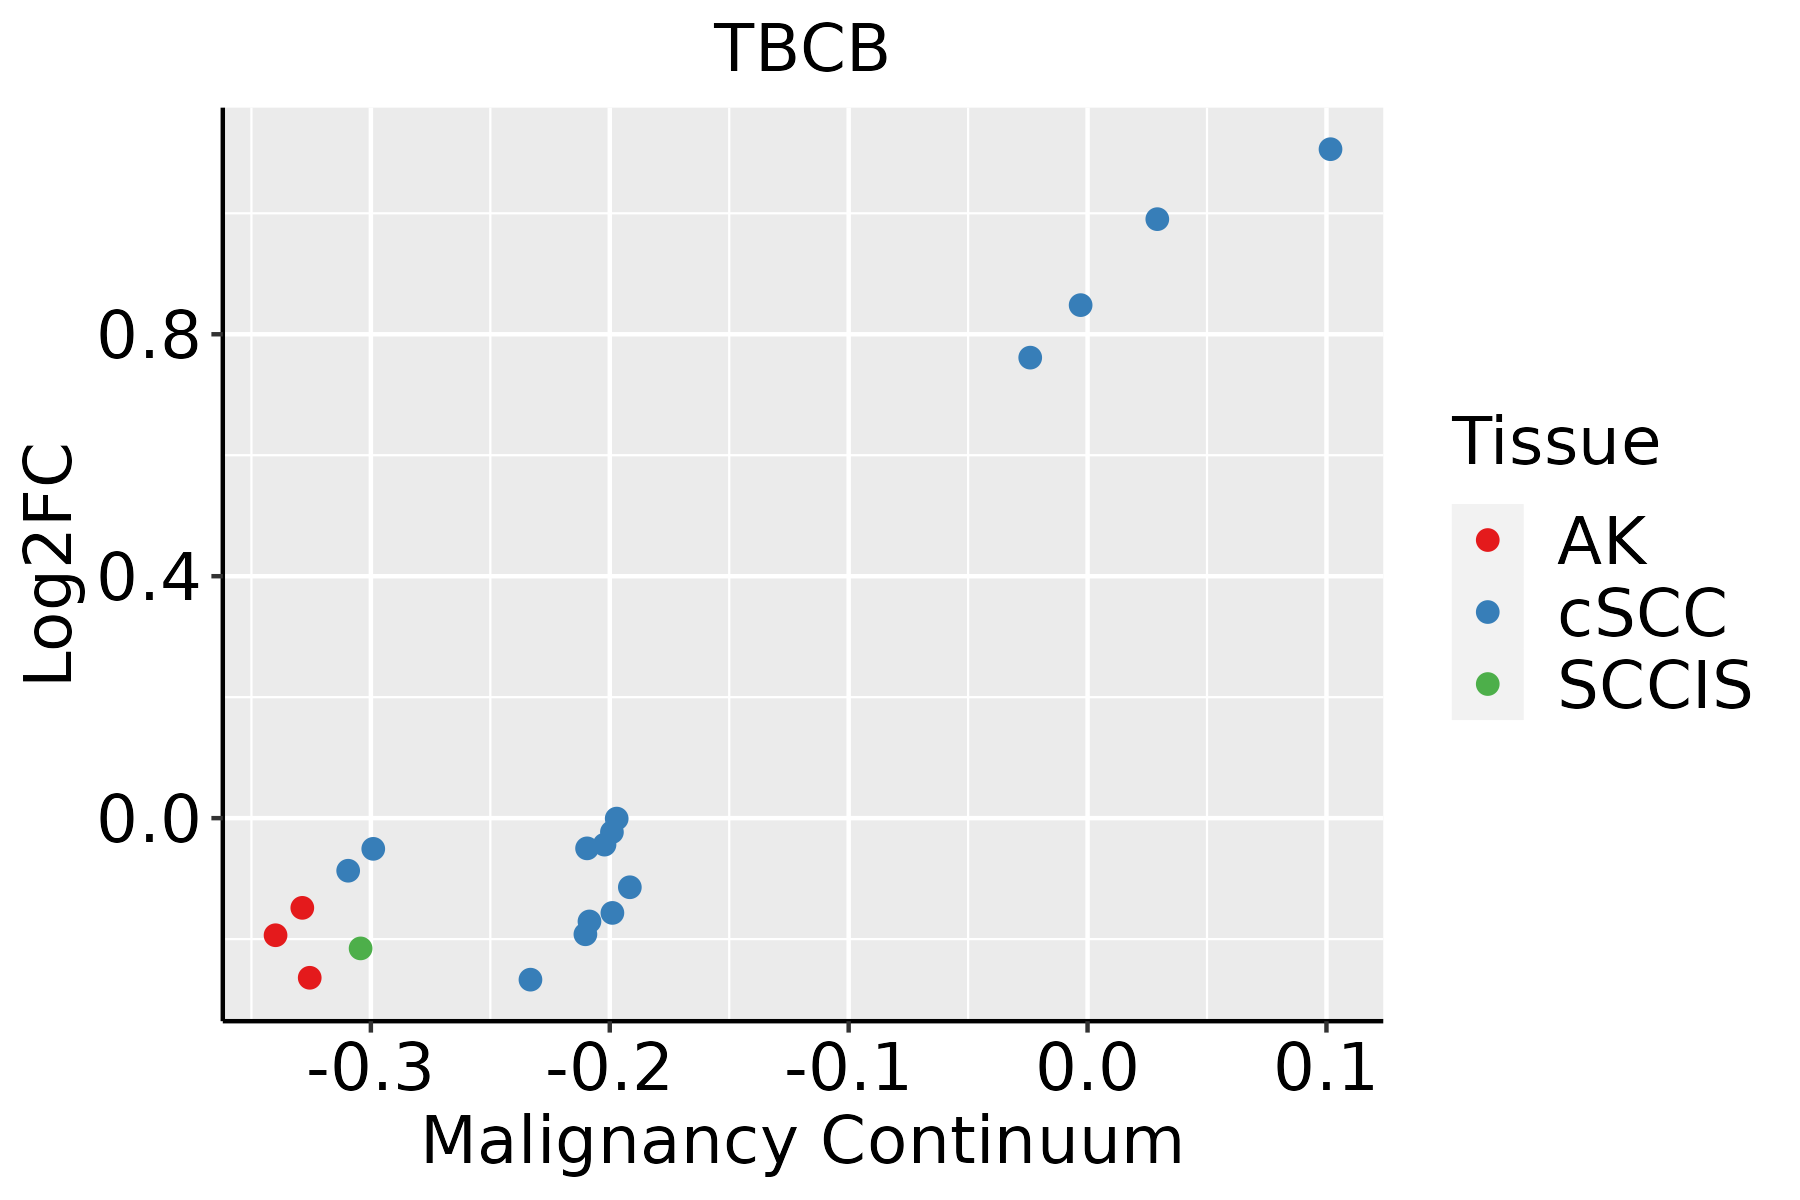 | AK: Actinic keratosis |
| cSCC: Cutaneous squamous cell carcinoma | ||
| SCCIS:squamous cell carcinoma in situ | ||
| Thyroid | 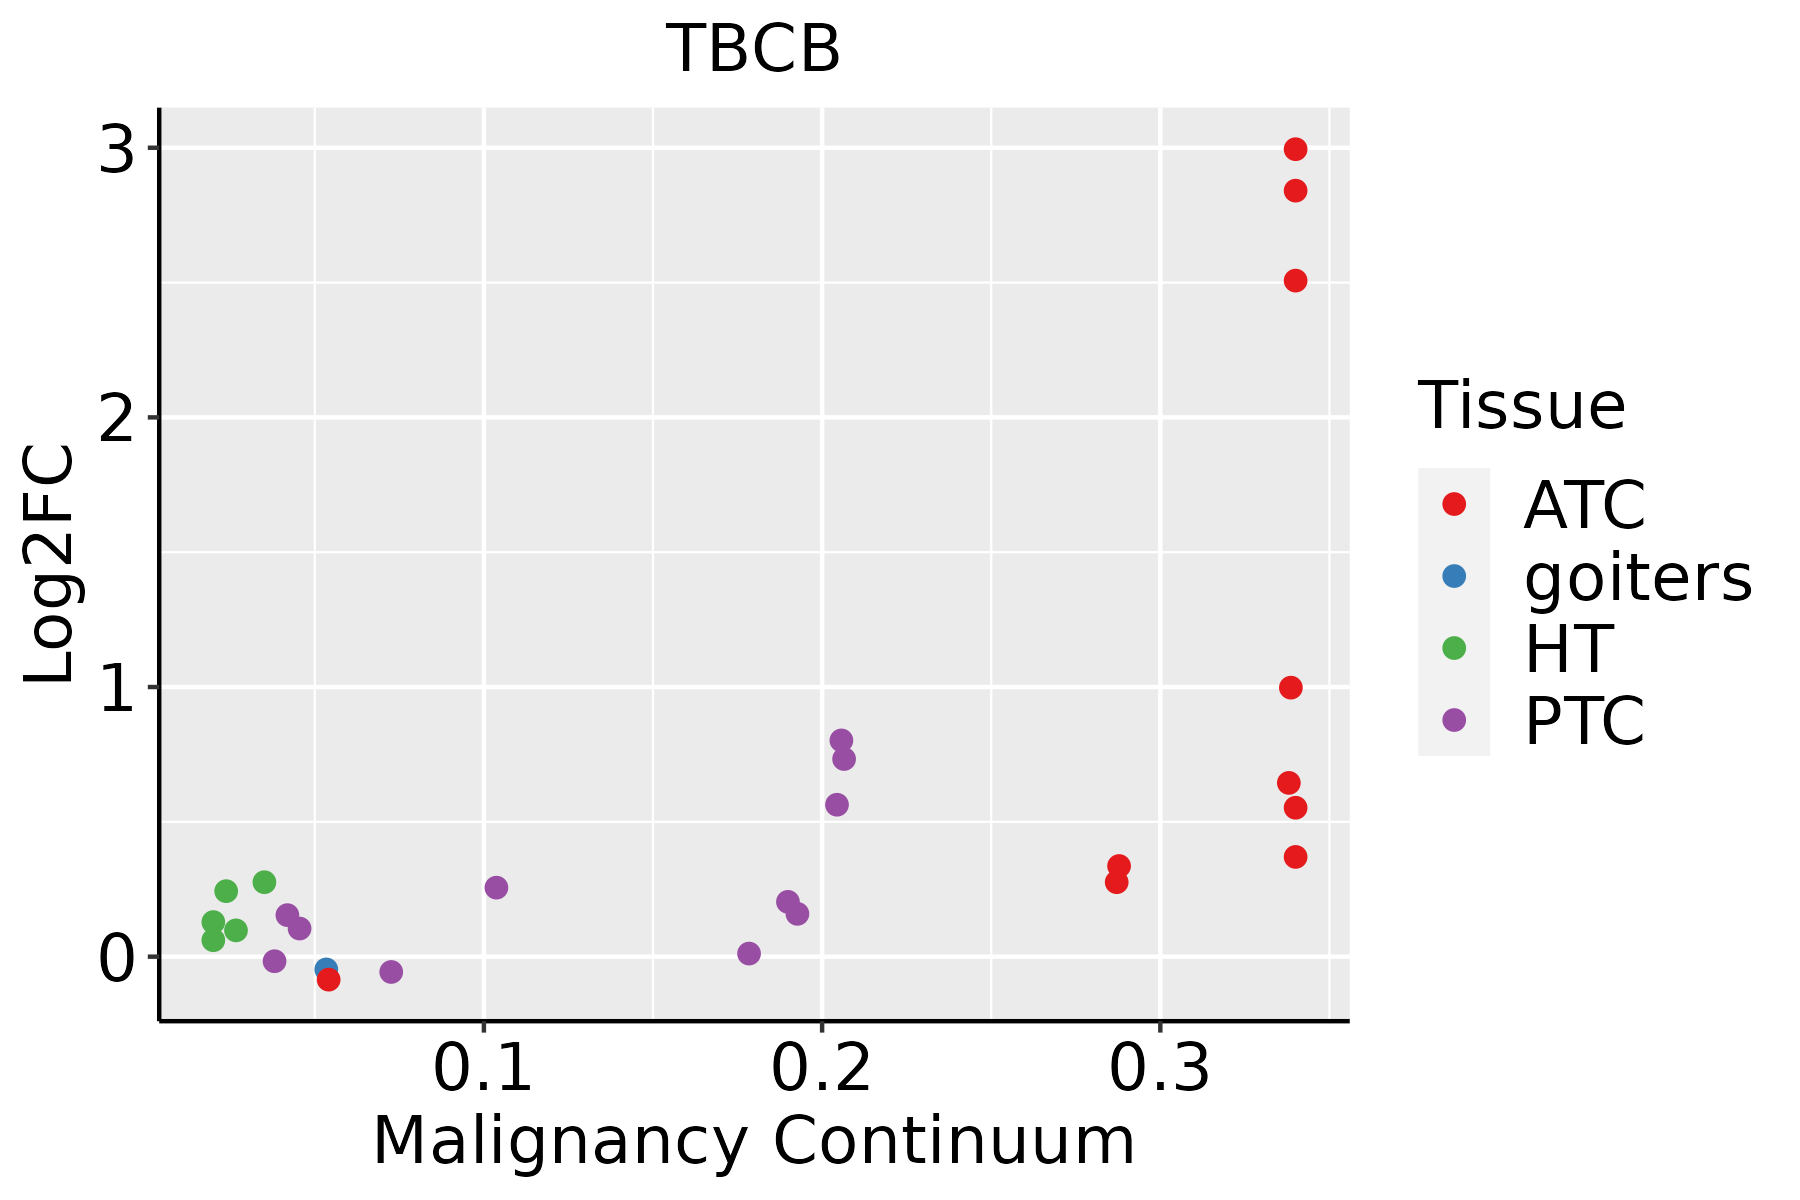 | ATC: Anaplastic thyroid cancer |
| HT: Hashimoto's thyroiditis | ||
| PTC: Papillary thyroid cancer |
| ∗log2FC in expression of this searched gene in stem-like cells from each diseased tissue sample relative to stem-like cells in normal samples in each tissue plotted against the malignancy continuum. Samples are colored based on if they are from different disease stage. |
Top |
Malignant transformation related pathway analysis |
| Find out the enriched GO biological processes and KEGG pathways involved in transition from healthy to precancer to cancer |
| Tissue | Disease Stage | Enriched GO biological Processes |
| Colorectum | AD |  |
| Colorectum | SER |  |
| Colorectum | MSS |  |
| Colorectum | MSI-H |  |
| Colorectum | FAP |  |
| ∗Top 15 enriched GO BP terms are showed in the bar plot of each disease state in each tissue. Each row represents a significant GO biological process which is colored according to the -log10(p.adjust). |
| Page: 1 2 3 4 5 6 7 8 9 |
| GO ID | Tissue | Disease Stage | Description | Gene Ratio | Bg Ratio | pvalue | p.adjust | Count |
| Page: 1 |
| Pathway ID | Tissue | Disease Stage | Description | Gene Ratio | Bg Ratio | pvalue | p.adjust | qvalue | Count |
| Page: 1 |
Top |
Cell-cell communication analysis |
| Identification of potential cell-cell interactions between two cell types and their ligand-receptor pairs for different disease states |
| Ligand | Receptor | LRpair | Pathway | Tissue | Disease Stage |
| Page: 1 |
Top |
Single-cell gene regulatory network inference analysis |
| Find out the significant the regulons (TFs) and the target genes of each regulon across cell types for different disease states |
| TF | Cell Type | Tissue | Disease Stage | Target Gene | RSS | Regulon Activity |
| ∗The dot plots of a searched regulon are shown for all cell subpopulations in each disease state of each tissue based on the regulon specific score inferred using pySCENIC and by calculating the average expression. |
| Page: 1 |
Top |
Somatic mutation of malignant transformation related genes |
| Annotation of somatic variants for genes involved in malignant transformation |
| Hugo Symbol | Variant Class | Variant Classification | dbSNP RS | HGVSc | HGVSp | HGVSp Short | SWISSPROT | BIOTYPE | SIFT | PolyPhen | Tumor Sample Barcode | Tissue | Histology | Sex | Age | Stage | Therapy Types | Drugs | Outcome |
| TBCB | SNV | Missense_Mutation | novel | c.166N>G | p.Leu56Val | p.L56V | Q99426 | protein_coding | tolerated(0.62) | benign(0.13) | TCGA-C5-A7CK-01 | Cervix | cervical & endocervical cancer | Female | <65 | I/II | Chemotherapy | cisplatin | SD |
| TBCB | SNV | Missense_Mutation | rs374667464 | c.635N>A | p.Arg212His | p.R212H | Q99426 | protein_coding | deleterious(0.04) | probably_damaging(0.921) | TCGA-A6-5665-01 | Colorectum | colon adenocarcinoma | Female | >=65 | I/II | Unknown | Unknown | PD |
| TBCB | SNV | Missense_Mutation | c.193N>G | p.Ser65Gly | p.S65G | Q99426 | protein_coding | tolerated(0.43) | benign(0) | TCGA-AM-5821-01 | Colorectum | colon adenocarcinoma | Female | >=65 | I/II | Unknown | Unknown | SD | |
| TBCB | SNV | Missense_Mutation | novel | c.185A>C | p.Lys62Thr | p.K62T | Q99426 | protein_coding | tolerated(0.05) | benign(0.025) | TCGA-A5-A0G2-01 | Endometrium | uterine corpus endometrioid carcinoma | Female | <65 | III/IV | Unknown | Unknown | SD |
| TBCB | SNV | Missense_Mutation | c.239N>G | p.Asp80Gly | p.D80G | Q99426 | protein_coding | deleterious(0.01) | possibly_damaging(0.652) | TCGA-AP-A051-01 | Endometrium | uterine corpus endometrioid carcinoma | Female | >=65 | I/II | Unknown | Unknown | SD | |
| TBCB | SNV | Missense_Mutation | rs371592763 | c.301N>A | p.Val101Met | p.V101M | Q99426 | protein_coding | tolerated(0.09) | benign(0.028) | TCGA-AP-A051-01 | Endometrium | uterine corpus endometrioid carcinoma | Female | >=65 | I/II | Unknown | Unknown | SD |
| TBCB | SNV | Missense_Mutation | rs750629354 | c.587N>A | p.Arg196His | p.R196H | Q99426 | protein_coding | tolerated(0.08) | benign(0.015) | TCGA-AP-A051-01 | Endometrium | uterine corpus endometrioid carcinoma | Female | >=65 | I/II | Unknown | Unknown | SD |
| TBCB | SNV | Missense_Mutation | c.210N>T | p.Glu70Asp | p.E70D | Q99426 | protein_coding | tolerated(1) | benign(0) | TCGA-AX-A05Z-01 | Endometrium | uterine corpus endometrioid carcinoma | Female | <65 | III/IV | Chemotherapy | adriamycin | SD | |
| TBCB | SNV | Missense_Mutation | novel | c.617N>A | p.Gly206Asp | p.G206D | Q99426 | protein_coding | deleterious(0) | probably_damaging(1) | TCGA-D1-A175-01 | Endometrium | uterine corpus endometrioid carcinoma | Female | <65 | I/II | Chemotherapy | paclitaxel | SD |
| TBCB | SNV | Missense_Mutation | c.643N>A | p.Glu215Lys | p.E215K | Q99426 | protein_coding | deleterious(0.01) | benign(0.288) | TCGA-EO-A22X-01 | Endometrium | uterine corpus endometrioid carcinoma | Female | <65 | III/IV | Unspecific | Carboplatin | Complete Response |
| Page: 1 2 |
Top |
Related drugs of malignant transformation related genes |
| Identification of chemicals and drugs interact with genes involved in malignant transfromation |
| (DGIdb 4.0) |
| Entrez ID | Symbol | Category | Interaction Types | Drug Claim Name | Drug Name | PMIDs |
| Page: 1 |

Copyright 2023-Present -The University of Texas Health Science Center at Houston |