
|
|||||
|
 | |
| |
| |
| |
| |
| |
|
Gene: TBCA |
Gene summary for TBCA |
| Gene information | Species | Human | Gene symbol | TBCA | Gene ID | 6902 |
| Gene name | tubulin folding cofactor A | |
| Gene Alias | TBCA | |
| Cytomap | 5q14.1 | |
| Gene Type | protein-coding | GO ID | GO:0006457 | UniProtAcc | O75347 |
Top |
Malignant transformation analysis |
| Identification of the aberrant gene expression in precancerous and cancerous lesions by comparing the gene expression of stem-like cells in diseased tissues with normal stem cells |
| Entrez ID | Symbol | Replicates | Species | Organ | Tissue | Adj P-value | Log2FC | Malignancy |
| 6902 | TBCA | GSM4909286 | Human | Breast | IDC | 4.59e-21 | -3.92e-01 | 0.1081 |
| 6902 | TBCA | GSM4909288 | Human | Breast | IDC | 1.26e-02 | -1.07e-01 | 0.0988 |
| 6902 | TBCA | GSM4909290 | Human | Breast | IDC | 5.53e-04 | -3.22e-01 | 0.2096 |
| 6902 | TBCA | GSM4909294 | Human | Breast | IDC | 1.05e-07 | 4.28e-03 | 0.2022 |
| 6902 | TBCA | GSM4909296 | Human | Breast | IDC | 1.19e-11 | -6.00e-02 | 0.1524 |
| 6902 | TBCA | GSM4909297 | Human | Breast | IDC | 2.47e-30 | -2.73e-01 | 0.1517 |
| 6902 | TBCA | GSM4909301 | Human | Breast | IDC | 3.25e-05 | -2.79e-01 | 0.1577 |
| 6902 | TBCA | GSM4909302 | Human | Breast | IDC | 2.30e-07 | -3.15e-01 | 0.1545 |
| 6902 | TBCA | GSM4909309 | Human | Breast | IDC | 2.08e-05 | -1.40e-01 | 0.0483 |
| 6902 | TBCA | GSM4909311 | Human | Breast | IDC | 1.02e-56 | -2.98e-03 | 0.1534 |
| 6902 | TBCA | GSM4909312 | Human | Breast | IDC | 2.69e-13 | -1.32e-01 | 0.1552 |
| 6902 | TBCA | GSM4909313 | Human | Breast | IDC | 2.60e-09 | -1.31e-01 | 0.0391 |
| 6902 | TBCA | GSM4909315 | Human | Breast | IDC | 2.91e-04 | -2.83e-01 | 0.21 |
| 6902 | TBCA | GSM4909316 | Human | Breast | IDC | 3.51e-04 | -2.14e-01 | 0.21 |
| 6902 | TBCA | GSM4909318 | Human | Breast | IDC | 6.97e-04 | 1.59e-01 | 0.2031 |
| 6902 | TBCA | GSM4909319 | Human | Breast | IDC | 1.06e-75 | -4.30e-01 | 0.1563 |
| 6902 | TBCA | GSM4909320 | Human | Breast | IDC | 5.36e-12 | -2.44e-01 | 0.1575 |
| 6902 | TBCA | GSM4909321 | Human | Breast | IDC | 2.24e-21 | -7.20e-04 | 0.1559 |
| 6902 | TBCA | brca10 | Human | Breast | Precancer | 3.70e-02 | 1.76e-01 | -0.0029 |
| 6902 | TBCA | M2 | Human | Breast | IDC | 2.37e-05 | -2.32e-01 | 0.21 |
| Page: 1 2 3 4 5 6 7 8 9 10 11 12 13 |
| Tissue | Expression Dynamics | Abbreviation |
| Breast | 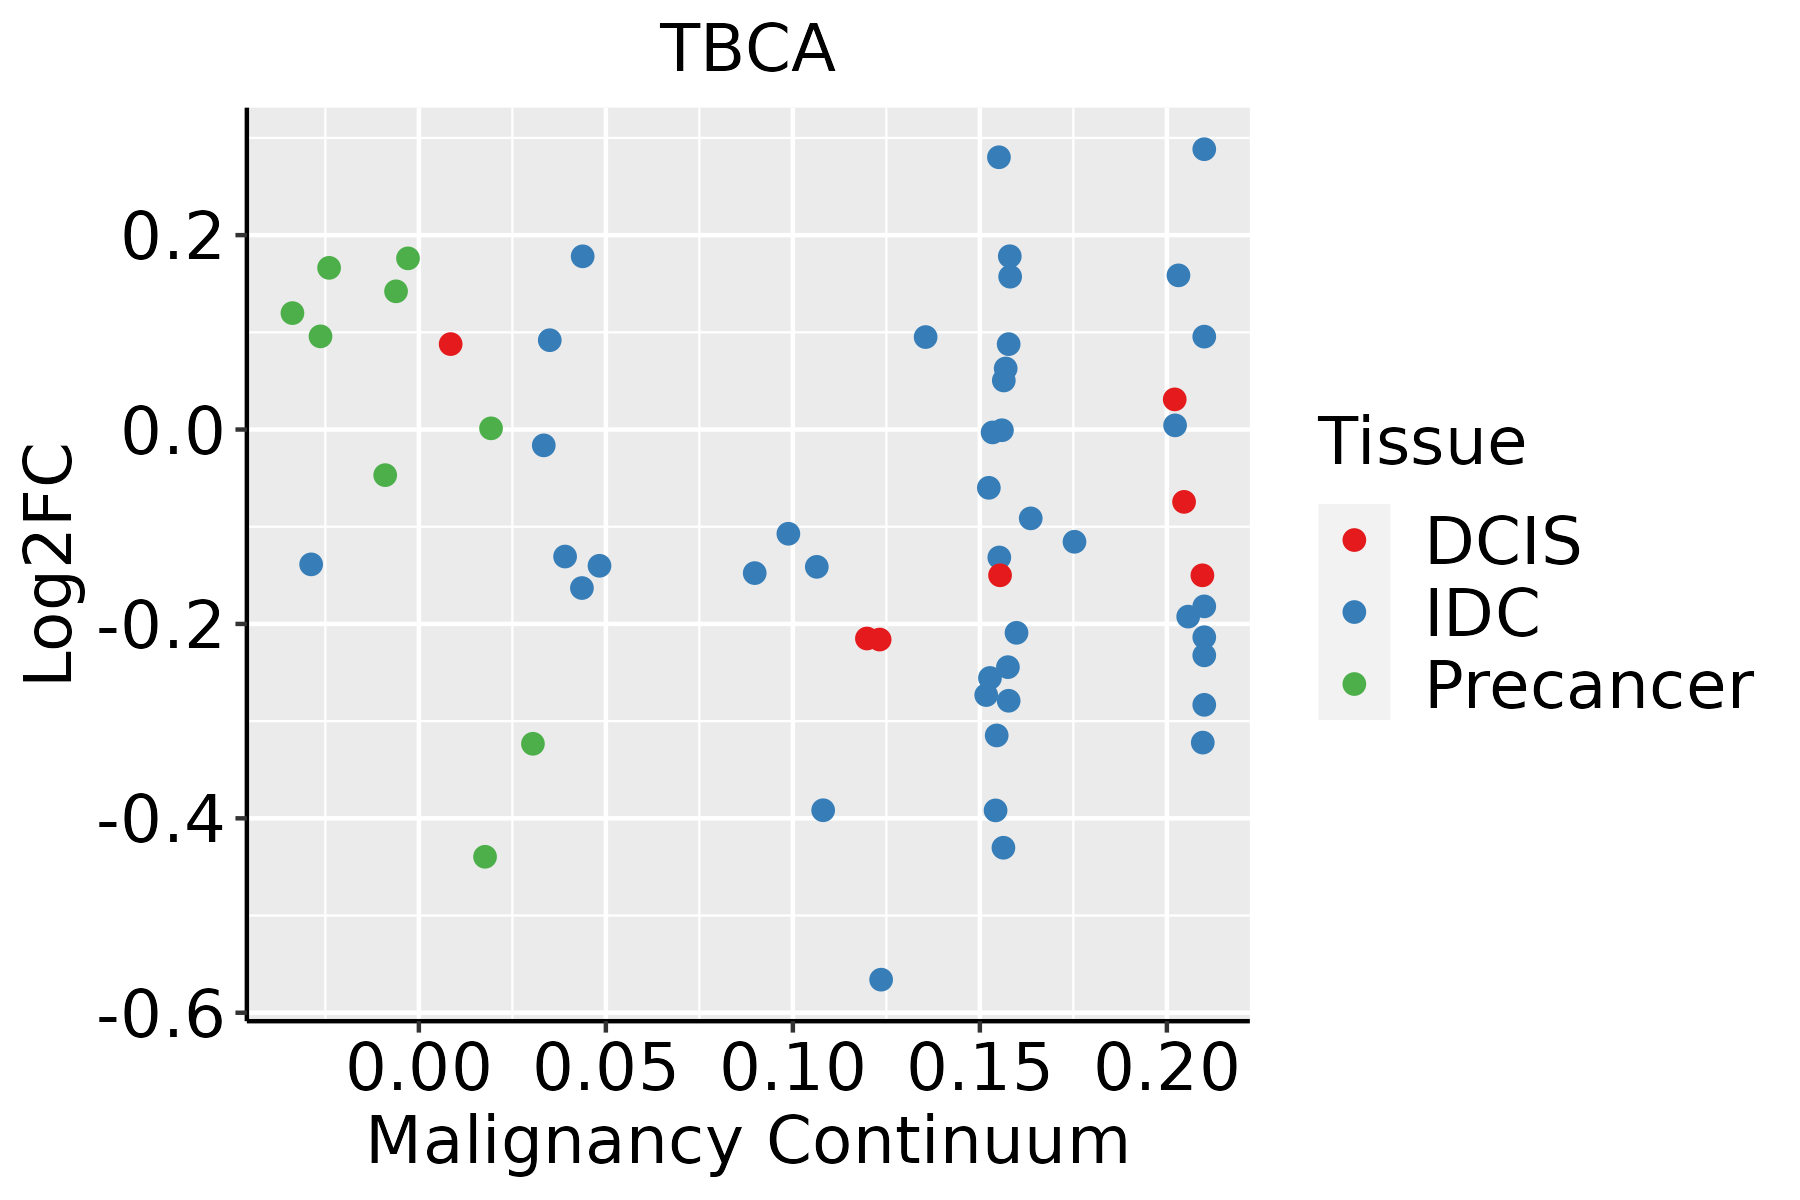 | IDC: Invasive ductal carcinoma |
| DCIS: Ductal carcinoma in situ | ||
| Precancer(BRCA1-mut): Precancerous lesion from BRCA1 mutation carriers | ||
| Colorectum (GSE201348) |  | FAP: Familial adenomatous polyposis |
| CRC: Colorectal cancer | ||
| Colorectum (HTA11) |  | AD: Adenomas |
| SER: Sessile serrated lesions | ||
| MSI-H: Microsatellite-high colorectal cancer | ||
| MSS: Microsatellite stable colorectal cancer | ||
| Endometrium | 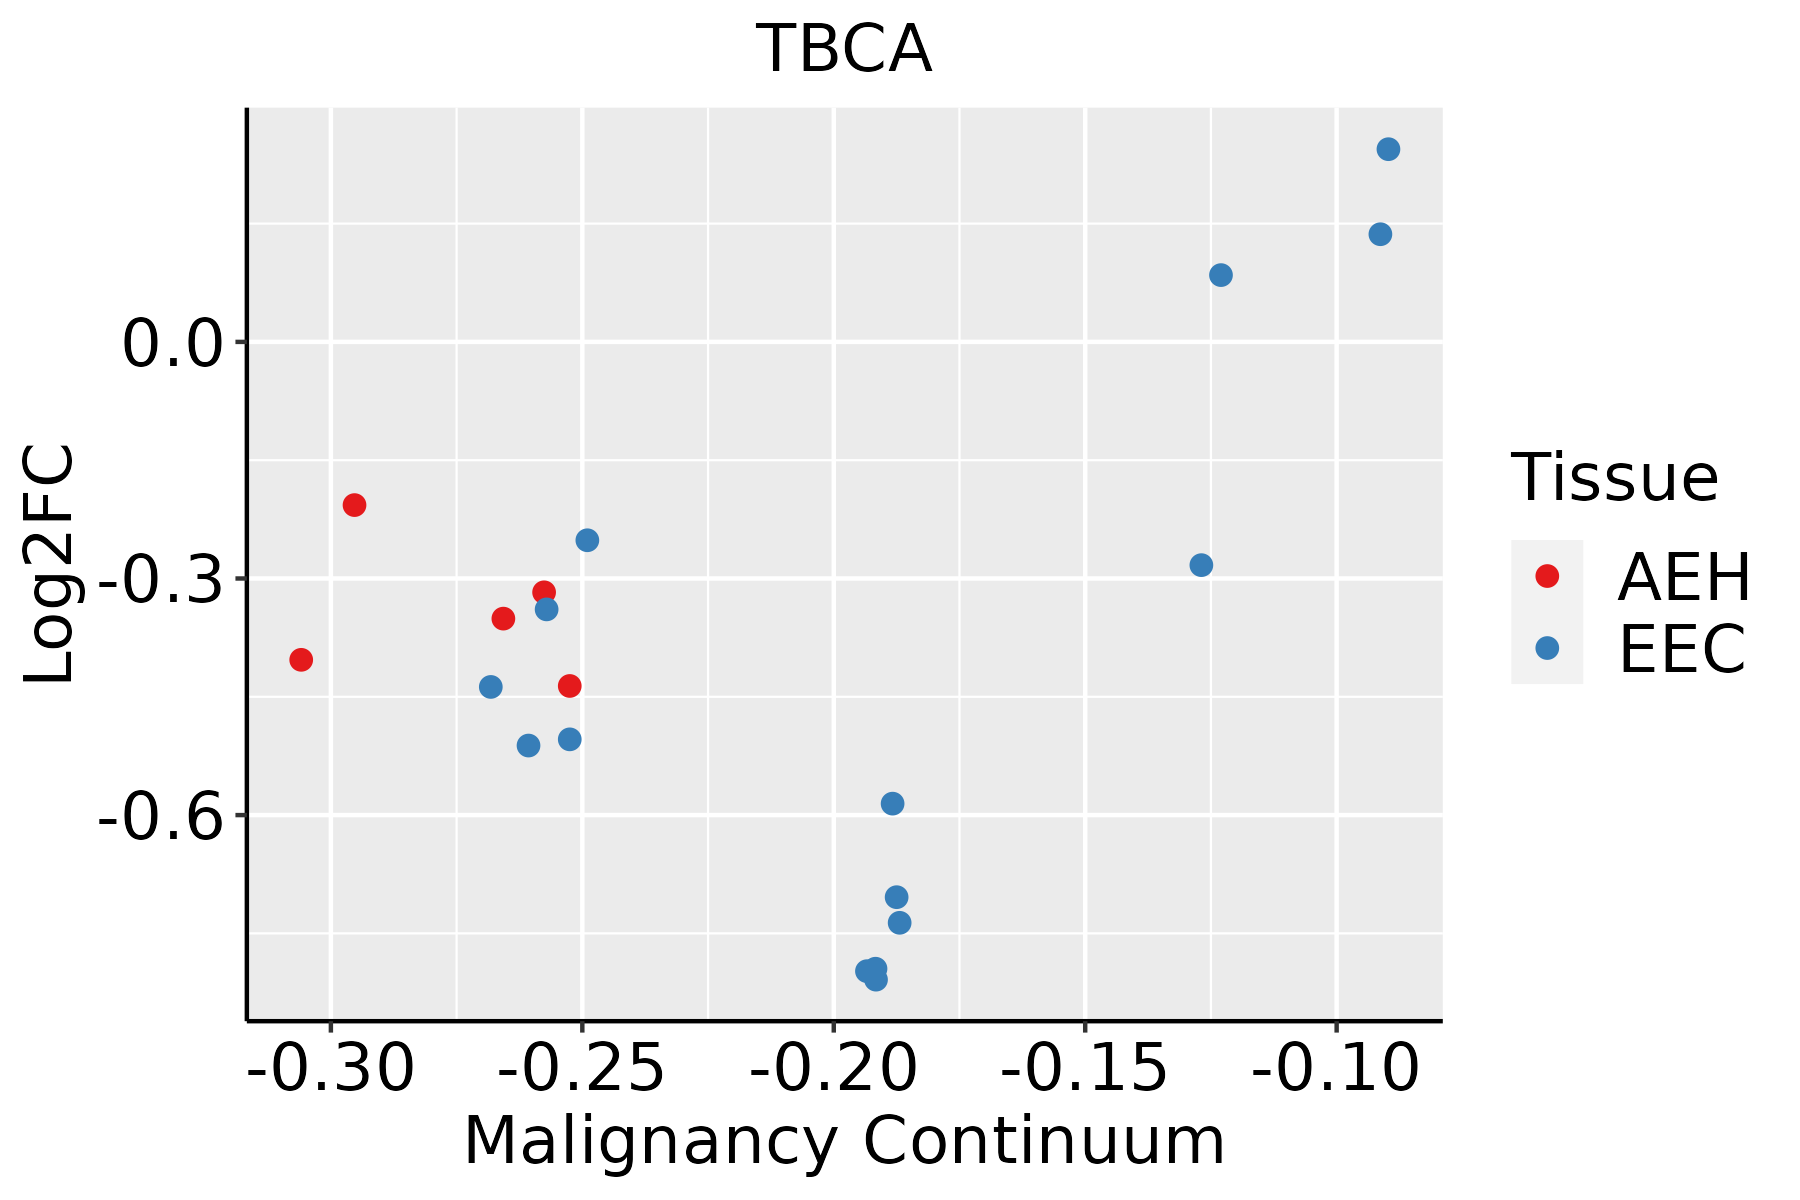 | AEH: Atypical endometrial hyperplasia |
| EEC: Endometrioid Cancer | ||
| Esophagus | 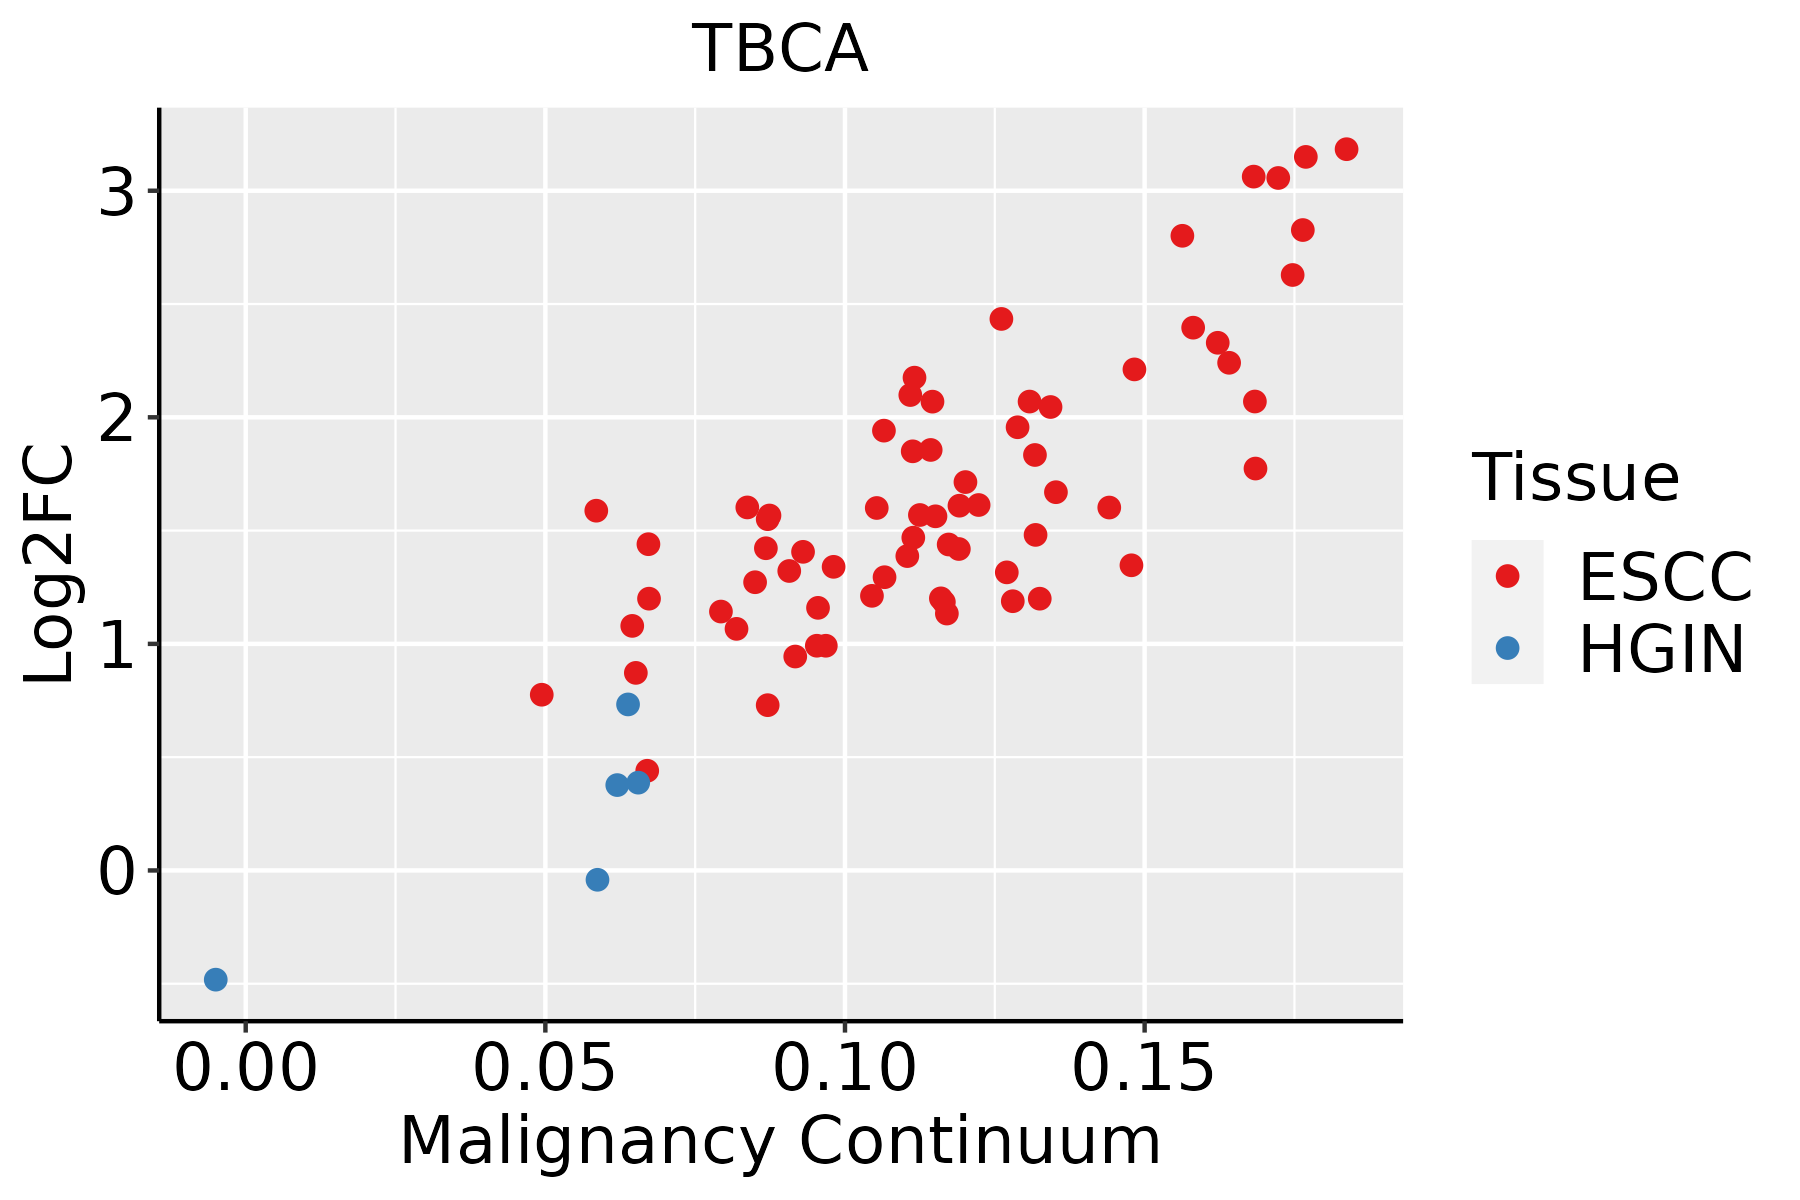 | ESCC: Esophageal squamous cell carcinoma |
| HGIN: High-grade intraepithelial neoplasias | ||
| LGIN: Low-grade intraepithelial neoplasias | ||
| Liver |  | HCC: Hepatocellular carcinoma |
| NAFLD: Non-alcoholic fatty liver disease | ||
| Oral Cavity | 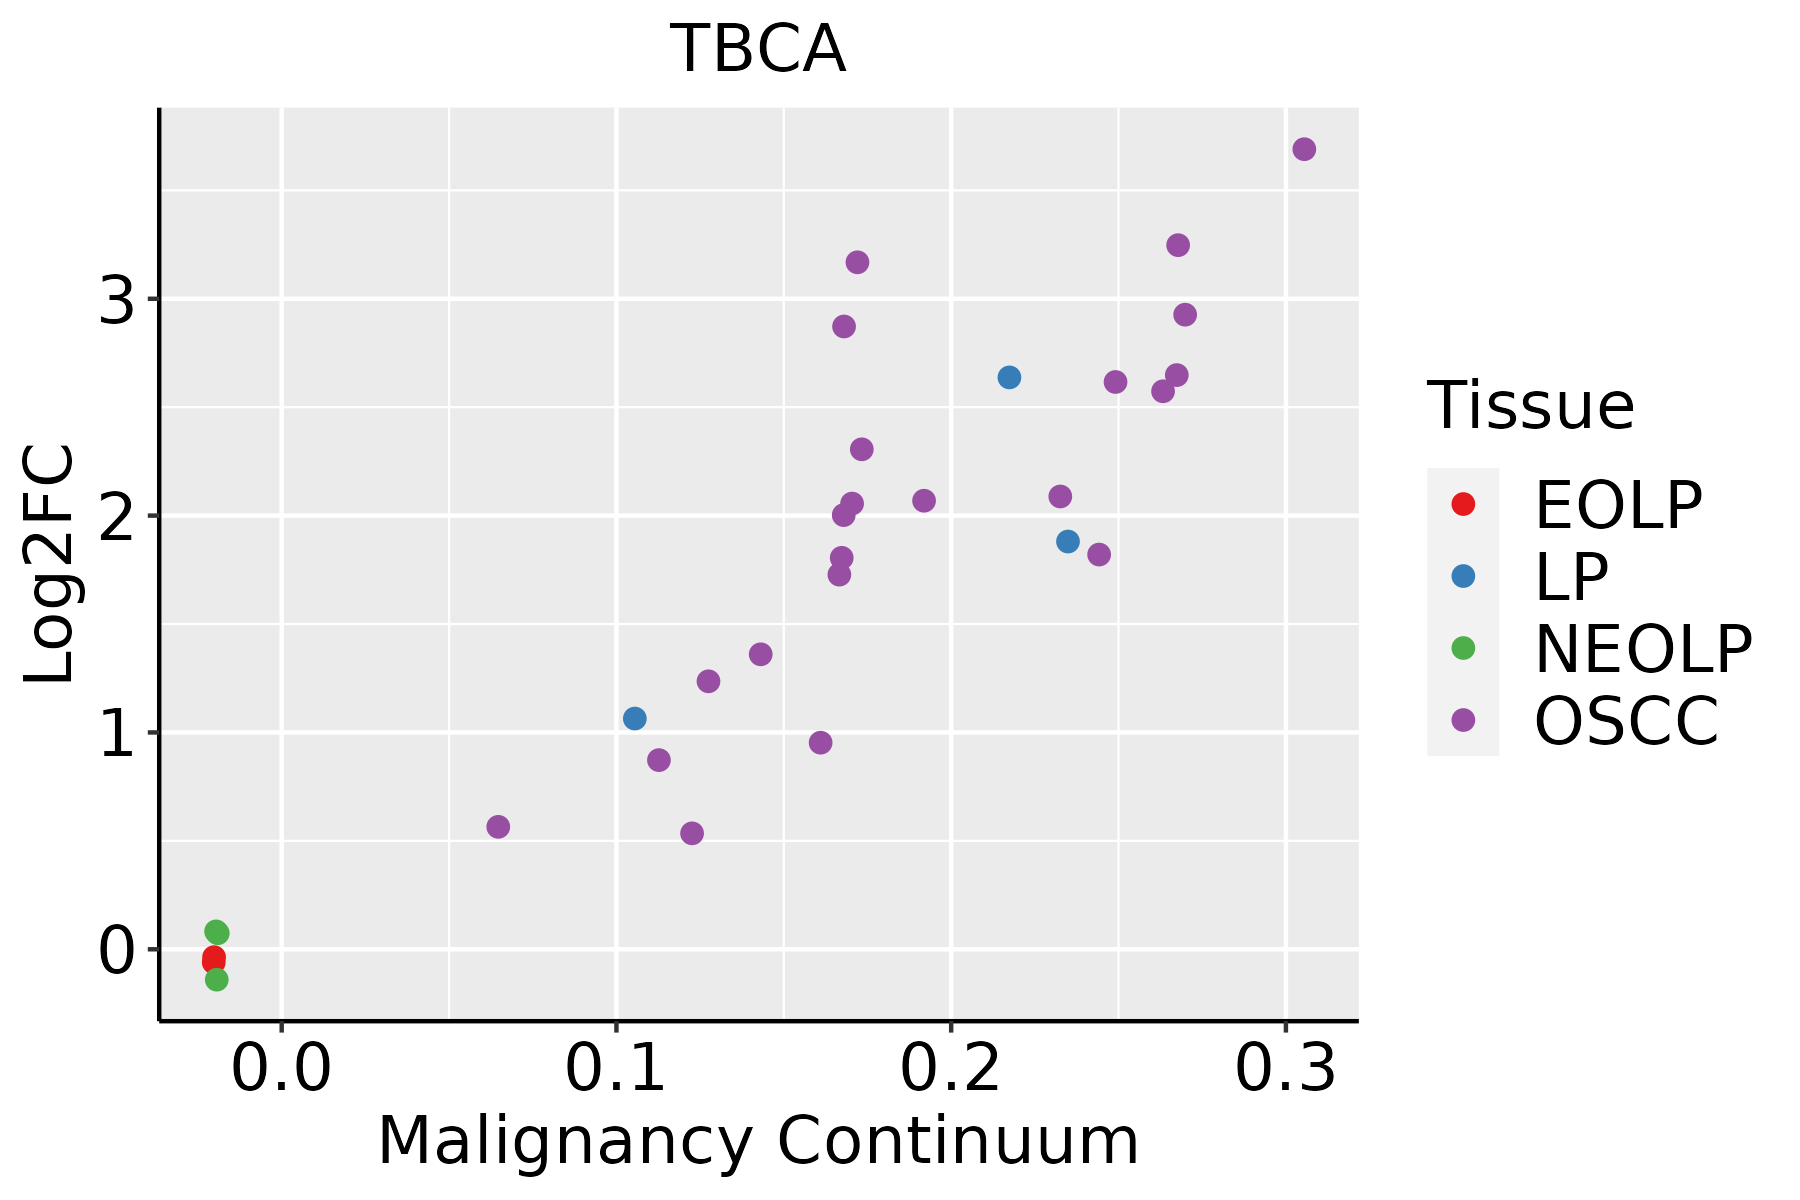 | EOLP: Erosive Oral lichen planus |
| LP: leukoplakia | ||
| NEOLP: Non-erosive oral lichen planus | ||
| OSCC: Oral squamous cell carcinoma | ||
| Prostate | 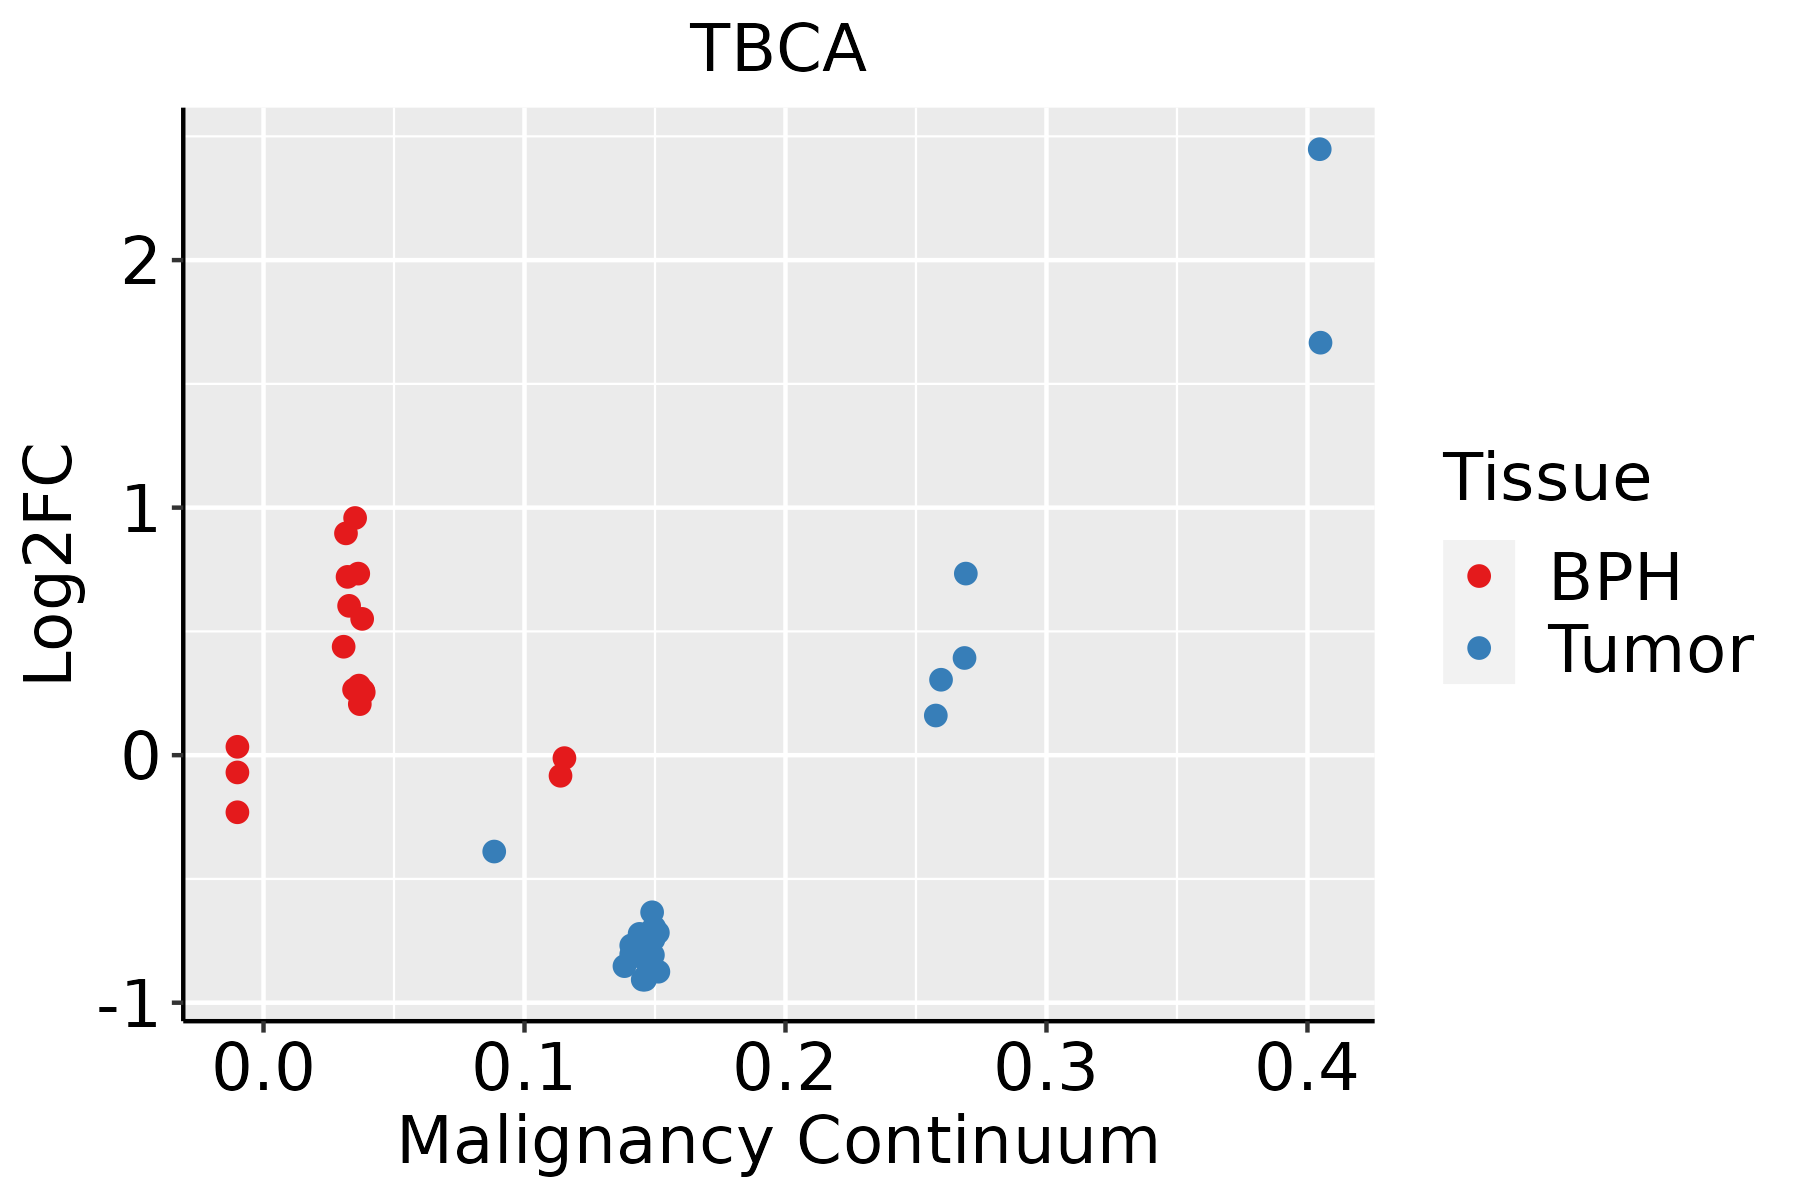 | BPH: Benign Prostatic Hyperplasia |
| Skin |  | AK: Actinic keratosis |
| cSCC: Cutaneous squamous cell carcinoma | ||
| SCCIS:squamous cell carcinoma in situ | ||
| Thyroid |  | ATC: Anaplastic thyroid cancer |
| HT: Hashimoto's thyroiditis | ||
| PTC: Papillary thyroid cancer |
| ∗log2FC in expression of this searched gene in stem-like cells from each diseased tissue sample relative to stem-like cells in normal samples in each tissue plotted against the malignancy continuum. Samples are colored based on if they are from different disease stage. |
Top |
Malignant transformation related pathway analysis |
| Find out the enriched GO biological processes and KEGG pathways involved in transition from healthy to precancer to cancer |
| Tissue | Disease Stage | Enriched GO biological Processes |
| Colorectum | AD |  |
| Colorectum | SER |  |
| Colorectum | MSS |  |
| Colorectum | MSI-H |  |
| Colorectum | FAP |  |
| ∗Top 15 enriched GO BP terms are showed in the bar plot of each disease state in each tissue. Each row represents a significant GO biological process which is colored according to the -log10(p.adjust). |
| Page: 1 2 3 4 5 6 7 8 9 |
| GO ID | Tissue | Disease Stage | Description | Gene Ratio | Bg Ratio | pvalue | p.adjust | Count |
| GO:00064578 | Breast | Precancer | protein folding | 43/1080 | 212/18723 | 3.48e-13 | 7.45e-11 | 43 |
| GO:000645713 | Breast | IDC | protein folding | 47/1434 | 212/18723 | 2.31e-11 | 3.86e-09 | 47 |
| GO:000645723 | Breast | DCIS | protein folding | 47/1390 | 212/18723 | 7.84e-12 | 1.53e-09 | 47 |
| GO:0006457 | Colorectum | AD | protein folding | 73/3918 | 212/18723 | 3.24e-06 | 9.10e-05 | 73 |
| GO:00064572 | Colorectum | MSS | protein folding | 71/3467 | 212/18723 | 1.25e-07 | 5.91e-06 | 71 |
| GO:00064573 | Colorectum | MSI-H | protein folding | 33/1319 | 212/18723 | 1.40e-05 | 6.29e-04 | 33 |
| GO:00064574 | Colorectum | FAP | protein folding | 44/2622 | 212/18723 | 4.36e-03 | 2.98e-02 | 44 |
| GO:000645710 | Endometrium | AEH | protein folding | 61/2100 | 212/18723 | 1.86e-12 | 3.48e-10 | 61 |
| GO:000645715 | Endometrium | EEC | protein folding | 63/2168 | 212/18723 | 6.82e-13 | 1.40e-10 | 63 |
| GO:0006457110 | Esophagus | ESCC | protein folding | 163/8552 | 212/18723 | 1.13e-20 | 1.74e-18 | 163 |
| GO:00064577 | Liver | Cirrhotic | protein folding | 114/4634 | 212/18723 | 9.23e-20 | 2.31e-17 | 114 |
| GO:000645712 | Liver | HCC | protein folding | 160/7958 | 212/18723 | 1.07e-22 | 1.88e-20 | 160 |
| GO:000645722 | Liver | Cyst | protein folding | 18/496 | 212/18723 | 1.48e-05 | 9.59e-04 | 18 |
| GO:000645718 | Oral cavity | OSCC | protein folding | 154/7305 | 212/18723 | 1.89e-23 | 4.60e-21 | 154 |
| GO:000645719 | Oral cavity | LP | protein folding | 125/4623 | 212/18723 | 1.62e-26 | 8.45e-24 | 125 |
| GO:000645716 | Prostate | BPH | protein folding | 85/3107 | 212/18723 | 2.37e-16 | 4.74e-14 | 85 |
| GO:000645717 | Prostate | Tumor | protein folding | 85/3246 | 212/18723 | 3.37e-15 | 5.37e-13 | 85 |
| GO:0006457111 | Skin | cSCC | protein folding | 131/4864 | 212/18723 | 2.96e-28 | 1.32e-25 | 131 |
| GO:000645727 | Thyroid | HT | protein folding | 45/1272 | 212/18723 | 5.29e-12 | 1.01e-09 | 45 |
| GO:0006457112 | Thyroid | PTC | protein folding | 137/5968 | 212/18723 | 8.29e-23 | 2.01e-20 | 137 |
| Page: 1 2 |
| Pathway ID | Tissue | Disease Stage | Description | Gene Ratio | Bg Ratio | pvalue | p.adjust | qvalue | Count |
| Page: 1 |
Top |
Cell-cell communication analysis |
| Identification of potential cell-cell interactions between two cell types and their ligand-receptor pairs for different disease states |
| Ligand | Receptor | LRpair | Pathway | Tissue | Disease Stage |
| Page: 1 |
Top |
Single-cell gene regulatory network inference analysis |
| Find out the significant the regulons (TFs) and the target genes of each regulon across cell types for different disease states |
| TF | Cell Type | Tissue | Disease Stage | Target Gene | RSS | Regulon Activity |
| ∗The dot plots of a searched regulon are shown for all cell subpopulations in each disease state of each tissue based on the regulon specific score inferred using pySCENIC and by calculating the average expression. |
| Page: 1 |
Top |
Somatic mutation of malignant transformation related genes |
| Annotation of somatic variants for genes involved in malignant transformation |
| Hugo Symbol | Variant Class | Variant Classification | dbSNP RS | HGVSc | HGVSp | HGVSp Short | SWISSPROT | BIOTYPE | SIFT | PolyPhen | Tumor Sample Barcode | Tissue | Histology | Sex | Age | Stage | Therapy Types | Drugs | Outcome |
| TBCA | SNV | Missense_Mutation | novel | c.108N>C | p.Lys36Asn | p.K36N | O75347 | protein_coding | deleterious(0.02) | possibly_damaging(0.739) | TCGA-E2-A1LG-01 | Breast | breast invasive carcinoma | Female | <65 | I/II | Chemotherapy | doxorubicin | SD |
| TBCA | SNV | Missense_Mutation | rs770921213 | c.276A>T | p.Lys92Asn | p.K92N | O75347 | protein_coding | deleterious(0.01) | benign(0.001) | TCGA-AA-A022-01 | Colorectum | colon adenocarcinoma | Female | >=65 | I/II | Unknown | Unknown | SD |
| TBCA | SNV | Missense_Mutation | novel | c.322T>G | p.Leu108Val | p.L108V | O75347 | protein_coding | deleterious_low_confidence(0.02) | benign(0.018) | TCGA-AG-A002-01 | Colorectum | rectum adenocarcinoma | Male | <65 | I/II | Unknown | Unknown | SD |
| TBCA | SNV | Missense_Mutation | c.30G>C | p.Lys10Asn | p.K10N | O75347 | protein_coding | deleterious(0.01) | probably_damaging(0.984) | TCGA-F5-6864-01 | Colorectum | rectum adenocarcinoma | Female | >=65 | III/IV | Chemotherapy | 5-fluorouracil | CR | |
| TBCA | deletion | Frame_Shift_Del | novel | c.69delA | p.Val24Ter | p.V24* | O75347 | protein_coding | TCGA-AA-3845-01 | Colorectum | colon adenocarcinoma | Female | >=65 | I/II | Unknown | Unknown | PD | ||
| TBCA | deletion | Frame_Shift_Del | novel | c.118delN | p.Met40Ter | p.M40* | O75347 | protein_coding | TCGA-AA-3947-01 | Colorectum | colon adenocarcinoma | Female | <65 | I/II | Unknown | Unknown | SD | ||
| TBCA | SNV | Missense_Mutation | novel | c.332N>T | p.Arg111Ile | p.R111I | O75347 | protein_coding | deleterious_low_confidence(0) | benign(0.011) | TCGA-A5-A2K5-01 | Endometrium | uterine corpus endometrioid carcinoma | Female | >=65 | I/II | Unknown | Unknown | SD |
| TBCA | SNV | Missense_Mutation | novel | c.358A>G | p.Thr120Ala | p.T120A | O75347 | protein_coding | deleterious_low_confidence(0) | benign(0) | TCGA-AJ-A3EK-01 | Endometrium | uterine corpus endometrioid carcinoma | Female | <65 | I/II | Chemotherapy | carboplatin | CR |
| TBCA | SNV | Missense_Mutation | novel | c.374N>A | p.Arg125His | p.R125H | O75347 | protein_coding | tolerated_low_confidence(0.15) | benign(0) | TCGA-AP-A1DV-01 | Endometrium | uterine corpus endometrioid carcinoma | Female | <65 | I/II | Unknown | Unknown | SD |
| TBCA | SNV | Missense_Mutation | novel | c.108N>T | p.Lys36Asn | p.K36N | O75347 | protein_coding | deleterious(0.02) | possibly_damaging(0.739) | TCGA-AX-A05Z-01 | Endometrium | uterine corpus endometrioid carcinoma | Female | <65 | III/IV | Chemotherapy | adriamycin | SD |
| Page: 1 2 |
Top |
Related drugs of malignant transformation related genes |
| Identification of chemicals and drugs interact with genes involved in malignant transfromation |
| (DGIdb 4.0) |
| Entrez ID | Symbol | Category | Interaction Types | Drug Claim Name | Drug Name | PMIDs |
| Page: 1 |

Copyright 2023-Present -The University of Texas Health Science Center at Houston |