
|
|||||
|
 | |
| |
| |
| |
| |
| |
|
Gene: TBC1D9 |
Gene summary for TBC1D9 |
| Gene information | Species | Human | Gene symbol | TBC1D9 | Gene ID | 23158 |
| Gene name | TBC1 domain family member 9 | |
| Gene Alias | GRAMD9 | |
| Cytomap | 4q31.21 | |
| Gene Type | protein-coding | GO ID | GO:0006810 | UniProtAcc | Q6ZT07 |
Top |
Malignant transformation analysis |
| Identification of the aberrant gene expression in precancerous and cancerous lesions by comparing the gene expression of stem-like cells in diseased tissues with normal stem cells |
| Entrez ID | Symbol | Replicates | Species | Organ | Tissue | Adj P-value | Log2FC | Malignancy |
| 23158 | TBC1D9 | GSM4909282 | Human | Breast | IDC | 2.82e-02 | -2.13e-01 | -0.0288 |
| 23158 | TBC1D9 | GSM4909285 | Human | Breast | IDC | 2.91e-07 | -2.43e-01 | 0.21 |
| 23158 | TBC1D9 | GSM4909291 | Human | Breast | IDC | 6.41e-15 | 6.05e-01 | 0.1753 |
| 23158 | TBC1D9 | GSM4909293 | Human | Breast | IDC | 1.26e-06 | 2.41e-01 | 0.1581 |
| 23158 | TBC1D9 | GSM4909297 | Human | Breast | IDC | 8.69e-03 | 1.79e-01 | 0.1517 |
| 23158 | TBC1D9 | GSM4909298 | Human | Breast | IDC | 4.97e-26 | 5.64e-01 | 0.1551 |
| 23158 | TBC1D9 | GSM4909301 | Human | Breast | IDC | 1.15e-17 | 6.00e-01 | 0.1577 |
| 23158 | TBC1D9 | GSM4909302 | Human | Breast | IDC | 8.76e-17 | 5.82e-01 | 0.1545 |
| 23158 | TBC1D9 | GSM4909303 | Human | Breast | IDC | 1.90e-02 | 4.27e-01 | 0.0438 |
| 23158 | TBC1D9 | GSM4909304 | Human | Breast | IDC | 6.53e-15 | 4.25e-01 | 0.1636 |
| 23158 | TBC1D9 | GSM4909306 | Human | Breast | IDC | 1.48e-42 | 8.22e-01 | 0.1564 |
| 23158 | TBC1D9 | GSM4909307 | Human | Breast | IDC | 4.13e-03 | 2.71e-01 | 0.1569 |
| 23158 | TBC1D9 | GSM4909308 | Human | Breast | IDC | 1.48e-07 | 3.15e-01 | 0.158 |
| 23158 | TBC1D9 | GSM4909311 | Human | Breast | IDC | 2.18e-07 | -3.90e-02 | 0.1534 |
| 23158 | TBC1D9 | GSM4909313 | Human | Breast | IDC | 2.51e-02 | 2.69e-01 | 0.0391 |
| 23158 | TBC1D9 | GSM4909319 | Human | Breast | IDC | 9.11e-15 | 2.87e-03 | 0.1563 |
| 23158 | TBC1D9 | GSM4909321 | Human | Breast | IDC | 4.49e-03 | 1.71e-01 | 0.1559 |
| 23158 | TBC1D9 | brca1 | Human | Breast | Precancer | 2.09e-04 | -2.32e-01 | -0.0338 |
| 23158 | TBC1D9 | M1 | Human | Breast | IDC | 1.99e-21 | 6.94e-01 | 0.1577 |
| 23158 | TBC1D9 | M5 | Human | Breast | IDC | 1.87e-07 | 7.70e-01 | 0.1598 |
| Page: 1 2 |
| Tissue | Expression Dynamics | Abbreviation |
| Breast | 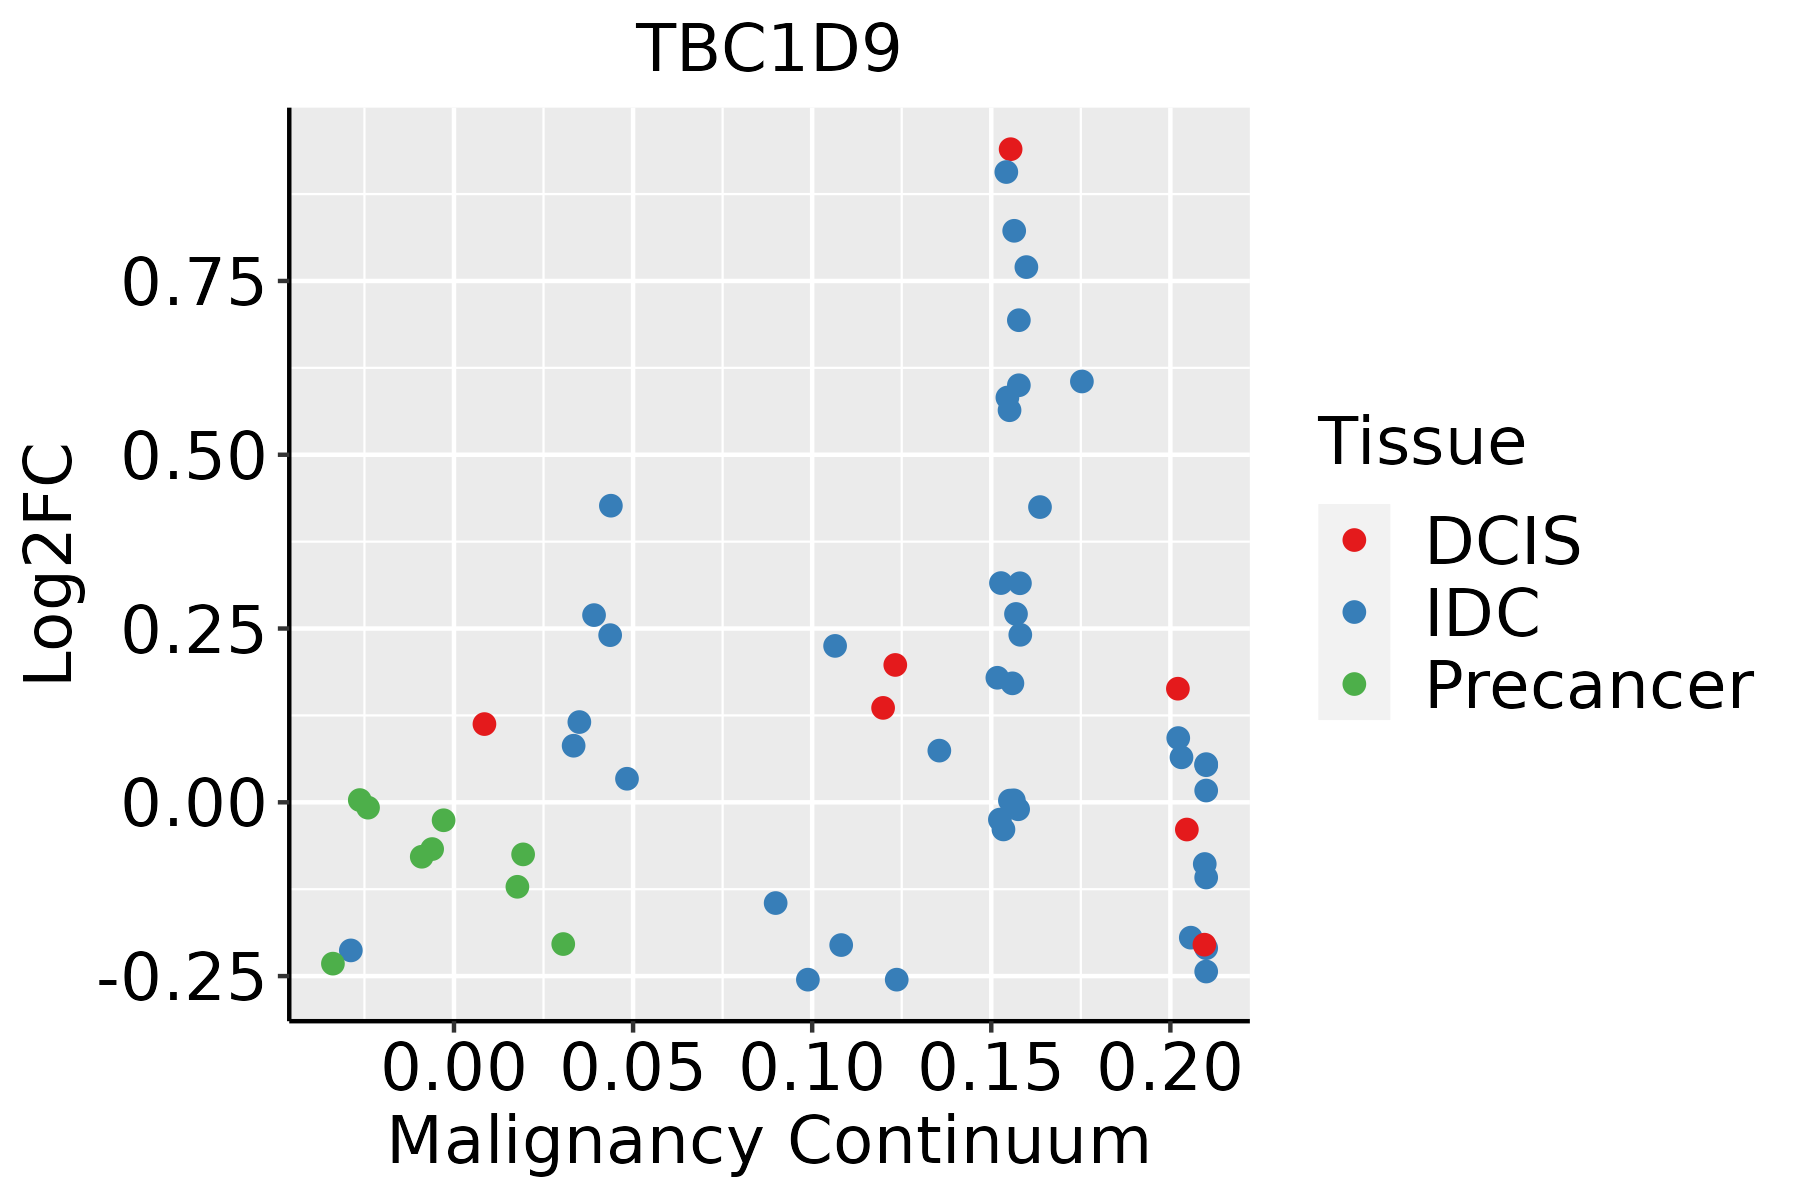 | IDC: Invasive ductal carcinoma |
| DCIS: Ductal carcinoma in situ | ||
| Precancer(BRCA1-mut): Precancerous lesion from BRCA1 mutation carriers |
| ∗log2FC in expression of this searched gene in stem-like cells from each diseased tissue sample relative to stem-like cells in normal samples in each tissue plotted against the malignancy continuum. Samples are colored based on if they are from different disease stage. |
Top |
Malignant transformation related pathway analysis |
| Find out the enriched GO biological processes and KEGG pathways involved in transition from healthy to precancer to cancer |
| Tissue | Disease Stage | Enriched GO biological Processes |
| Colorectum | AD |  |
| Colorectum | SER |  |
| Colorectum | MSS |  |
| Colorectum | MSI-H |  |
| Colorectum | FAP |  |
| ∗Top 15 enriched GO BP terms are showed in the bar plot of each disease state in each tissue. Each row represents a significant GO biological process which is colored according to the -log10(p.adjust). |
| Page: 1 2 3 4 5 6 7 8 9 |
| GO ID | Tissue | Disease Stage | Description | Gene Ratio | Bg Ratio | pvalue | p.adjust | Count |
| GO:004308715 | Esophagus | ESCC | regulation of GTPase activity | 183/8552 | 348/18723 | 5.34e-03 | 2.00e-02 | 183 |
| GO:004308710 | Oral cavity | OSCC | regulation of GTPase activity | 165/7305 | 348/18723 | 7.94e-04 | 4.27e-03 | 165 |
| GO:004308713 | Prostate | Tumor | regulation of GTPase activity | 88/3246 | 348/18723 | 1.04e-04 | 1.00e-03 | 88 |
| GO:004354713 | Prostate | Tumor | positive regulation of GTPase activity | 60/3246 | 255/18723 | 6.87e-03 | 3.11e-02 | 60 |
| GO:004308718 | Thyroid | PTC | regulation of GTPase activity | 148/5968 | 348/18723 | 1.63e-05 | 1.71e-04 | 148 |
| GO:004354714 | Thyroid | PTC | positive regulation of GTPase activity | 103/5968 | 255/18723 | 2.38e-03 | 1.25e-02 | 103 |
| GO:004308719 | Thyroid | ATC | regulation of GTPase activity | 153/6293 | 348/18723 | 3.24e-05 | 2.68e-04 | 153 |
| GO:004354715 | Thyroid | ATC | positive regulation of GTPase activity | 106/6293 | 255/18723 | 4.58e-03 | 1.89e-02 | 106 |
| Page: 1 |
| Pathway ID | Tissue | Disease Stage | Description | Gene Ratio | Bg Ratio | pvalue | p.adjust | qvalue | Count |
| Page: 1 |
Top |
Cell-cell communication analysis |
| Identification of potential cell-cell interactions between two cell types and their ligand-receptor pairs for different disease states |
| Ligand | Receptor | LRpair | Pathway | Tissue | Disease Stage |
| Page: 1 |
Top |
Single-cell gene regulatory network inference analysis |
| Find out the significant the regulons (TFs) and the target genes of each regulon across cell types for different disease states |
| TF | Cell Type | Tissue | Disease Stage | Target Gene | RSS | Regulon Activity |
| ∗The dot plots of a searched regulon are shown for all cell subpopulations in each disease state of each tissue based on the regulon specific score inferred using pySCENIC and by calculating the average expression. |
| Page: 1 |
Top |
Somatic mutation of malignant transformation related genes |
| Annotation of somatic variants for genes involved in malignant transformation |
| Hugo Symbol | Variant Class | Variant Classification | dbSNP RS | HGVSc | HGVSp | HGVSp Short | SWISSPROT | BIOTYPE | SIFT | PolyPhen | Tumor Sample Barcode | Tissue | Histology | Sex | Age | Stage | Therapy Types | Drugs | Outcome |
| TBC1D9 | SNV | Missense_Mutation | c.1420N>C | p.Glu474Gln | p.E474Q | Q6ZT07 | protein_coding | tolerated(0.19) | benign(0.333) | TCGA-5L-AAT1-01 | Breast | breast invasive carcinoma | Female | <65 | III/IV | Hormone Therapy | letrozol | SD | |
| TBC1D9 | SNV | Missense_Mutation | rs777765891 | c.3571N>T | p.Arg1191Trp | p.R1191W | Q6ZT07 | protein_coding | deleterious_low_confidence(0.04) | possibly_damaging(0.586) | TCGA-A8-A09Q-01 | Breast | breast invasive carcinoma | Female | >=65 | III/IV | Hormone Therapy | anastrozole | SD |
| TBC1D9 | SNV | Missense_Mutation | rs779107678 | c.3697N>A | p.Pro1233Thr | p.P1233T | Q6ZT07 | protein_coding | tolerated_low_confidence(0.09) | benign(0.041) | TCGA-AC-A3QP-01 | Breast | breast invasive carcinoma | Female | >=65 | I/II | Hormone Therapy | femara | SD |
| TBC1D9 | SNV | Missense_Mutation | c.569C>A | p.Ser190Tyr | p.S190Y | Q6ZT07 | protein_coding | deleterious(0) | probably_damaging(1) | TCGA-AN-A046-01 | Breast | breast invasive carcinoma | Female | >=65 | I/II | Unknown | Unknown | SD | |
| TBC1D9 | SNV | Missense_Mutation | novel | c.2933N>A | p.Ala978Glu | p.A978E | Q6ZT07 | protein_coding | tolerated(0.77) | benign(0) | TCGA-UU-A93S-01 | Breast | breast invasive carcinoma | Female | <65 | III/IV | Unknown | Unknown | PD |
| TBC1D9 | deletion | Frame_Shift_Del | novel | c.1620delN | p.Tyr541ThrfsTer5 | p.Y541Tfs*5 | Q6ZT07 | protein_coding | TCGA-D8-A27V-01 | Breast | breast invasive carcinoma | Female | <65 | I/II | Hormone Therapy | tamoxiphen | SD | ||
| TBC1D9 | SNV | Missense_Mutation | novel | c.2837C>T | p.Pro946Leu | p.P946L | Q6ZT07 | protein_coding | tolerated(0.06) | benign(0.017) | TCGA-2W-A8YY-01 | Cervix | cervical & endocervical cancer | Female | <65 | I/II | Chemotherapy | cisplatin | CR |
| TBC1D9 | SNV | Missense_Mutation | novel | c.1231G>A | p.Glu411Lys | p.E411K | Q6ZT07 | protein_coding | tolerated(0.6) | benign(0.003) | TCGA-2W-A8YY-01 | Cervix | cervical & endocervical cancer | Female | <65 | I/II | Chemotherapy | cisplatin | CR |
| TBC1D9 | SNV | Missense_Mutation | novel | c.2305N>C | p.Asp769His | p.D769H | Q6ZT07 | protein_coding | deleterious(0.02) | probably_damaging(0.971) | TCGA-C5-A2LZ-01 | Cervix | cervical & endocervical cancer | Female | >=65 | III/IV | Unknown | Unknown | PD |
| TBC1D9 | SNV | Missense_Mutation | c.3716G>A | p.Arg1239Lys | p.R1239K | Q6ZT07 | protein_coding | tolerated_low_confidence(1) | benign(0.001) | TCGA-EK-A2RA-01 | Cervix | cervical & endocervical cancer | Female | >=65 | I/II | Unknown | Unknown | SD |
| Page: 1 2 3 4 5 6 7 8 9 10 11 12 13 14 15 |
Top |
Related drugs of malignant transformation related genes |
| Identification of chemicals and drugs interact with genes involved in malignant transfromation |
| (DGIdb 4.0) |
| Entrez ID | Symbol | Category | Interaction Types | Drug Claim Name | Drug Name | PMIDs |
| Page: 1 |

Copyright 2023-Present -The University of Texas Health Science Center at Houston |