
|
|||||
|
 | |
| |
| |
| |
| |
| |
|
Gene: TBC1D8 |
Gene summary for TBC1D8 |
| Gene information | Species | Human | Gene symbol | TBC1D8 | Gene ID | 11138 |
| Gene name | TBC1 domain family member 8 | |
| Gene Alias | AD3 | |
| Cytomap | 2q11.2 | |
| Gene Type | protein-coding | GO ID | GO:0003008 | UniProtAcc | O95759 |
Top |
Malignant transformation analysis |
| Identification of the aberrant gene expression in precancerous and cancerous lesions by comparing the gene expression of stem-like cells in diseased tissues with normal stem cells |
| Entrez ID | Symbol | Replicates | Species | Organ | Tissue | Adj P-value | Log2FC | Malignancy |
| 11138 | TBC1D8 | HSIL_HPV_2 | Human | Cervix | HSIL_HPV | 4.70e-02 | 1.11e-01 | 0.0208 |
| 11138 | TBC1D8 | CCI_1 | Human | Cervix | CC | 2.30e-15 | 9.78e-01 | 0.528 |
| 11138 | TBC1D8 | CCI_2 | Human | Cervix | CC | 5.22e-18 | 1.49e+00 | 0.5249 |
| 11138 | TBC1D8 | CCI_3 | Human | Cervix | CC | 7.97e-25 | 1.15e+00 | 0.516 |
| 11138 | TBC1D8 | AEH-subject1 | Human | Endometrium | AEH | 2.68e-30 | 6.42e-01 | -0.3059 |
| 11138 | TBC1D8 | AEH-subject2 | Human | Endometrium | AEH | 3.07e-18 | 5.43e-01 | -0.2525 |
| 11138 | TBC1D8 | AEH-subject3 | Human | Endometrium | AEH | 2.44e-10 | 4.00e-01 | -0.2576 |
| 11138 | TBC1D8 | AEH-subject4 | Human | Endometrium | AEH | 1.20e-23 | 7.15e-01 | -0.2657 |
| 11138 | TBC1D8 | AEH-subject5 | Human | Endometrium | AEH | 2.62e-65 | 1.20e+00 | -0.2953 |
| 11138 | TBC1D8 | EEC-subject1 | Human | Endometrium | EEC | 4.62e-20 | 5.68e-01 | -0.2682 |
| 11138 | TBC1D8 | EEC-subject2 | Human | Endometrium | EEC | 2.77e-28 | 6.43e-01 | -0.2607 |
| 11138 | TBC1D8 | EEC-subject3 | Human | Endometrium | EEC | 4.43e-08 | 4.33e-01 | -0.2525 |
| 11138 | TBC1D8 | EEC-subject4 | Human | Endometrium | EEC | 1.54e-14 | 5.43e-01 | -0.2571 |
| 11138 | TBC1D8 | EEC-subject5 | Human | Endometrium | EEC | 5.43e-20 | 5.48e-01 | -0.249 |
| 11138 | TBC1D8 | LZE4T | Human | Esophagus | ESCC | 3.32e-03 | 1.40e-01 | 0.0811 |
| 11138 | TBC1D8 | LZE20T | Human | Esophagus | ESCC | 1.20e-05 | 1.75e-01 | 0.0662 |
| 11138 | TBC1D8 | LZE21D1 | Human | Esophagus | HGIN | 2.48e-05 | 4.14e-01 | 0.0632 |
| 11138 | TBC1D8 | LZE22T | Human | Esophagus | ESCC | 2.42e-09 | 4.79e-01 | 0.068 |
| 11138 | TBC1D8 | LZE24T | Human | Esophagus | ESCC | 7.40e-25 | 5.91e-01 | 0.0596 |
| 11138 | TBC1D8 | LZE21T | Human | Esophagus | ESCC | 1.54e-05 | 2.88e-01 | 0.0655 |
| Page: 1 2 3 4 5 6 |
| Tissue | Expression Dynamics | Abbreviation |
| Cervix |  | CC: Cervix cancer |
| HSIL_HPV: HPV-infected high-grade squamous intraepithelial lesions | ||
| N_HPV: HPV-infected normal cervix | ||
| Endometrium | 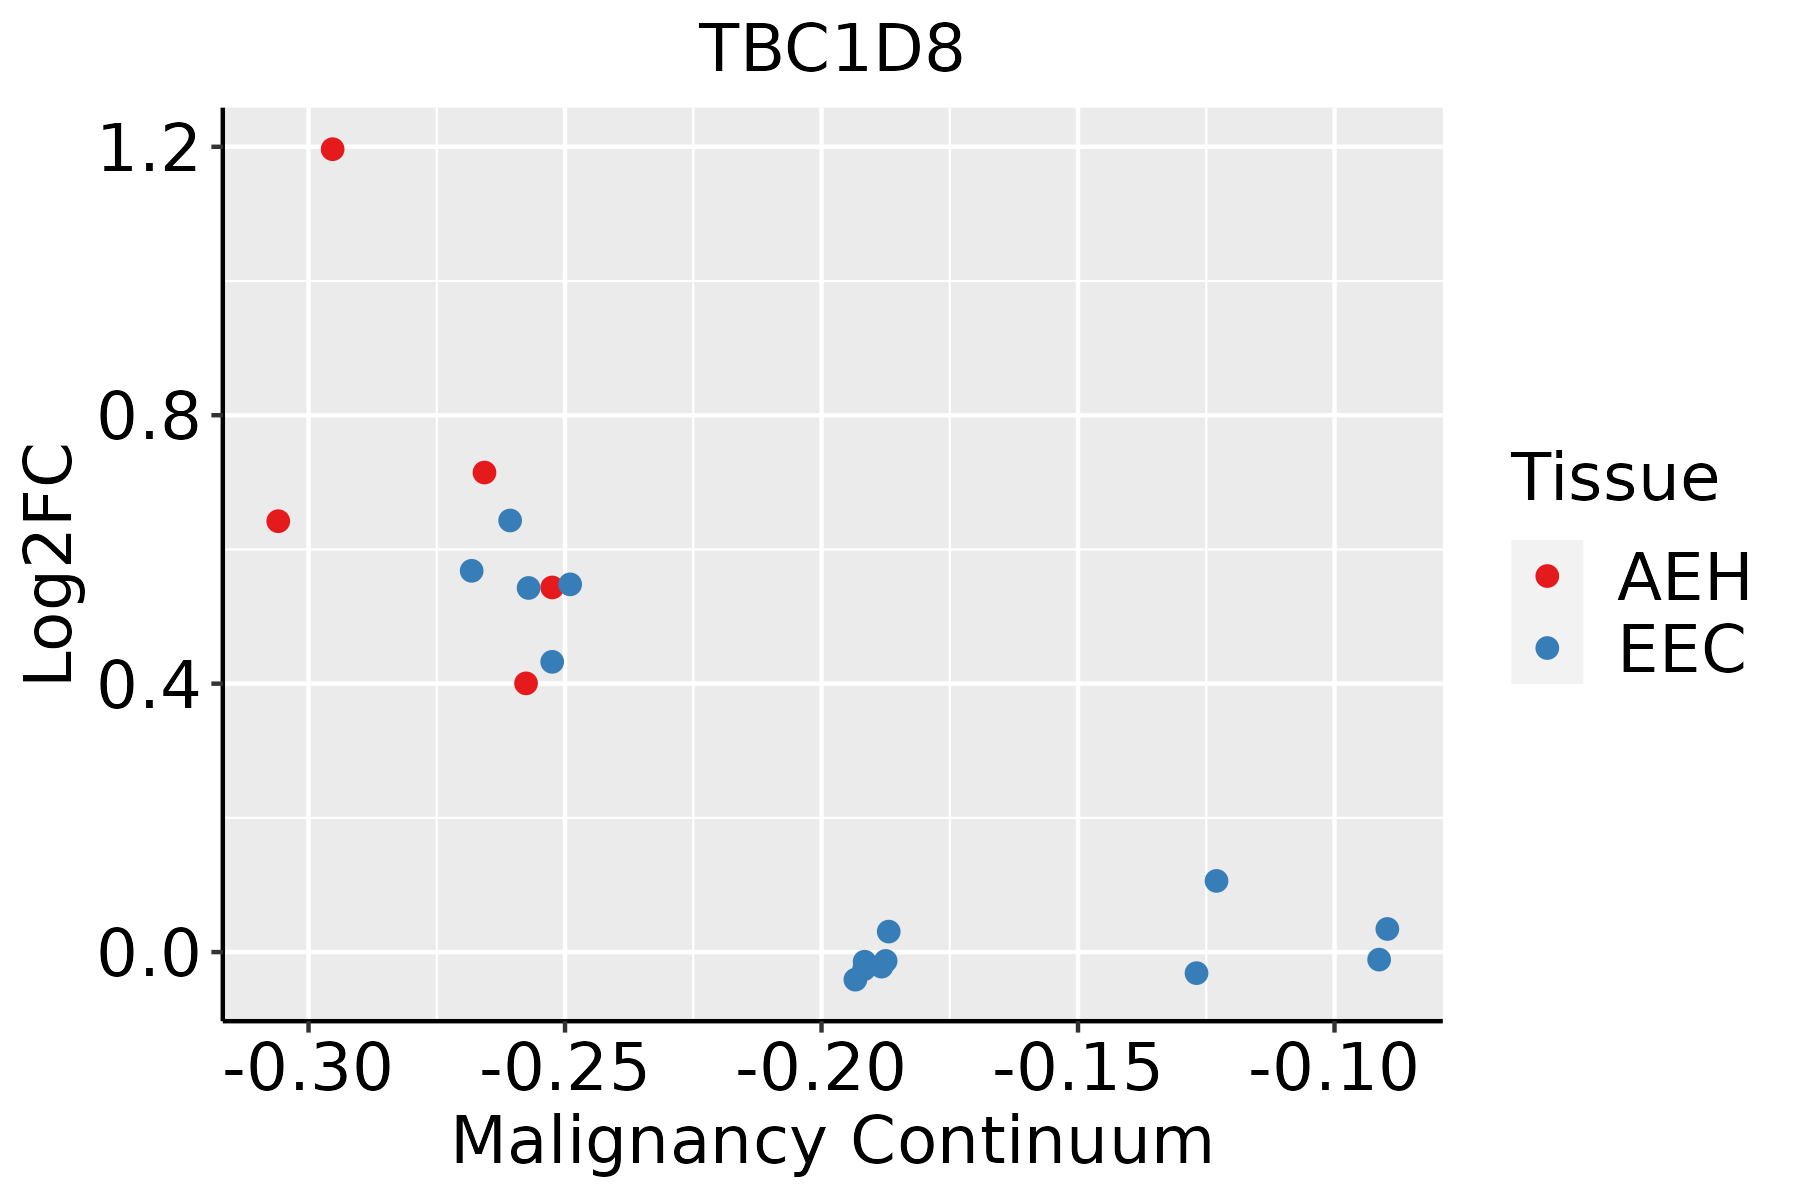 | AEH: Atypical endometrial hyperplasia |
| EEC: Endometrioid Cancer | ||
| Esophagus |  | ESCC: Esophageal squamous cell carcinoma |
| HGIN: High-grade intraepithelial neoplasias | ||
| LGIN: Low-grade intraepithelial neoplasias | ||
| Liver |  | HCC: Hepatocellular carcinoma |
| NAFLD: Non-alcoholic fatty liver disease | ||
| Prostate | 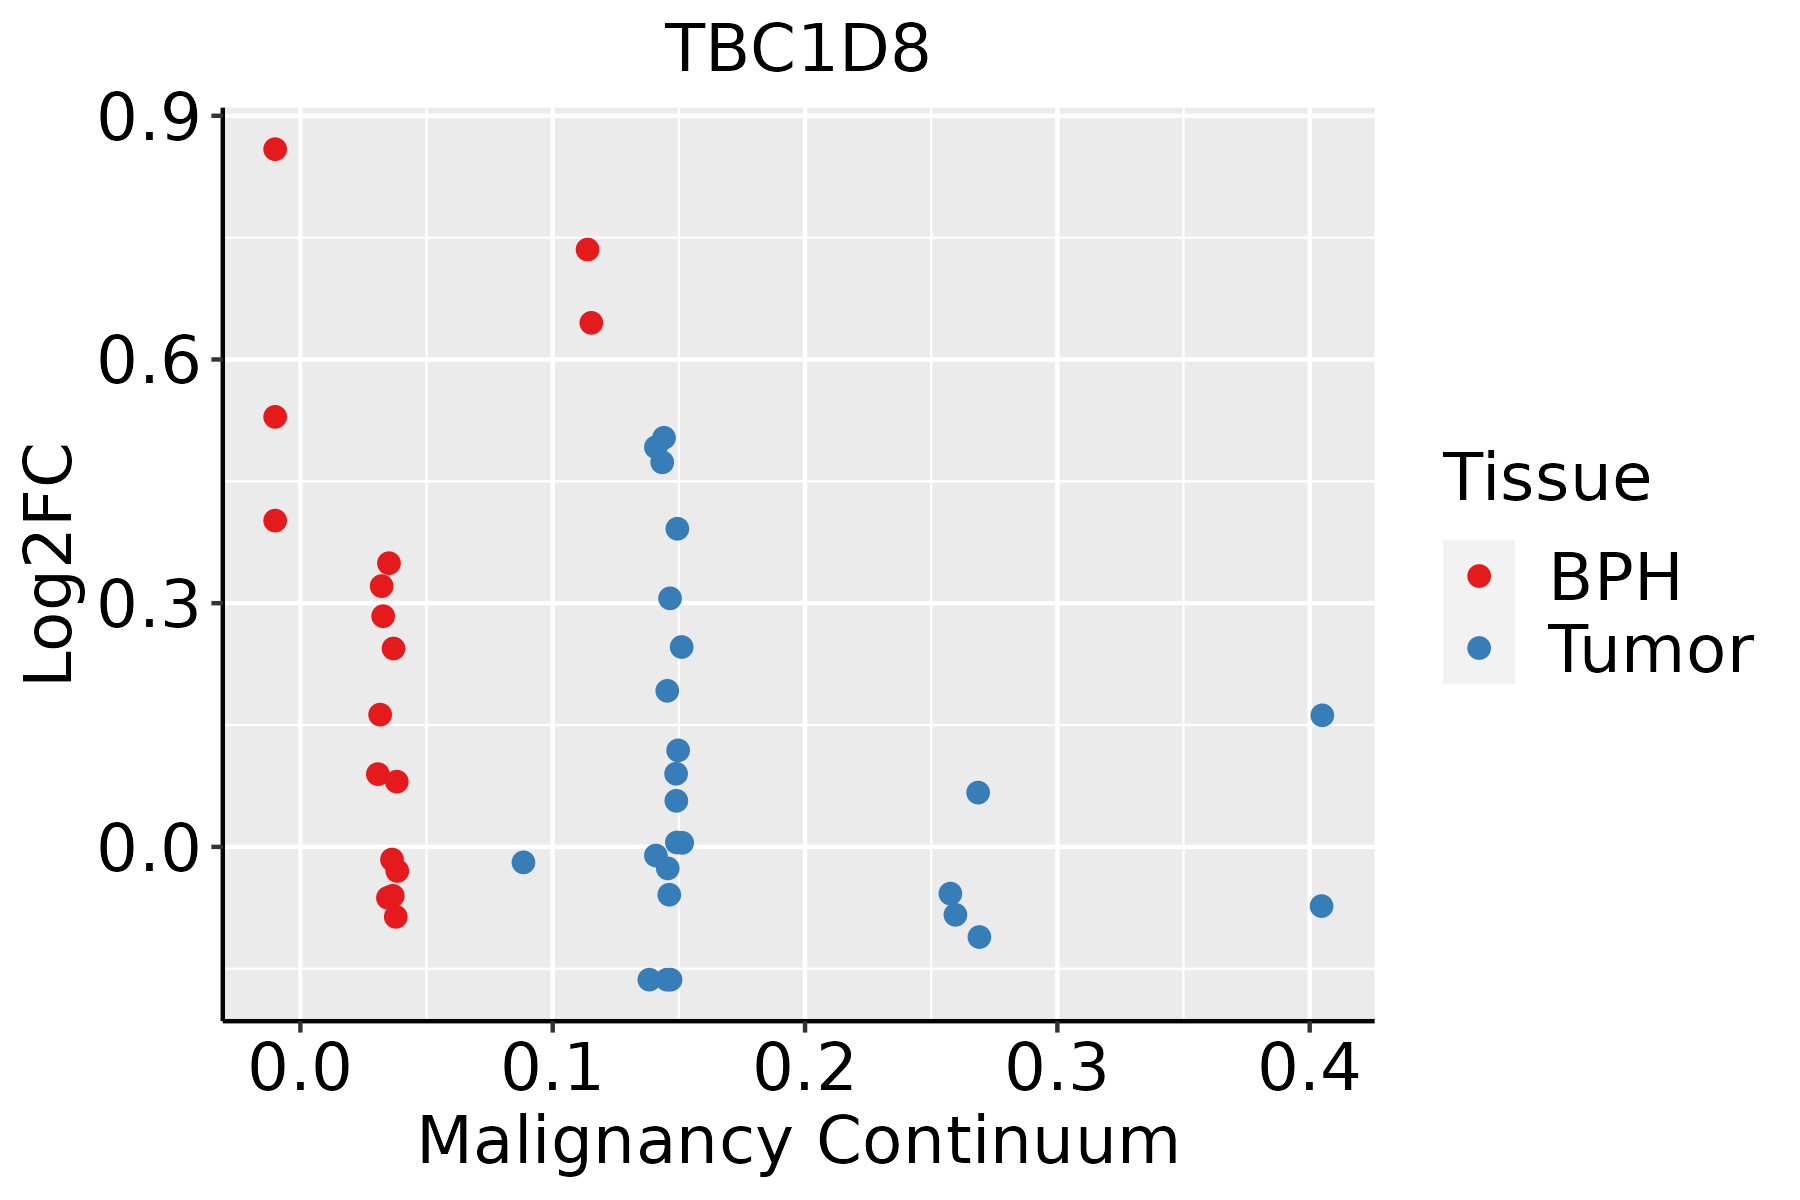 | BPH: Benign Prostatic Hyperplasia |
| ∗log2FC in expression of this searched gene in stem-like cells from each diseased tissue sample relative to stem-like cells in normal samples in each tissue plotted against the malignancy continuum. Samples are colored based on if they are from different disease stage. |
Top |
Malignant transformation related pathway analysis |
| Find out the enriched GO biological processes and KEGG pathways involved in transition from healthy to precancer to cancer |
| Tissue | Disease Stage | Enriched GO biological Processes |
| Colorectum | AD |  |
| Colorectum | SER |  |
| Colorectum | MSS |  |
| Colorectum | MSI-H |  |
| Colorectum | FAP |  |
| ∗Top 15 enriched GO BP terms are showed in the bar plot of each disease state in each tissue. Each row represents a significant GO biological process which is colored according to the -log10(p.adjust). |
| Page: 1 2 3 4 5 6 7 8 9 |
| GO ID | Tissue | Disease Stage | Description | Gene Ratio | Bg Ratio | pvalue | p.adjust | Count |
| GO:00430877 | Cervix | CC | regulation of GTPase activity | 79/2311 | 348/18723 | 4.21e-08 | 2.60e-06 | 79 |
| GO:00435476 | Cervix | CC | positive regulation of GTPase activity | 53/2311 | 255/18723 | 8.72e-05 | 1.16e-03 | 53 |
| GO:00430878 | Endometrium | AEH | regulation of GTPase activity | 66/2100 | 348/18723 | 1.26e-05 | 2.77e-04 | 66 |
| GO:00435477 | Endometrium | AEH | positive regulation of GTPase activity | 48/2100 | 255/18723 | 2.18e-04 | 2.67e-03 | 48 |
| GO:00906304 | Endometrium | AEH | activation of GTPase activity | 22/2100 | 115/18723 | 8.42e-03 | 4.60e-02 | 22 |
| GO:004308712 | Endometrium | EEC | regulation of GTPase activity | 67/2168 | 348/18723 | 1.84e-05 | 3.43e-04 | 67 |
| GO:004354712 | Endometrium | EEC | positive regulation of GTPase activity | 50/2168 | 255/18723 | 1.26e-04 | 1.66e-03 | 50 |
| GO:009063012 | Endometrium | EEC | activation of GTPase activity | 23/2168 | 115/18723 | 6.04e-03 | 3.57e-02 | 23 |
| GO:004308715 | Esophagus | ESCC | regulation of GTPase activity | 183/8552 | 348/18723 | 5.34e-03 | 2.00e-02 | 183 |
| GO:00430875 | Liver | NAFLD | regulation of GTPase activity | 62/1882 | 348/18723 | 5.65e-06 | 2.03e-04 | 62 |
| GO:00435474 | Liver | NAFLD | positive regulation of GTPase activity | 45/1882 | 255/18723 | 1.30e-04 | 2.47e-03 | 45 |
| GO:00906301 | Liver | NAFLD | activation of GTPase activity | 22/1882 | 115/18723 | 2.28e-03 | 2.19e-02 | 22 |
| GO:00430879 | Prostate | BPH | regulation of GTPase activity | 88/3107 | 348/18723 | 2.04e-05 | 2.49e-04 | 88 |
| GO:00435478 | Prostate | BPH | positive regulation of GTPase activity | 61/3107 | 255/18723 | 1.58e-03 | 9.23e-03 | 61 |
| GO:004308713 | Prostate | Tumor | regulation of GTPase activity | 88/3246 | 348/18723 | 1.04e-04 | 1.00e-03 | 88 |
| GO:004354713 | Prostate | Tumor | positive regulation of GTPase activity | 60/3246 | 255/18723 | 6.87e-03 | 3.11e-02 | 60 |
| Page: 1 |
| Pathway ID | Tissue | Disease Stage | Description | Gene Ratio | Bg Ratio | pvalue | p.adjust | qvalue | Count |
| Page: 1 |
Top |
Cell-cell communication analysis |
| Identification of potential cell-cell interactions between two cell types and their ligand-receptor pairs for different disease states |
| Ligand | Receptor | LRpair | Pathway | Tissue | Disease Stage |
| Page: 1 |
Top |
Single-cell gene regulatory network inference analysis |
| Find out the significant the regulons (TFs) and the target genes of each regulon across cell types for different disease states |
| TF | Cell Type | Tissue | Disease Stage | Target Gene | RSS | Regulon Activity |
| ∗The dot plots of a searched regulon are shown for all cell subpopulations in each disease state of each tissue based on the regulon specific score inferred using pySCENIC and by calculating the average expression. |
| Page: 1 |
Top |
Somatic mutation of malignant transformation related genes |
| Annotation of somatic variants for genes involved in malignant transformation |
| Hugo Symbol | Variant Class | Variant Classification | dbSNP RS | HGVSc | HGVSp | HGVSp Short | SWISSPROT | BIOTYPE | SIFT | PolyPhen | Tumor Sample Barcode | Tissue | Histology | Sex | Age | Stage | Therapy Types | Drugs | Outcome |
| TBC1D8 | SNV | Missense_Mutation | c.2788N>C | p.Glu930Gln | p.E930Q | protein_coding | tolerated(0.07) | probably_damaging(0.999) | TCGA-AC-A23C-01 | Breast | breast invasive carcinoma | Female | <65 | I/II | Chemotherapy | chemo | CR | ||
| TBC1D8 | SNV | Missense_Mutation | c.1143N>G | p.Ile381Met | p.I381M | protein_coding | deleterious(0.03) | possibly_damaging(0.599) | TCGA-AC-A23H-01 | Breast | breast invasive carcinoma | Female | >=65 | I/II | Unknown | Unknown | PD | ||
| TBC1D8 | SNV | Missense_Mutation | novel | c.1448N>A | p.Arg483Gln | p.R483Q | protein_coding | tolerated(0.08) | benign(0.003) | TCGA-AN-A046-01 | Breast | breast invasive carcinoma | Female | >=65 | I/II | Unknown | Unknown | SD | |
| TBC1D8 | SNV | Missense_Mutation | rs868793286 | c.188N>A | p.Arg63Gln | p.R63Q | protein_coding | deleterious(0) | probably_damaging(0.999) | TCGA-AN-A046-01 | Breast | breast invasive carcinoma | Female | >=65 | I/II | Unknown | Unknown | SD | |
| TBC1D8 | SNV | Missense_Mutation | novel | c.3268N>C | p.Glu1090Gln | p.E1090Q | protein_coding | tolerated(0.53) | benign(0.007) | TCGA-BH-A0BA-01 | Breast | breast invasive carcinoma | Female | <65 | III/IV | Chemotherapy | cytoxan | SD | |
| TBC1D8 | SNV | Missense_Mutation | c.3317C>T | p.Ser1106Leu | p.S1106L | protein_coding | deleterious(0) | probably_damaging(0.999) | TCGA-BH-A0EB-01 | Breast | breast invasive carcinoma | Female | >=65 | I/II | Hormone Therapy | arimidex | SD | ||
| TBC1D8 | SNV | Missense_Mutation | c.2647N>C | p.Val883Leu | p.V883L | protein_coding | tolerated(1) | benign(0.019) | TCGA-E9-A1ND-01 | Breast | breast invasive carcinoma | Female | >=65 | I/II | Hormone Therapy | aromasin | SD | ||
| TBC1D8 | SNV | Missense_Mutation | rs370330869 | c.971C>T | p.Thr324Met | p.T324M | protein_coding | deleterious(0) | probably_damaging(0.987) | TCGA-E9-A247-01 | Breast | breast invasive carcinoma | Female | <65 | I/II | Hormone Therapy | tamoxiphen | SD | |
| TBC1D8 | SNV | Missense_Mutation | c.1737C>G | p.Phe579Leu | p.F579L | protein_coding | deleterious(0) | possibly_damaging(0.755) | TCGA-E9-A295-01 | Breast | breast invasive carcinoma | Female | >=65 | I/II | Hormone Therapy | tamoxiphen | SD | ||
| TBC1D8 | SNV | Missense_Mutation | novel | c.3008T>C | p.Met1003Thr | p.M1003T | protein_coding | deleterious(0) | probably_damaging(0.991) | TCGA-PE-A5DC-01 | Breast | breast invasive carcinoma | Female | >=65 | III/IV | Unknown | Unknown | SD |
| Page: 1 2 3 4 5 6 7 8 9 10 11 12 |
Top |
Related drugs of malignant transformation related genes |
| Identification of chemicals and drugs interact with genes involved in malignant transfromation |
| (DGIdb 4.0) |
| Entrez ID | Symbol | Category | Interaction Types | Drug Claim Name | Drug Name | PMIDs |
| Page: 1 |

Copyright 2023-Present -The University of Texas Health Science Center at Houston |