
|
|||||
|
 | |
| |
| |
| |
| |
| |
|
Gene: TBC1D7 |
Gene summary for TBC1D7 |
| Gene information | Species | Human | Gene symbol | TBC1D7 | Gene ID | 51256 |
| Gene name | TBC1 domain family member 7 | |
| Gene Alias | MGCPH | |
| Cytomap | 6p24.1 | |
| Gene Type | protein-coding | GO ID | GO:0006464 | UniProtAcc | A0A024QZX0 |
Top |
Malignant transformation analysis |
| Identification of the aberrant gene expression in precancerous and cancerous lesions by comparing the gene expression of stem-like cells in diseased tissues with normal stem cells |
| Entrez ID | Symbol | Replicates | Species | Organ | Tissue | Adj P-value | Log2FC | Malignancy |
| 51256 | TBC1D7 | LZE2T | Human | Esophagus | ESCC | 3.01e-02 | 2.74e-01 | 0.082 |
| 51256 | TBC1D7 | LZE4T | Human | Esophagus | ESCC | 5.22e-10 | 2.36e-01 | 0.0811 |
| 51256 | TBC1D7 | LZE7T | Human | Esophagus | ESCC | 1.25e-28 | 1.75e+00 | 0.0667 |
| 51256 | TBC1D7 | LZE8T | Human | Esophagus | ESCC | 5.52e-05 | 2.83e-01 | 0.067 |
| 51256 | TBC1D7 | LZE20T | Human | Esophagus | ESCC | 6.42e-07 | 2.06e-01 | 0.0662 |
| 51256 | TBC1D7 | LZE22T | Human | Esophagus | ESCC | 7.52e-03 | 4.56e-01 | 0.068 |
| 51256 | TBC1D7 | LZE24T | Human | Esophagus | ESCC | 3.72e-12 | 2.89e-01 | 0.0596 |
| 51256 | TBC1D7 | LZE21T | Human | Esophagus | ESCC | 2.15e-02 | 3.10e-01 | 0.0655 |
| 51256 | TBC1D7 | LZE6T | Human | Esophagus | ESCC | 4.94e-07 | 3.34e-01 | 0.0845 |
| 51256 | TBC1D7 | P1T-E | Human | Esophagus | ESCC | 2.16e-12 | 5.06e-01 | 0.0875 |
| 51256 | TBC1D7 | P2T-E | Human | Esophagus | ESCC | 2.38e-32 | 6.35e-01 | 0.1177 |
| 51256 | TBC1D7 | P4T-E | Human | Esophagus | ESCC | 3.74e-35 | 7.82e-01 | 0.1323 |
| 51256 | TBC1D7 | P5T-E | Human | Esophagus | ESCC | 7.37e-12 | 2.94e-01 | 0.1327 |
| 51256 | TBC1D7 | P8T-E | Human | Esophagus | ESCC | 1.09e-15 | 3.44e-01 | 0.0889 |
| 51256 | TBC1D7 | P9T-E | Human | Esophagus | ESCC | 2.89e-16 | 3.39e-01 | 0.1131 |
| 51256 | TBC1D7 | P10T-E | Human | Esophagus | ESCC | 4.42e-39 | 6.17e-01 | 0.116 |
| 51256 | TBC1D7 | P11T-E | Human | Esophagus | ESCC | 1.66e-22 | 6.92e-01 | 0.1426 |
| 51256 | TBC1D7 | P12T-E | Human | Esophagus | ESCC | 1.22e-19 | 4.67e-01 | 0.1122 |
| 51256 | TBC1D7 | P15T-E | Human | Esophagus | ESCC | 5.25e-29 | 5.05e-01 | 0.1149 |
| 51256 | TBC1D7 | P16T-E | Human | Esophagus | ESCC | 1.66e-32 | 5.88e-01 | 0.1153 |
| Page: 1 2 3 4 5 |
| Tissue | Expression Dynamics | Abbreviation |
| Esophagus |  | ESCC: Esophageal squamous cell carcinoma |
| HGIN: High-grade intraepithelial neoplasias | ||
| LGIN: Low-grade intraepithelial neoplasias | ||
| Liver | 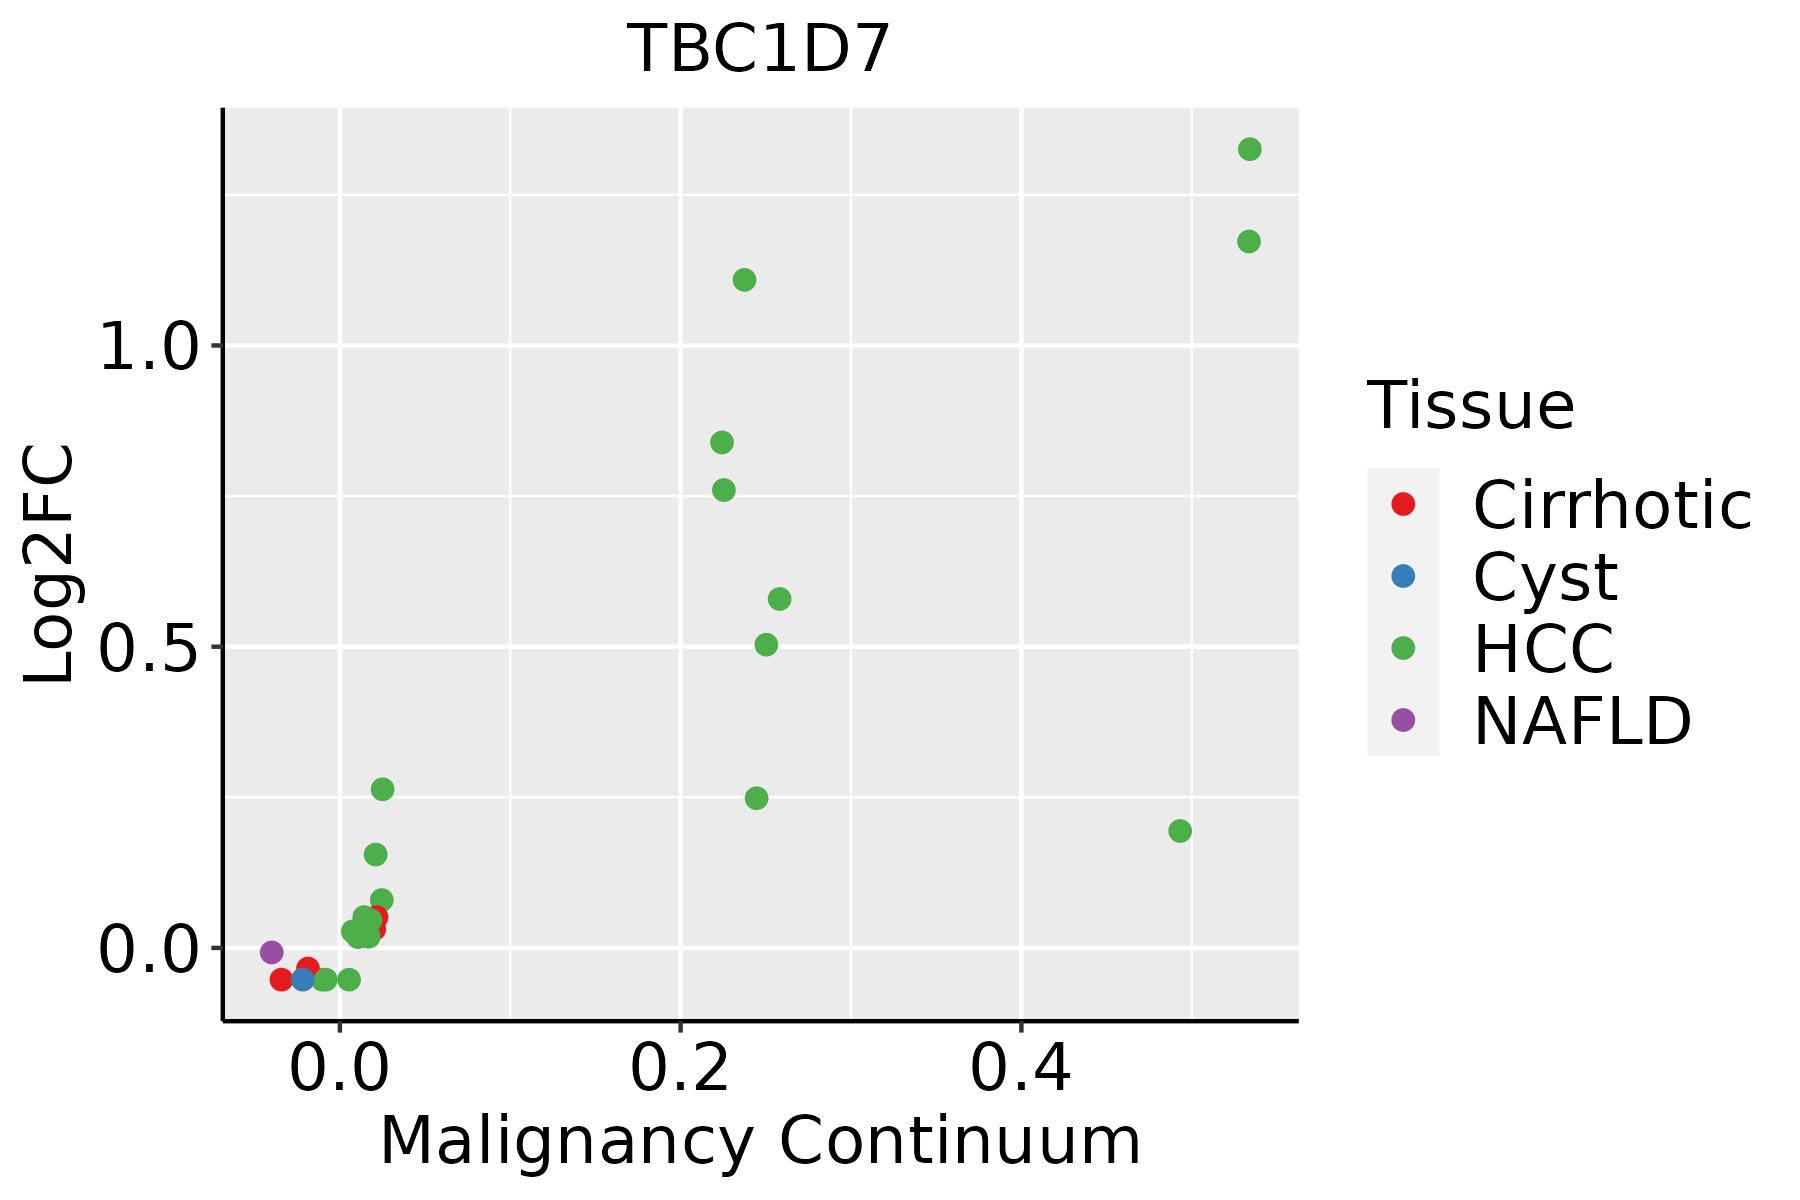 | HCC: Hepatocellular carcinoma |
| NAFLD: Non-alcoholic fatty liver disease | ||
| Oral Cavity | 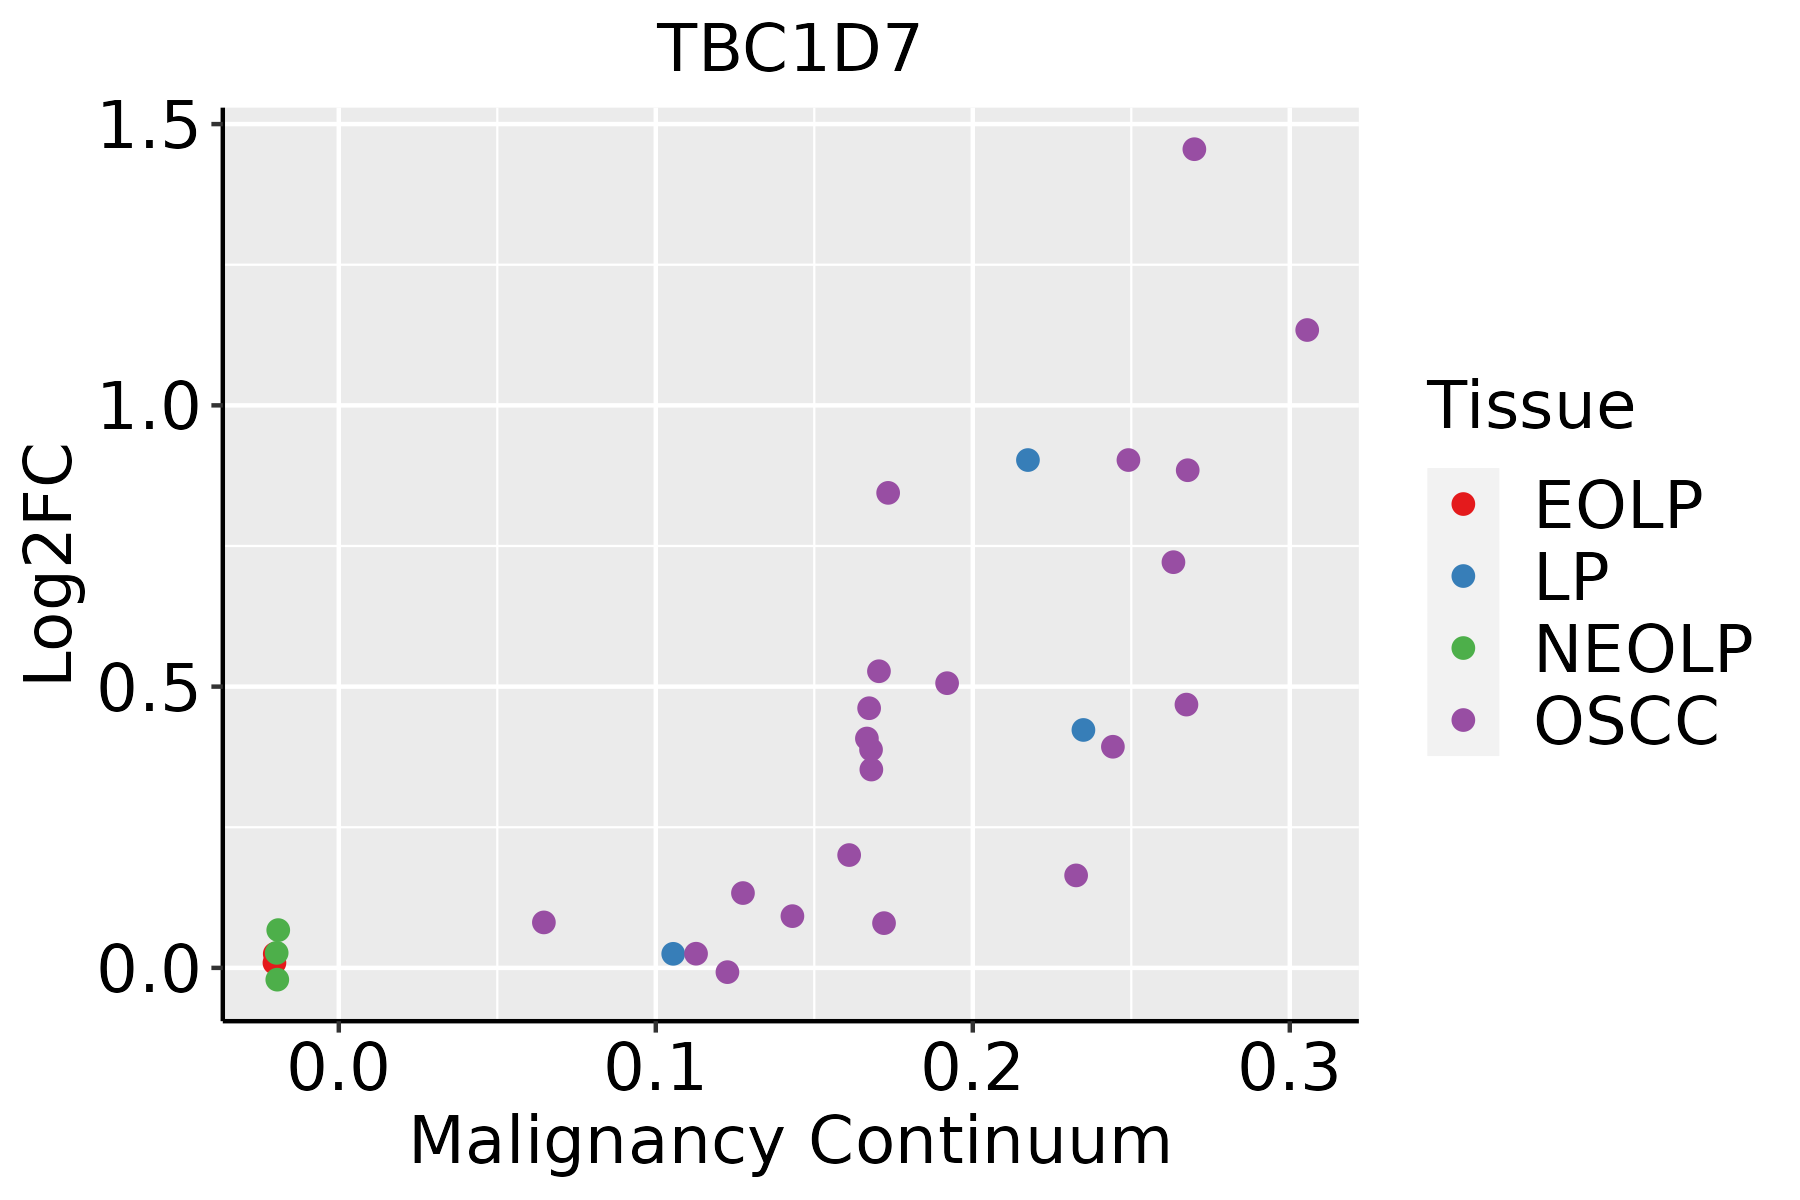 | EOLP: Erosive Oral lichen planus |
| LP: leukoplakia | ||
| NEOLP: Non-erosive oral lichen planus | ||
| OSCC: Oral squamous cell carcinoma |
| ∗log2FC in expression of this searched gene in stem-like cells from each diseased tissue sample relative to stem-like cells in normal samples in each tissue plotted against the malignancy continuum. Samples are colored based on if they are from different disease stage. |
Top |
Malignant transformation related pathway analysis |
| Find out the enriched GO biological processes and KEGG pathways involved in transition from healthy to precancer to cancer |
| Tissue | Disease Stage | Enriched GO biological Processes |
| Colorectum | AD |  |
| Colorectum | SER |  |
| Colorectum | MSS |  |
| Colorectum | MSI-H |  |
| Colorectum | FAP |  |
| ∗Top 15 enriched GO BP terms are showed in the bar plot of each disease state in each tissue. Each row represents a significant GO biological process which is colored according to the -log10(p.adjust). |
| Page: 1 2 3 4 5 6 7 8 9 |
| GO ID | Tissue | Disease Stage | Description | Gene Ratio | Bg Ratio | pvalue | p.adjust | Count |
| GO:1903320111 | Esophagus | ESCC | regulation of protein modification by small protein conjugation or removal | 181/8552 | 242/18723 | 1.80e-20 | 2.60e-18 | 181 |
| GO:0031396111 | Esophagus | ESCC | regulation of protein ubiquitination | 154/8552 | 210/18723 | 2.70e-16 | 2.04e-14 | 154 |
| GO:190332216 | Esophagus | ESCC | positive regulation of protein modification by small protein conjugation or removal | 99/8552 | 138/18723 | 4.39e-10 | 1.16e-08 | 99 |
| GO:0010639110 | Esophagus | ESCC | negative regulation of organelle organization | 215/8552 | 348/18723 | 8.20e-10 | 2.01e-08 | 215 |
| GO:003139816 | Esophagus | ESCC | positive regulation of protein ubiquitination | 82/8552 | 119/18723 | 2.41e-07 | 3.64e-06 | 82 |
| GO:190211514 | Esophagus | ESCC | regulation of organelle assembly | 116/8552 | 186/18723 | 3.15e-06 | 3.53e-05 | 116 |
| GO:00319294 | Esophagus | ESCC | TOR signaling | 79/8552 | 126/18723 | 8.57e-05 | 6.21e-04 | 79 |
| GO:006049118 | Esophagus | ESCC | regulation of cell projection assembly | 110/8552 | 188/18723 | 2.60e-04 | 1.58e-03 | 110 |
| GO:012003218 | Esophagus | ESCC | regulation of plasma membrane bounded cell projection assembly | 108/8552 | 186/18723 | 4.37e-04 | 2.46e-03 | 108 |
| GO:00320061 | Esophagus | ESCC | regulation of TOR signaling | 63/8552 | 104/18723 | 1.55e-03 | 7.29e-03 | 63 |
| GO:190211611 | Esophagus | ESCC | negative regulation of organelle assembly | 28/8552 | 41/18723 | 2.88e-03 | 1.21e-02 | 28 |
| GO:004308715 | Esophagus | ESCC | regulation of GTPase activity | 183/8552 | 348/18723 | 5.34e-03 | 2.00e-02 | 183 |
| GO:190332022 | Liver | HCC | regulation of protein modification by small protein conjugation or removal | 167/7958 | 242/18723 | 4.99e-17 | 4.72e-15 | 167 |
| GO:003139622 | Liver | HCC | regulation of protein ubiquitination | 142/7958 | 210/18723 | 1.39e-13 | 7.81e-12 | 142 |
| GO:001063912 | Liver | HCC | negative regulation of organelle organization | 204/7958 | 348/18723 | 7.67e-10 | 2.37e-08 | 204 |
| GO:19033221 | Liver | HCC | positive regulation of protein modification by small protein conjugation or removal | 94/7958 | 138/18723 | 9.87e-10 | 3.01e-08 | 94 |
| GO:00313981 | Liver | HCC | positive regulation of protein ubiquitination | 79/7958 | 119/18723 | 1.18e-07 | 2.26e-06 | 79 |
| GO:19021151 | Liver | HCC | regulation of organelle assembly | 110/7958 | 186/18723 | 3.30e-06 | 4.34e-05 | 110 |
| GO:00319291 | Liver | HCC | TOR signaling | 78/7958 | 126/18723 | 8.49e-06 | 9.97e-05 | 78 |
| GO:0032006 | Liver | HCC | regulation of TOR signaling | 63/7958 | 104/18723 | 1.50e-04 | 1.20e-03 | 63 |
| Page: 1 2 3 |
| Pathway ID | Tissue | Disease Stage | Description | Gene Ratio | Bg Ratio | pvalue | p.adjust | qvalue | Count |
| hsa041505 | Esophagus | ESCC | mTOR signaling pathway | 98/4205 | 156/8465 | 5.81e-04 | 1.95e-03 | 9.97e-04 | 98 |
| hsa0415013 | Esophagus | ESCC | mTOR signaling pathway | 98/4205 | 156/8465 | 5.81e-04 | 1.95e-03 | 9.97e-04 | 98 |
| hsa041502 | Liver | HCC | mTOR signaling pathway | 95/4020 | 156/8465 | 4.70e-04 | 1.99e-03 | 1.11e-03 | 95 |
| hsa0415011 | Liver | HCC | mTOR signaling pathway | 95/4020 | 156/8465 | 4.70e-04 | 1.99e-03 | 1.11e-03 | 95 |
| hsa041504 | Oral cavity | OSCC | mTOR signaling pathway | 90/3704 | 156/8465 | 2.87e-04 | 9.15e-04 | 4.66e-04 | 90 |
| hsa0415012 | Oral cavity | OSCC | mTOR signaling pathway | 90/3704 | 156/8465 | 2.87e-04 | 9.15e-04 | 4.66e-04 | 90 |
| Page: 1 |
Top |
Cell-cell communication analysis |
| Identification of potential cell-cell interactions between two cell types and their ligand-receptor pairs for different disease states |
| Ligand | Receptor | LRpair | Pathway | Tissue | Disease Stage |
| Page: 1 |
Top |
Single-cell gene regulatory network inference analysis |
| Find out the significant the regulons (TFs) and the target genes of each regulon across cell types for different disease states |
| TF | Cell Type | Tissue | Disease Stage | Target Gene | RSS | Regulon Activity |
| ∗The dot plots of a searched regulon are shown for all cell subpopulations in each disease state of each tissue based on the regulon specific score inferred using pySCENIC and by calculating the average expression. |
| Page: 1 |
Top |
Somatic mutation of malignant transformation related genes |
| Annotation of somatic variants for genes involved in malignant transformation |
| Hugo Symbol | Variant Class | Variant Classification | dbSNP RS | HGVSc | HGVSp | HGVSp Short | SWISSPROT | BIOTYPE | SIFT | PolyPhen | Tumor Sample Barcode | Tissue | Histology | Sex | Age | Stage | Therapy Types | Drugs | Outcome |
| TBC1D7 | SNV | Missense_Mutation | c.592N>A | p.Ala198Thr | p.A198T | Q9P0N9 | protein_coding | deleterious(0.01) | benign(0.003) | TCGA-BH-A0HF-01 | Breast | breast invasive carcinoma | Female | >=65 | I/II | Hormone Therapy | arimidex | SD | |
| TBC1D7 | insertion | Nonsense_Mutation | novel | c.394_395insGGACTTGCAAATAGTATTTGCATATAACCTACACATCTCTTCCT | p.Glu132GlyfsTer5 | p.E132Gfs*5 | Q9P0N9 | protein_coding | TCGA-A8-A06P-01 | Breast | breast invasive carcinoma | Female | <65 | III/IV | Unspecific | SD | |||
| TBC1D7 | deletion | Frame_Shift_Del | novel | c.633delN | p.Phe211LeufsTer18 | p.F211Lfs*18 | Q9P0N9 | protein_coding | TCGA-D8-A27V-01 | Breast | breast invasive carcinoma | Female | <65 | I/II | Hormone Therapy | tamoxiphen | SD | ||
| TBC1D7 | SNV | Missense_Mutation | novel | c.814N>A | p.Asp272Asn | p.D272N | Q9P0N9 | protein_coding | deleterious(0) | probably_damaging(0.911) | TCGA-MY-A5BD-01 | Cervix | cervical & endocervical cancer | Female | <65 | I/II | Chemotherapy | cisplatin | CR |
| TBC1D7 | SNV | Missense_Mutation | c.362N>A | p.Arg121Gln | p.R121Q | Q9P0N9 | protein_coding | tolerated(0.29) | benign(0.005) | TCGA-AZ-4315-01 | Colorectum | colon adenocarcinoma | Male | <65 | I/II | Unknown | Unknown | SD | |
| TBC1D7 | SNV | Missense_Mutation | rs767151296 | c.499C>T | p.Arg167Trp | p.R167W | Q9P0N9 | protein_coding | tolerated(0.06) | possibly_damaging(0.609) | TCGA-AZ-6601-01 | Colorectum | colon adenocarcinoma | Male | >=65 | I/II | Unknown | Unknown | PD |
| TBC1D7 | SNV | Missense_Mutation | rs766235427 | c.721N>A | p.Glu241Lys | p.E241K | Q9P0N9 | protein_coding | tolerated(0.56) | probably_damaging(0.945) | TCGA-AG-A002-01 | Colorectum | rectum adenocarcinoma | Male | <65 | I/II | Unknown | Unknown | SD |
| TBC1D7 | SNV | Missense_Mutation | rs766235427 | c.721G>A | p.Glu241Lys | p.E241K | Q9P0N9 | protein_coding | tolerated(0.56) | probably_damaging(0.945) | TCGA-G5-6233-01 | Colorectum | rectum adenocarcinoma | Male | >=65 | III/IV | Chemotherapy | 5-fluorouracil | PD |
| TBC1D7 | SNV | Missense_Mutation | novel | c.511N>T | p.Pro171Ser | p.P171S | Q9P0N9 | protein_coding | deleterious(0.03) | benign(0.175) | TCGA-A5-A0G1-01 | Endometrium | uterine corpus endometrioid carcinoma | Female | >=65 | I/II | Unknown | Unknown | SD |
| TBC1D7 | SNV | Missense_Mutation | novel | c.337N>A | p.Gln113Lys | p.Q113K | Q9P0N9 | protein_coding | tolerated(1) | benign(0.283) | TCGA-A5-A0GI-01 | Endometrium | uterine corpus endometrioid carcinoma | Female | <65 | I/II | Unknown | Unknown | SD |
| Page: 1 2 3 4 5 |
Top |
Related drugs of malignant transformation related genes |
| Identification of chemicals and drugs interact with genes involved in malignant transfromation |
| (DGIdb 4.0) |
| Entrez ID | Symbol | Category | Interaction Types | Drug Claim Name | Drug Name | PMIDs |
| Page: 1 |

Copyright 2023-Present -The University of Texas Health Science Center at Houston |