
|
|||||
|
 | |
| |
| |
| |
| |
| |
|
Gene: TBC1D32 |
Gene summary for TBC1D32 |
| Gene information | Species | Human | Gene symbol | TBC1D32 | Gene ID | 221322 |
| Gene name | TBC1 domain family member 32 | |
| Gene Alias | BROMI | |
| Cytomap | 6q22.31 | |
| Gene Type | protein-coding | GO ID | GO:0001654 | UniProtAcc | Q96NH3 |
Top |
Malignant transformation analysis |
| Identification of the aberrant gene expression in precancerous and cancerous lesions by comparing the gene expression of stem-like cells in diseased tissues with normal stem cells |
| Entrez ID | Symbol | Replicates | Species | Organ | Tissue | Adj P-value | Log2FC | Malignancy |
| 221322 | TBC1D32 | HCC1_Meng | Human | Liver | HCC | 8.54e-04 | -3.17e-02 | 0.0246 |
| 221322 | TBC1D32 | HCC1 | Human | Liver | HCC | 1.27e-07 | 2.23e+00 | 0.5336 |
| 221322 | TBC1D32 | HCC2 | Human | Liver | HCC | 1.80e-11 | 2.17e+00 | 0.5341 |
| 221322 | TBC1D32 | HCC5 | Human | Liver | HCC | 2.64e-14 | 1.99e+00 | 0.4932 |
| 221322 | TBC1D32 | RNA-P17T-P17T-2 | Human | Lung | IAC | 6.80e-05 | 5.14e-01 | 0.3371 |
| 221322 | TBC1D32 | RNA-P17T-P17T-4 | Human | Lung | IAC | 1.48e-03 | 3.94e-01 | 0.343 |
| 221322 | TBC1D32 | RNA-P17T-P17T-6 | Human | Lung | IAC | 4.71e-02 | 4.05e-01 | 0.3385 |
| 221322 | TBC1D32 | RNA-P17T-P17T-8 | Human | Lung | IAC | 1.55e-04 | 4.65e-01 | 0.3329 |
| 221322 | TBC1D32 | RNA-P25T1-P25T1-1 | Human | Lung | AIS | 8.87e-03 | 1.60e-01 | -0.2116 |
| 221322 | TBC1D32 | RNA-P25T1-P25T1-4 | Human | Lung | AIS | 1.70e-10 | 5.08e-01 | -0.2119 |
| 221322 | TBC1D32 | RNA-P6T2-P6T2-1 | Human | Lung | IAC | 1.51e-02 | 1.43e-01 | -0.0166 |
| 221322 | TBC1D32 | RNA-P6T2-P6T2-2 | Human | Lung | IAC | 6.53e-06 | 2.40e-01 | -0.0132 |
| 221322 | TBC1D32 | RNA-P6T2-P6T2-3 | Human | Lung | IAC | 3.48e-05 | 1.85e-01 | -0.013 |
| 221322 | TBC1D32 | RNA-P6T2-P6T2-4 | Human | Lung | IAC | 5.70e-05 | 1.97e-01 | -0.0121 |
| 221322 | TBC1D32 | RNA-P7T1-P7T1-2 | Human | Lung | AIS | 2.28e-04 | 4.42e-01 | -0.0876 |
| 221322 | TBC1D32 | HTA12-15-2 | Human | Pancreas | PDAC | 2.15e-03 | 3.44e-01 | 0.2315 |
| 221322 | TBC1D32 | HTA12-23-1 | Human | Pancreas | PDAC | 5.37e-04 | 6.68e-01 | 0.3405 |
| 221322 | TBC1D32 | HTA12-25-1 | Human | Pancreas | PDAC | 3.15e-05 | 5.96e-01 | 0.313 |
| 221322 | TBC1D32 | HTA12-26-1 | Human | Pancreas | PDAC | 1.56e-13 | 6.91e-01 | 0.3728 |
| 221322 | TBC1D32 | HTA12-29-1 | Human | Pancreas | PDAC | 2.44e-34 | 7.59e-01 | 0.3722 |
| Page: 1 |
| Tissue | Expression Dynamics | Abbreviation |
| Liver | 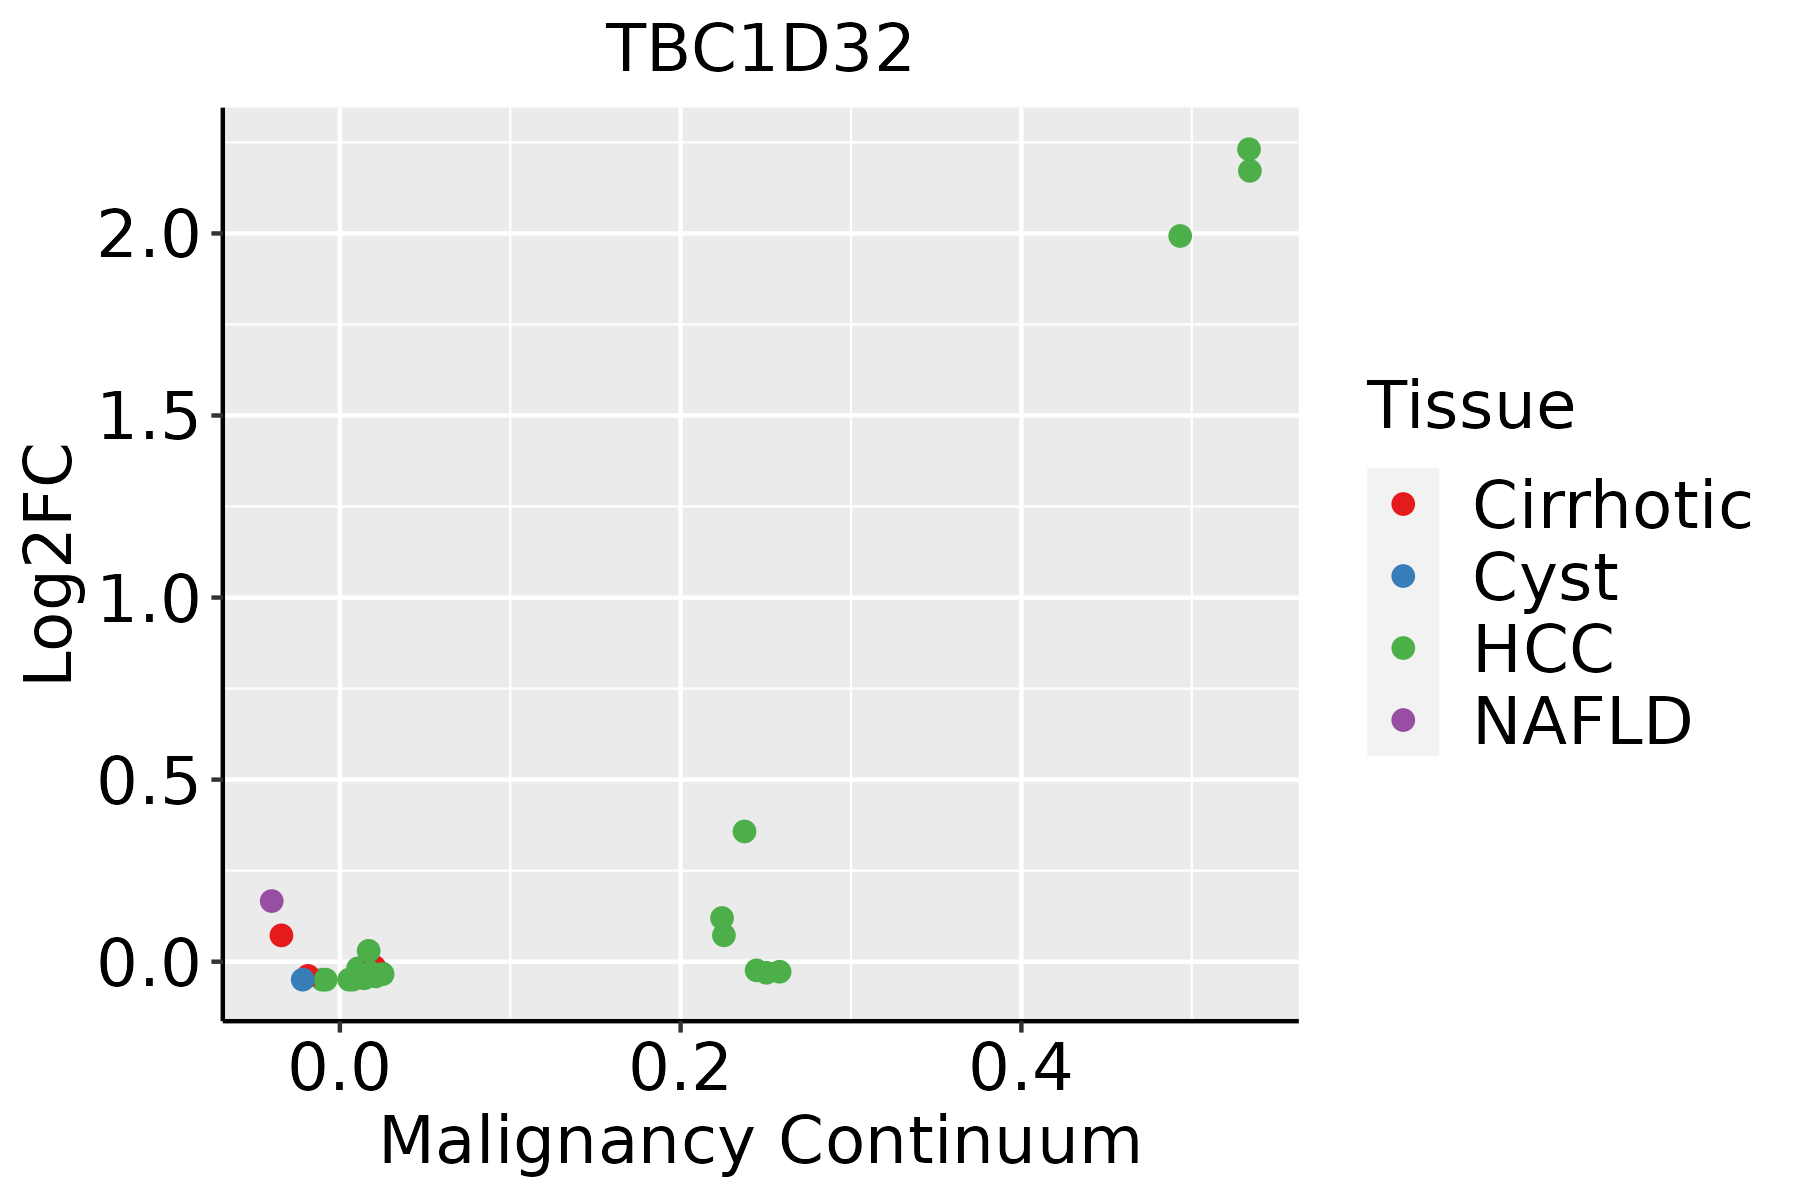 | HCC: Hepatocellular carcinoma |
| NAFLD: Non-alcoholic fatty liver disease | ||
| Lung | 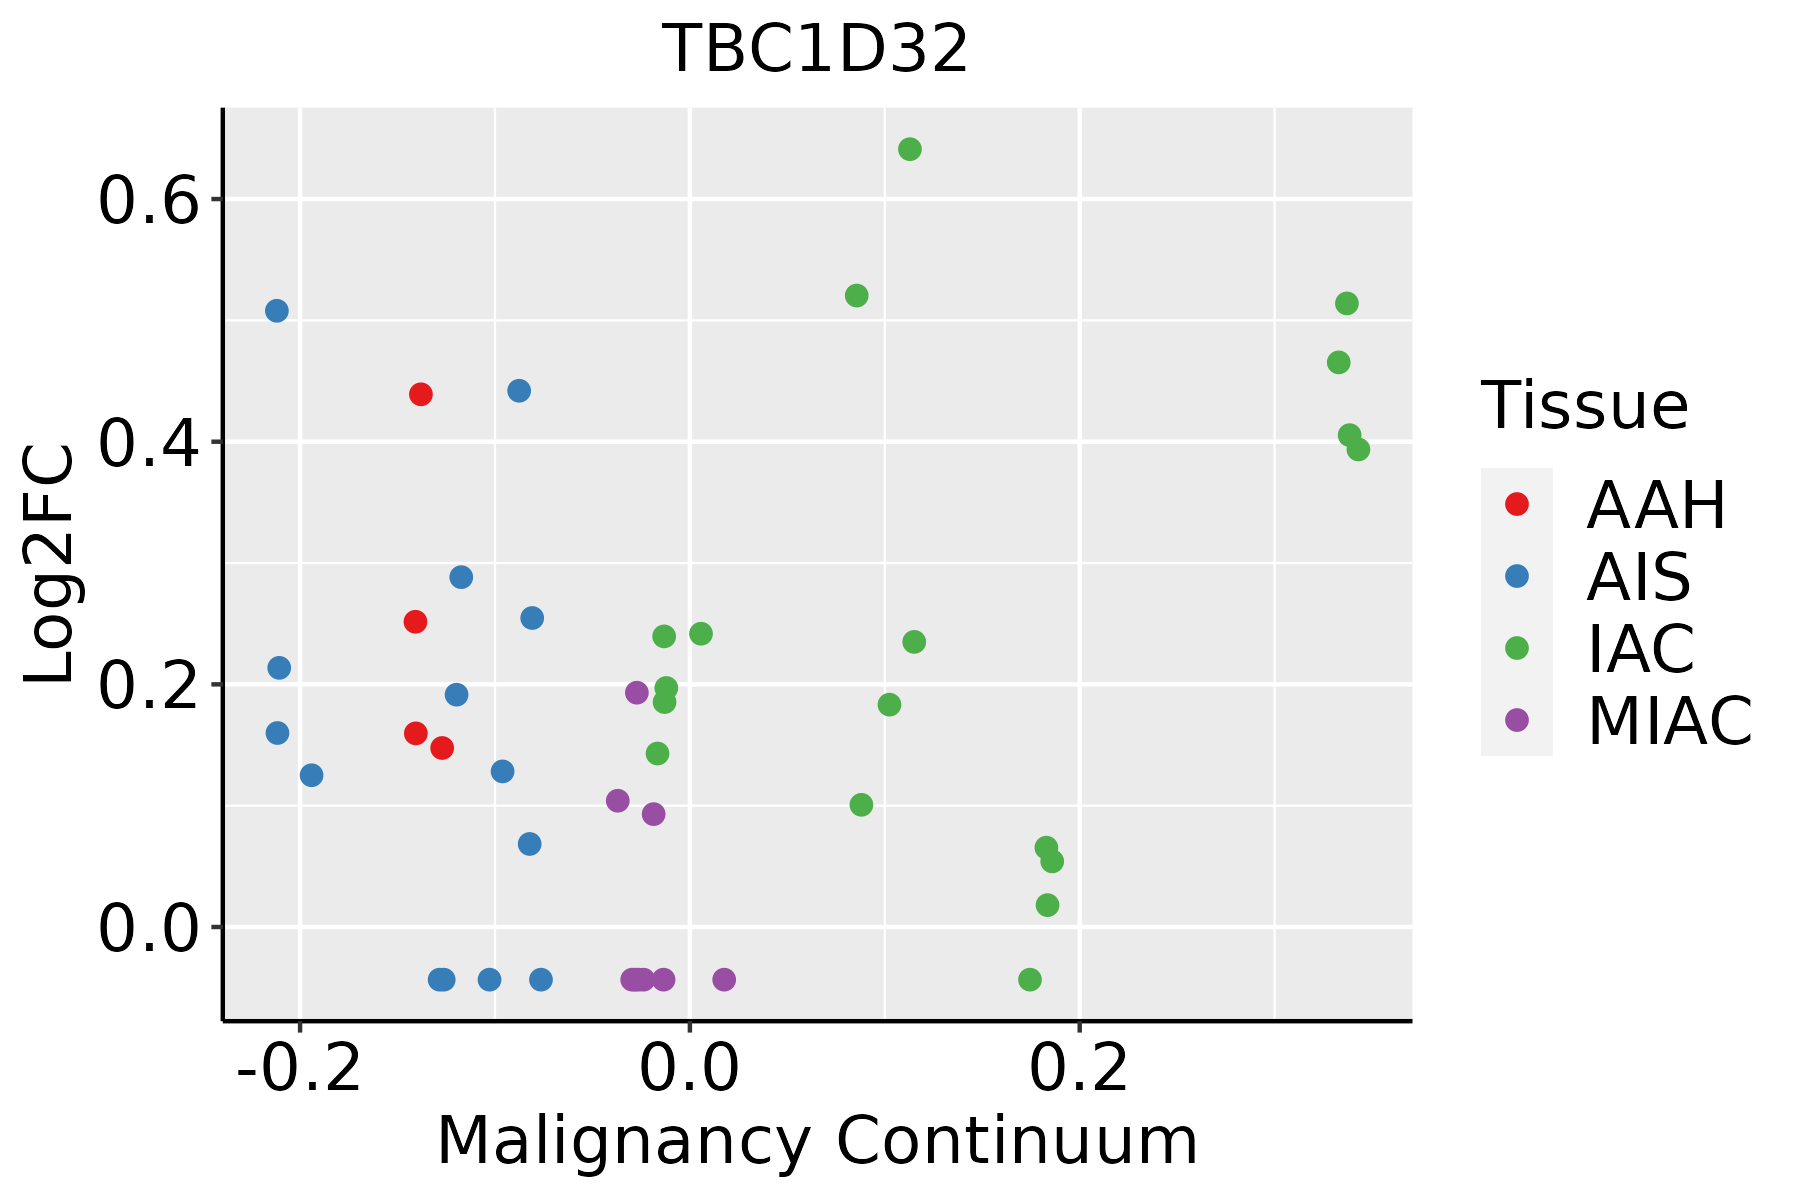 | AAH: Atypical adenomatous hyperplasia |
| AIS: Adenocarcinoma in situ | ||
| IAC: Invasive lung adenocarcinoma | ||
| MIA: Minimally invasive adenocarcinoma |
| ∗log2FC in expression of this searched gene in stem-like cells from each diseased tissue sample relative to stem-like cells in normal samples in each tissue plotted against the malignancy continuum. Samples are colored based on if they are from different disease stage. |
Top |
Malignant transformation related pathway analysis |
| Find out the enriched GO biological processes and KEGG pathways involved in transition from healthy to precancer to cancer |
| Tissue | Disease Stage | Enriched GO biological Processes |
| Colorectum | AD |  |
| Colorectum | SER |  |
| Colorectum | MSS |  |
| Colorectum | MSI-H |  |
| Colorectum | FAP |  |
| ∗Top 15 enriched GO BP terms are showed in the bar plot of each disease state in each tissue. Each row represents a significant GO biological process which is colored according to the -log10(p.adjust). |
| Page: 1 2 3 4 5 6 7 8 9 |
| GO ID | Tissue | Disease Stage | Description | Gene Ratio | Bg Ratio | pvalue | p.adjust | Count |
| GO:00016553 | Liver | HCC | urogenital system development | 170/7958 | 338/18723 | 2.15e-03 | 1.08e-02 | 170 |
| GO:00219154 | Liver | HCC | neural tube development | 82/7958 | 152/18723 | 2.83e-03 | 1.33e-02 | 82 |
| GO:00018222 | Liver | HCC | kidney development | 148/7958 | 293/18723 | 3.25e-03 | 1.49e-02 | 148 |
| GO:00720012 | Liver | HCC | renal system development | 152/7958 | 302/18723 | 3.45e-03 | 1.56e-02 | 152 |
| GO:00016554 | Lung | IAC | urogenital system development | 59/2061 | 338/18723 | 2.27e-04 | 3.93e-03 | 59 |
| GO:1905515 | Lung | IAC | non-motile cilium assembly | 16/2061 | 61/18723 | 7.09e-04 | 9.50e-03 | 16 |
| GO:0060271 | Lung | IAC | cilium assembly | 55/2061 | 337/18723 | 1.84e-03 | 1.88e-02 | 55 |
| GO:00720014 | Lung | IAC | renal system development | 50/2061 | 302/18723 | 2.13e-03 | 2.11e-02 | 50 |
| GO:00219155 | Lung | IAC | neural tube development | 29/2061 | 152/18723 | 2.19e-03 | 2.15e-02 | 29 |
| GO:0044782 | Lung | IAC | cilium organization | 58/2061 | 368/18723 | 3.15e-03 | 2.75e-02 | 58 |
| GO:00018223 | Lung | IAC | kidney development | 48/2061 | 293/18723 | 3.19e-03 | 2.77e-02 | 48 |
| GO:000165511 | Lung | AIS | urogenital system development | 63/1849 | 338/18723 | 5.46e-07 | 4.08e-05 | 63 |
| GO:000182211 | Lung | AIS | kidney development | 53/1849 | 293/18723 | 1.04e-05 | 4.25e-04 | 53 |
| GO:007200111 | Lung | AIS | renal system development | 54/1849 | 302/18723 | 1.21e-05 | 4.71e-04 | 54 |
| GO:19055151 | Lung | AIS | non-motile cilium assembly | 15/1849 | 61/18723 | 6.88e-04 | 1.02e-02 | 15 |
| GO:002191511 | Lung | AIS | neural tube development | 28/1849 | 152/18723 | 8.81e-04 | 1.19e-02 | 28 |
| Page: 1 |
| Pathway ID | Tissue | Disease Stage | Description | Gene Ratio | Bg Ratio | pvalue | p.adjust | qvalue | Count |
| Page: 1 |
Top |
Cell-cell communication analysis |
| Identification of potential cell-cell interactions between two cell types and their ligand-receptor pairs for different disease states |
| Ligand | Receptor | LRpair | Pathway | Tissue | Disease Stage |
| Page: 1 |
Top |
Single-cell gene regulatory network inference analysis |
| Find out the significant the regulons (TFs) and the target genes of each regulon across cell types for different disease states |
| TF | Cell Type | Tissue | Disease Stage | Target Gene | RSS | Regulon Activity |
| ∗The dot plots of a searched regulon are shown for all cell subpopulations in each disease state of each tissue based on the regulon specific score inferred using pySCENIC and by calculating the average expression. |
| Page: 1 |
Top |
Somatic mutation of malignant transformation related genes |
| Annotation of somatic variants for genes involved in malignant transformation |
| Hugo Symbol | Variant Class | Variant Classification | dbSNP RS | HGVSc | HGVSp | HGVSp Short | SWISSPROT | BIOTYPE | SIFT | PolyPhen | Tumor Sample Barcode | Tissue | Histology | Sex | Age | Stage | Therapy Types | Drugs | Outcome |
| TBC1D32 | SNV | Missense_Mutation | rs761539336 | c.3035N>T | p.Gly1012Val | p.G1012V | Q96NH3 | protein_coding | deleterious(0) | probably_damaging(1) | TCGA-A2-A25C-01 | Breast | breast invasive carcinoma | Female | <65 | I/II | Chemotherapy | taxotere | SD |
| TBC1D32 | SNV | Missense_Mutation | rs374512287 | c.646G>A | p.Glu216Lys | p.E216K | Q96NH3 | protein_coding | tolerated(1) | benign(0.007) | TCGA-AN-A046-01 | Breast | breast invasive carcinoma | Female | >=65 | I/II | Unknown | Unknown | SD |
| TBC1D32 | SNV | Missense_Mutation | c.2714C>T | p.Ser905Leu | p.S905L | Q96NH3 | protein_coding | deleterious(0) | possibly_damaging(0.63) | TCGA-BH-A0C0-01 | Breast | breast invasive carcinoma | Female | <65 | I/II | Chemotherapy | carboplatin | SD | |
| TBC1D32 | SNV | Missense_Mutation | c.2468C>T | p.Pro823Leu | p.P823L | Q96NH3 | protein_coding | deleterious(0) | probably_damaging(0.983) | TCGA-D8-A1JA-01 | Breast | breast invasive carcinoma | Female | <65 | III/IV | Chemotherapy | adriamycin | PD | |
| TBC1D32 | SNV | Missense_Mutation | c.2545N>A | p.Glu849Lys | p.E849K | Q96NH3 | protein_coding | deleterious(0) | probably_damaging(0.97) | TCGA-D8-A1XB-01 | Breast | breast invasive carcinoma | Female | <65 | I/II | Unknown | Unknown | SD | |
| TBC1D32 | SNV | Missense_Mutation | c.544N>A | p.Asp182Asn | p.D182N | Q96NH3 | protein_coding | deleterious(0.03) | possibly_damaging(0.515) | TCGA-D8-A1XT-01 | Breast | breast invasive carcinoma | Female | <65 | I/II | Chemotherapy | adriamycin+cyclophosphamide | SD | |
| TBC1D32 | SNV | Missense_Mutation | novel | c.3465N>T | p.Gln1155His | p.Q1155H | Q96NH3 | protein_coding | deleterious(0) | probably_damaging(0.999) | TCGA-EW-A6SB-01 | Breast | breast invasive carcinoma | Female | <65 | I/II | Unknown | Unknown | SD |
| TBC1D32 | insertion | Frame_Shift_Ins | novel | c.388_389insCAAA | p.Glu130AlafsTer5 | p.E130Afs*5 | Q96NH3 | protein_coding | TCGA-AR-A0U0-01 | Breast | breast invasive carcinoma | Female | >=65 | I/II | Unknown | Unknown | SD | ||
| TBC1D32 | insertion | Frame_Shift_Ins | novel | c.387_388insAACGTAAAGGGACATAAAGA | p.Glu130AsnfsTer41 | p.E130Nfs*41 | Q96NH3 | protein_coding | TCGA-AR-A0U0-01 | Breast | breast invasive carcinoma | Female | >=65 | I/II | Unknown | Unknown | SD | ||
| TBC1D32 | SNV | Missense_Mutation | novel | c.539N>G | p.Gln180Arg | p.Q180R | Q96NH3 | protein_coding | tolerated(0.81) | benign(0.001) | TCGA-EA-A3Y4-01 | Cervix | cervical & endocervical cancer | Female | <65 | I/II | Unknown | Unknown | SD |
| Page: 1 2 3 4 5 6 7 8 9 10 11 12 13 14 15 16 17 |
Top |
Related drugs of malignant transformation related genes |
| Identification of chemicals and drugs interact with genes involved in malignant transfromation |
| (DGIdb 4.0) |
| Entrez ID | Symbol | Category | Interaction Types | Drug Claim Name | Drug Name | PMIDs |
| 221322 | TBC1D32 | KINASE | Bisphosphonates |
| Page: 1 |

Copyright 2023-Present -The University of Texas Health Science Center at Houston |