
|
|||||
|
 | |
| |
| |
| |
| |
| |
|
Gene: TBC1D25 |
Gene summary for TBC1D25 |
| Gene information | Species | Human | Gene symbol | TBC1D25 | Gene ID | 4943 |
| Gene name | TBC1 domain family member 25 | |
| Gene Alias | MG81 | |
| Cytomap | Xp11.23 | |
| Gene Type | protein-coding | GO ID | GO:0006810 | UniProtAcc | Q3MII6 |
Top |
Malignant transformation analysis |
| Identification of the aberrant gene expression in precancerous and cancerous lesions by comparing the gene expression of stem-like cells in diseased tissues with normal stem cells |
| Entrez ID | Symbol | Replicates | Species | Organ | Tissue | Adj P-value | Log2FC | Malignancy |
| 4943 | TBC1D25 | LZE4T | Human | Esophagus | ESCC | 8.10e-07 | 1.78e-01 | 0.0811 |
| 4943 | TBC1D25 | LZE7T | Human | Esophagus | ESCC | 4.46e-03 | 1.33e-01 | 0.0667 |
| 4943 | TBC1D25 | LZE24T | Human | Esophagus | ESCC | 2.07e-10 | 1.68e-01 | 0.0596 |
| 4943 | TBC1D25 | P1T-E | Human | Esophagus | ESCC | 2.35e-05 | 1.78e-01 | 0.0875 |
| 4943 | TBC1D25 | P2T-E | Human | Esophagus | ESCC | 3.38e-10 | 2.33e-01 | 0.1177 |
| 4943 | TBC1D25 | P4T-E | Human | Esophagus | ESCC | 2.54e-21 | 2.35e-01 | 0.1323 |
| 4943 | TBC1D25 | P8T-E | Human | Esophagus | ESCC | 3.35e-13 | 2.17e-01 | 0.0889 |
| 4943 | TBC1D25 | P9T-E | Human | Esophagus | ESCC | 4.53e-08 | 1.83e-01 | 0.1131 |
| 4943 | TBC1D25 | P10T-E | Human | Esophagus | ESCC | 3.55e-05 | 5.34e-02 | 0.116 |
| 4943 | TBC1D25 | P11T-E | Human | Esophagus | ESCC | 2.95e-05 | 2.07e-01 | 0.1426 |
| 4943 | TBC1D25 | P12T-E | Human | Esophagus | ESCC | 2.11e-09 | 1.25e-01 | 0.1122 |
| 4943 | TBC1D25 | P15T-E | Human | Esophagus | ESCC | 1.17e-15 | 2.40e-01 | 0.1149 |
| 4943 | TBC1D25 | P16T-E | Human | Esophagus | ESCC | 3.55e-10 | 2.49e-01 | 0.1153 |
| 4943 | TBC1D25 | P17T-E | Human | Esophagus | ESCC | 1.14e-03 | 1.62e-01 | 0.1278 |
| 4943 | TBC1D25 | P20T-E | Human | Esophagus | ESCC | 1.92e-10 | 2.52e-01 | 0.1124 |
| 4943 | TBC1D25 | P21T-E | Human | Esophagus | ESCC | 4.27e-10 | 2.30e-01 | 0.1617 |
| 4943 | TBC1D25 | P22T-E | Human | Esophagus | ESCC | 4.02e-16 | 3.42e-01 | 0.1236 |
| 4943 | TBC1D25 | P23T-E | Human | Esophagus | ESCC | 2.97e-11 | 2.79e-01 | 0.108 |
| 4943 | TBC1D25 | P24T-E | Human | Esophagus | ESCC | 1.82e-04 | 6.15e-02 | 0.1287 |
| 4943 | TBC1D25 | P26T-E | Human | Esophagus | ESCC | 6.73e-20 | 4.43e-01 | 0.1276 |
| Page: 1 2 3 4 |
| Tissue | Expression Dynamics | Abbreviation |
| Esophagus | 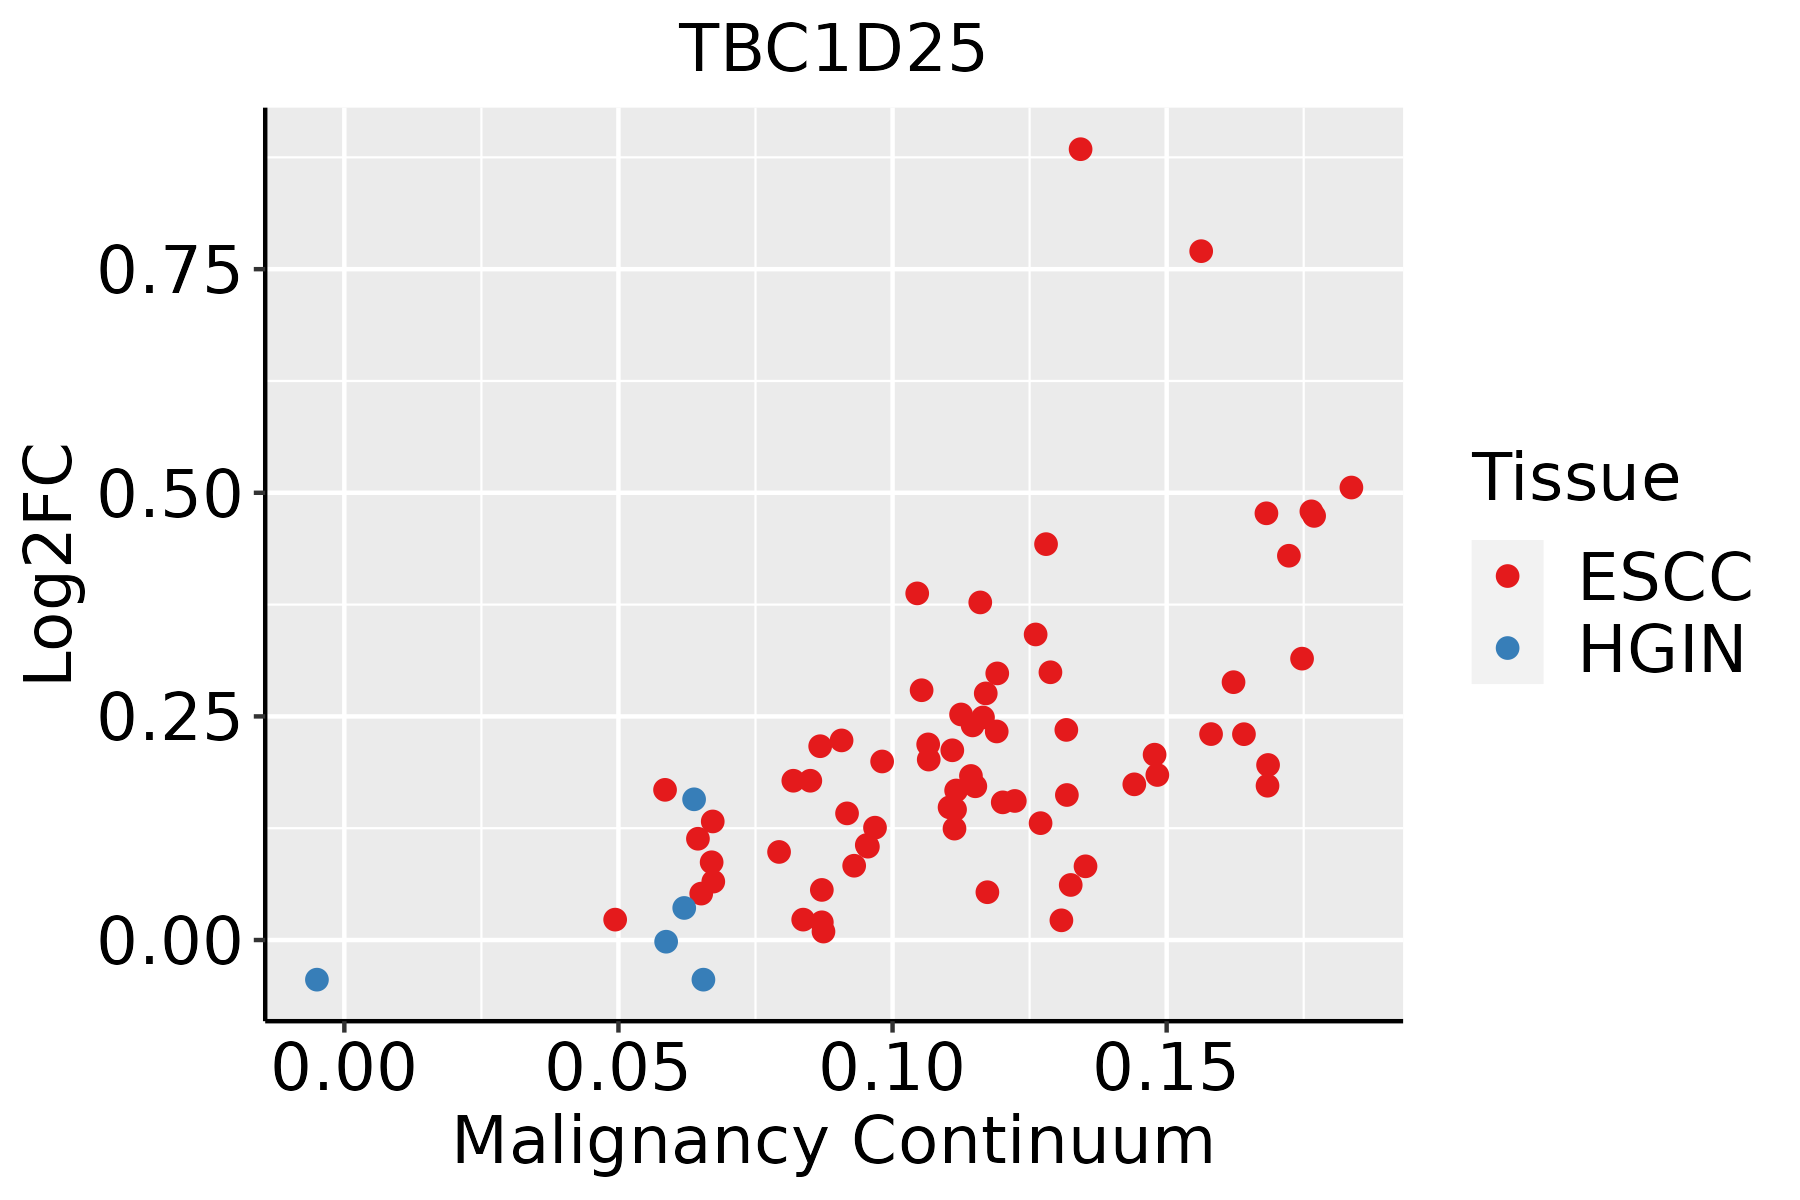 | ESCC: Esophageal squamous cell carcinoma |
| HGIN: High-grade intraepithelial neoplasias | ||
| LGIN: Low-grade intraepithelial neoplasias | ||
| Oral Cavity | 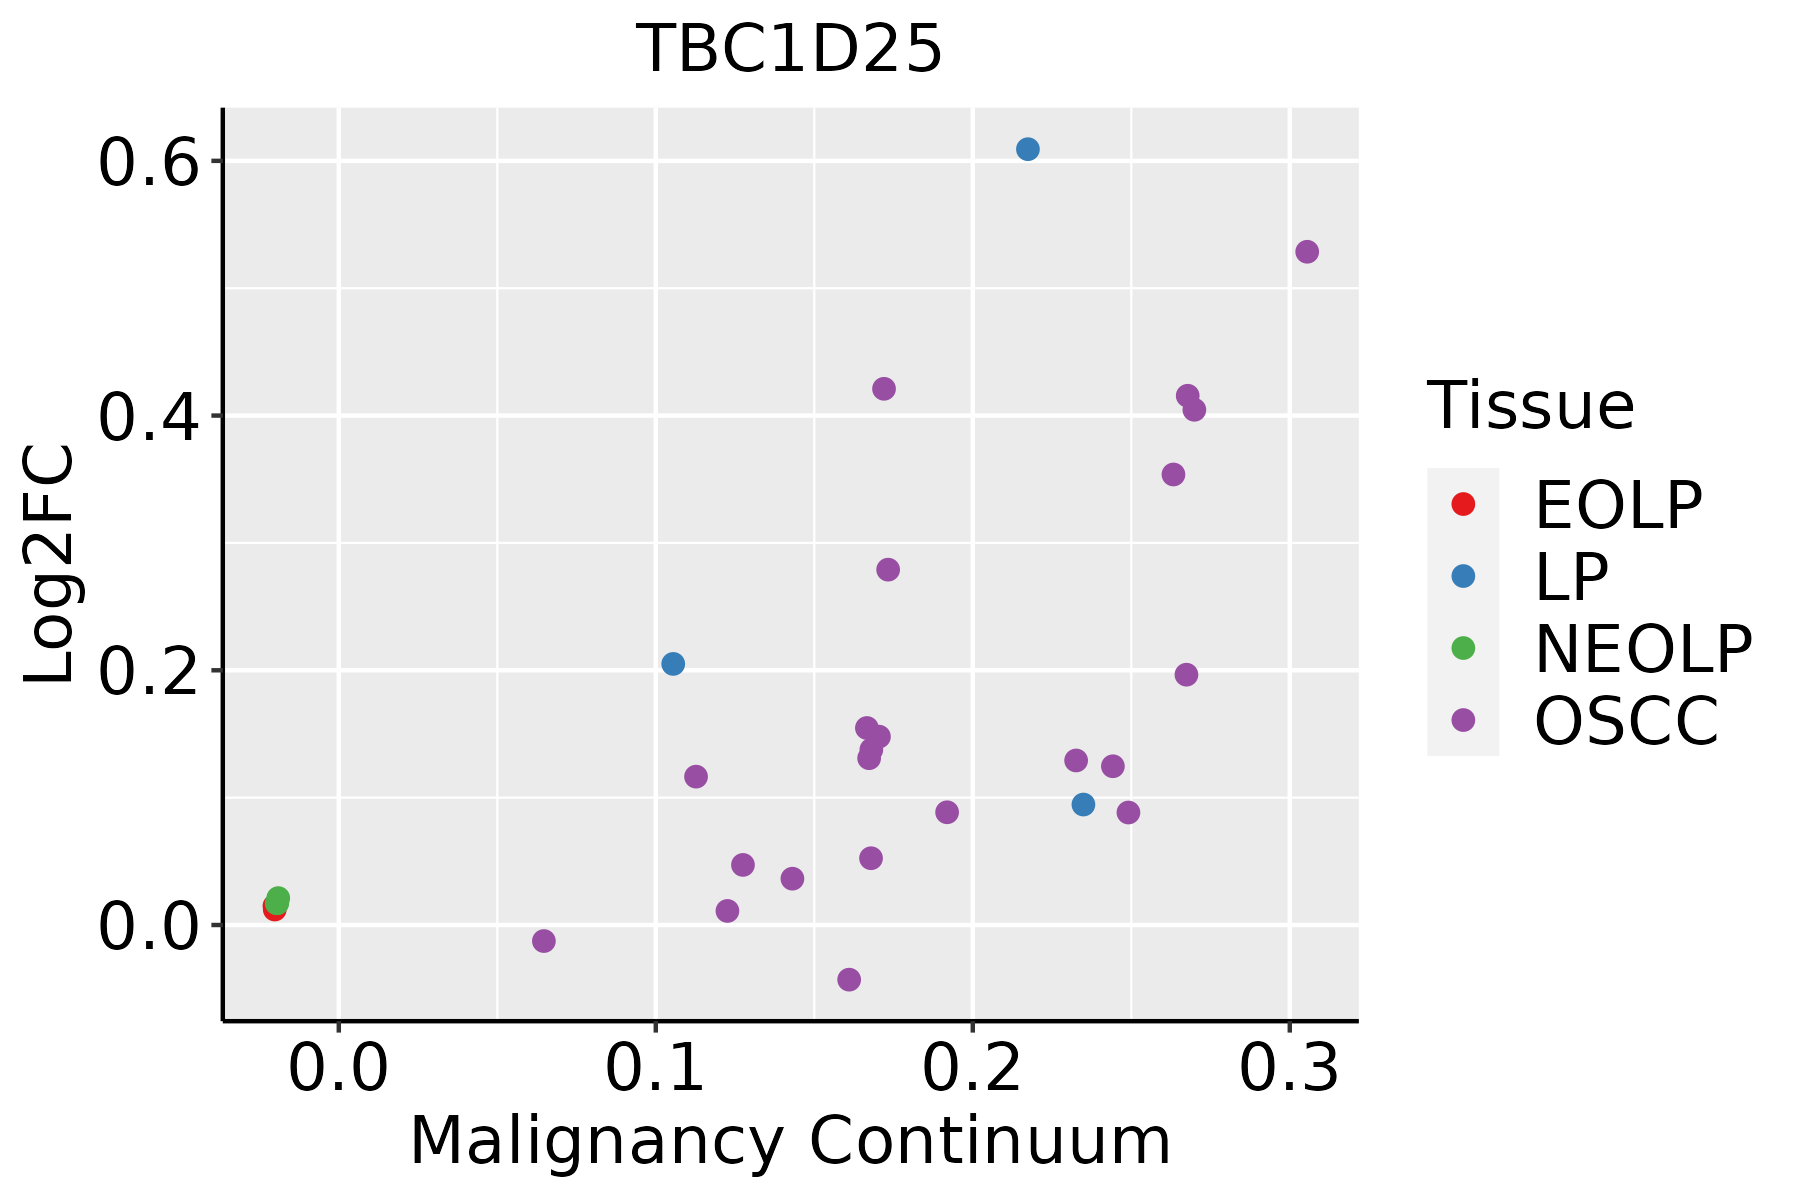 | EOLP: Erosive Oral lichen planus |
| LP: leukoplakia | ||
| NEOLP: Non-erosive oral lichen planus | ||
| OSCC: Oral squamous cell carcinoma |
| ∗log2FC in expression of this searched gene in stem-like cells from each diseased tissue sample relative to stem-like cells in normal samples in each tissue plotted against the malignancy continuum. Samples are colored based on if they are from different disease stage. |
Top |
Malignant transformation related pathway analysis |
| Find out the enriched GO biological processes and KEGG pathways involved in transition from healthy to precancer to cancer |
| Tissue | Disease Stage | Enriched GO biological Processes |
| Colorectum | AD |  |
| Colorectum | SER |  |
| Colorectum | MSS |  |
| Colorectum | MSI-H |  |
| Colorectum | FAP |  |
| ∗Top 15 enriched GO BP terms are showed in the bar plot of each disease state in each tissue. Each row represents a significant GO biological process which is colored according to the -log10(p.adjust). |
| Page: 1 2 3 4 5 6 7 8 9 |
| GO ID | Tissue | Disease Stage | Description | Gene Ratio | Bg Ratio | pvalue | p.adjust | Count |
| GO:001623617 | Esophagus | ESCC | macroautophagy | 216/8552 | 291/18723 | 1.94e-23 | 4.57e-21 | 216 |
| GO:0022411111 | Esophagus | ESCC | cellular component disassembly | 305/8552 | 443/18723 | 1.94e-23 | 4.57e-21 | 305 |
| GO:001050617 | Esophagus | ESCC | regulation of autophagy | 220/8552 | 317/18723 | 6.72e-18 | 6.36e-16 | 220 |
| GO:003298416 | Esophagus | ESCC | protein-containing complex disassembly | 151/8552 | 224/18723 | 3.45e-11 | 1.15e-09 | 151 |
| GO:001624114 | Esophagus | ESCC | regulation of macroautophagy | 102/8552 | 141/18723 | 1.09e-10 | 3.27e-09 | 102 |
| GO:00973523 | Esophagus | ESCC | autophagosome maturation | 31/8552 | 40/18723 | 4.04e-05 | 3.26e-04 | 31 |
| GO:00432446 | Esophagus | ESCC | regulation of protein-containing complex disassembly | 75/8552 | 121/18723 | 2.17e-04 | 1.36e-03 | 75 |
| GO:004308715 | Esophagus | ESCC | regulation of GTPase activity | 183/8552 | 348/18723 | 5.34e-03 | 2.00e-02 | 183 |
| GO:002241119 | Oral cavity | OSCC | cellular component disassembly | 283/7305 | 443/18723 | 9.57e-27 | 3.37e-24 | 283 |
| GO:001623610 | Oral cavity | OSCC | macroautophagy | 192/7305 | 291/18723 | 7.01e-21 | 1.14e-18 | 192 |
| GO:001050610 | Oral cavity | OSCC | regulation of autophagy | 198/7305 | 317/18723 | 1.63e-17 | 1.51e-15 | 198 |
| GO:00162417 | Oral cavity | OSCC | regulation of macroautophagy | 96/7305 | 141/18723 | 2.33e-12 | 9.75e-11 | 96 |
| GO:003298410 | Oral cavity | OSCC | protein-containing complex disassembly | 136/7305 | 224/18723 | 3.42e-11 | 1.13e-09 | 136 |
| GO:00973522 | Oral cavity | OSCC | autophagosome maturation | 28/7305 | 40/18723 | 7.00e-05 | 5.60e-04 | 28 |
| GO:00432445 | Oral cavity | OSCC | regulation of protein-containing complex disassembly | 65/7305 | 121/18723 | 7.08e-04 | 3.90e-03 | 65 |
| GO:004308710 | Oral cavity | OSCC | regulation of GTPase activity | 165/7305 | 348/18723 | 7.94e-04 | 4.27e-03 | 165 |
| GO:001623615 | Oral cavity | LP | macroautophagy | 135/4623 | 291/18723 | 4.71e-16 | 6.70e-14 | 135 |
| GO:0022411110 | Oral cavity | LP | cellular component disassembly | 173/4623 | 443/18723 | 9.97e-12 | 7.44e-10 | 173 |
| GO:001050615 | Oral cavity | LP | regulation of autophagy | 132/4623 | 317/18723 | 1.82e-11 | 1.28e-09 | 132 |
| GO:001624113 | Oral cavity | LP | regulation of macroautophagy | 61/4623 | 141/18723 | 1.00e-06 | 2.50e-05 | 61 |
| Page: 1 2 |
| Pathway ID | Tissue | Disease Stage | Description | Gene Ratio | Bg Ratio | pvalue | p.adjust | qvalue | Count |
| Page: 1 |
Top |
Cell-cell communication analysis |
| Identification of potential cell-cell interactions between two cell types and their ligand-receptor pairs for different disease states |
| Ligand | Receptor | LRpair | Pathway | Tissue | Disease Stage |
| Page: 1 |
Top |
Single-cell gene regulatory network inference analysis |
| Find out the significant the regulons (TFs) and the target genes of each regulon across cell types for different disease states |
| TF | Cell Type | Tissue | Disease Stage | Target Gene | RSS | Regulon Activity |
| ∗The dot plots of a searched regulon are shown for all cell subpopulations in each disease state of each tissue based on the regulon specific score inferred using pySCENIC and by calculating the average expression. |
| Page: 1 |
Top |
Somatic mutation of malignant transformation related genes |
| Annotation of somatic variants for genes involved in malignant transformation |
| Hugo Symbol | Variant Class | Variant Classification | dbSNP RS | HGVSc | HGVSp | HGVSp Short | SWISSPROT | BIOTYPE | SIFT | PolyPhen | Tumor Sample Barcode | Tissue | Histology | Sex | Age | Stage | Therapy Types | Drugs | Outcome |
| TBC1D25 | SNV | Missense_Mutation | c.1645C>G | p.Pro549Ala | p.P549A | Q3MII6 | protein_coding | tolerated(0.44) | benign(0.045) | TCGA-A7-A0CE-01 | Breast | breast invasive carcinoma | Female | <65 | I/II | Chemotherapy | adriamycin | SD | |
| TBC1D25 | SNV | Missense_Mutation | c.158N>T | p.Ser53Phe | p.S53F | Q3MII6 | protein_coding | deleterious(0.01) | possibly_damaging(0.758) | TCGA-A8-A09Z-01 | Breast | breast invasive carcinoma | Female | >=65 | I/II | Unknown | Unknown | SD | |
| TBC1D25 | SNV | Missense_Mutation | c.1697N>A | p.Pro566Gln | p.P566Q | Q3MII6 | protein_coding | deleterious(0.04) | benign(0.169) | TCGA-A8-A09Z-01 | Breast | breast invasive carcinoma | Female | >=65 | I/II | Unknown | Unknown | SD | |
| TBC1D25 | SNV | Missense_Mutation | novel | c.1298C>T | p.Ser433Leu | p.S433L | Q3MII6 | protein_coding | deleterious(0.01) | benign(0.259) | TCGA-AN-A046-01 | Breast | breast invasive carcinoma | Female | >=65 | I/II | Unknown | Unknown | SD |
| TBC1D25 | SNV | Missense_Mutation | c.1930N>A | p.Ala644Thr | p.A644T | Q3MII6 | protein_coding | deleterious(0) | probably_damaging(0.994) | TCGA-AN-A0AK-01 | Breast | breast invasive carcinoma | Female | >=65 | I/II | Unknown | Unknown | SD | |
| TBC1D25 | SNV | Missense_Mutation | novel | c.1070N>A | p.Gly357Asp | p.G357D | Q3MII6 | protein_coding | deleterious(0) | probably_damaging(0.949) | TCGA-BH-A18P-01 | Breast | breast invasive carcinoma | Female | <65 | I/II | Unknown | Unknown | PD |
| TBC1D25 | SNV | Missense_Mutation | c.835G>A | p.Glu279Lys | p.E279K | Q3MII6 | protein_coding | tolerated(0.09) | benign(0.354) | TCGA-E2-A159-01 | Breast | breast invasive carcinoma | Female | <65 | I/II | Chemotherapy | cyclophosphamide | SD | |
| TBC1D25 | SNV | Missense_Mutation | c.1008N>A | p.Asp336Glu | p.D336E | Q3MII6 | protein_coding | deleterious(0) | probably_damaging(0.999) | TCGA-E2-A15M-01 | Breast | breast invasive carcinoma | Female | >=65 | I/II | Hormone Therapy | arimidex | SD | |
| TBC1D25 | SNV | Missense_Mutation | c.1454N>C | p.Val485Ala | p.V485A | Q3MII6 | protein_coding | tolerated(0.38) | benign(0.027) | TCGA-E9-A1N8-01 | Breast | breast invasive carcinoma | Female | <65 | I/II | Chemotherapy | doxorubicin | SD | |
| TBC1D25 | SNV | Missense_Mutation | c.98N>A | p.Arg33Gln | p.R33Q | Q3MII6 | protein_coding | tolerated(0.09) | benign(0.028) | TCGA-EW-A1IZ-01 | Breast | breast invasive carcinoma | Female | <65 | III/IV | Chemotherapy | taxotere | SD |
| Page: 1 2 3 4 5 6 7 8 9 10 11 |
Top |
Related drugs of malignant transformation related genes |
| Identification of chemicals and drugs interact with genes involved in malignant transfromation |
| (DGIdb 4.0) |
| Entrez ID | Symbol | Category | Interaction Types | Drug Claim Name | Drug Name | PMIDs |
| Page: 1 |

Copyright 2023-Present -The University of Texas Health Science Center at Houston |