
|
|||||
|
 | |
| |
| |
| |
| |
| |
|
Gene: TBC1D24 |
Gene summary for TBC1D24 |
| Gene information | Species | Human | Gene symbol | TBC1D24 | Gene ID | 57465 |
| Gene name | TBC1 domain family member 24 | |
| Gene Alias | DEE16 | |
| Cytomap | 16p13.3 | |
| Gene Type | protein-coding | GO ID | GO:0006950 | UniProtAcc | Q9ULP9 |
Top |
Malignant transformation analysis |
| Identification of the aberrant gene expression in precancerous and cancerous lesions by comparing the gene expression of stem-like cells in diseased tissues with normal stem cells |
| Entrez ID | Symbol | Replicates | Species | Organ | Tissue | Adj P-value | Log2FC | Malignancy |
| 57465 | TBC1D24 | HCC1_Meng | Human | Liver | HCC | 1.11e-17 | 1.70e-02 | 0.0246 |
| 57465 | TBC1D24 | HCC2_Meng | Human | Liver | HCC | 7.75e-03 | 2.59e-02 | 0.0107 |
| 57465 | TBC1D24 | cirrhotic3 | Human | Liver | Cirrhotic | 3.53e-02 | 4.97e-02 | 0.0215 |
| 57465 | TBC1D24 | HCC1 | Human | Liver | HCC | 3.55e-04 | 1.28e+00 | 0.5336 |
| 57465 | TBC1D24 | HCC2 | Human | Liver | HCC | 3.46e-02 | 1.64e+00 | 0.5341 |
| 57465 | TBC1D24 | S014 | Human | Liver | HCC | 7.39e-11 | 1.72e-01 | 0.2254 |
| 57465 | TBC1D24 | S015 | Human | Liver | HCC | 1.89e-04 | 1.38e-01 | 0.2375 |
| 57465 | TBC1D24 | S016 | Human | Liver | HCC | 6.82e-07 | 1.32e-01 | 0.2243 |
| 57465 | TBC1D24 | S028 | Human | Liver | HCC | 3.52e-19 | 3.84e-01 | 0.2503 |
| 57465 | TBC1D24 | S029 | Human | Liver | HCC | 1.20e-05 | 2.82e-01 | 0.2581 |
| Page: 1 |
| Tissue | Expression Dynamics | Abbreviation |
| Liver | 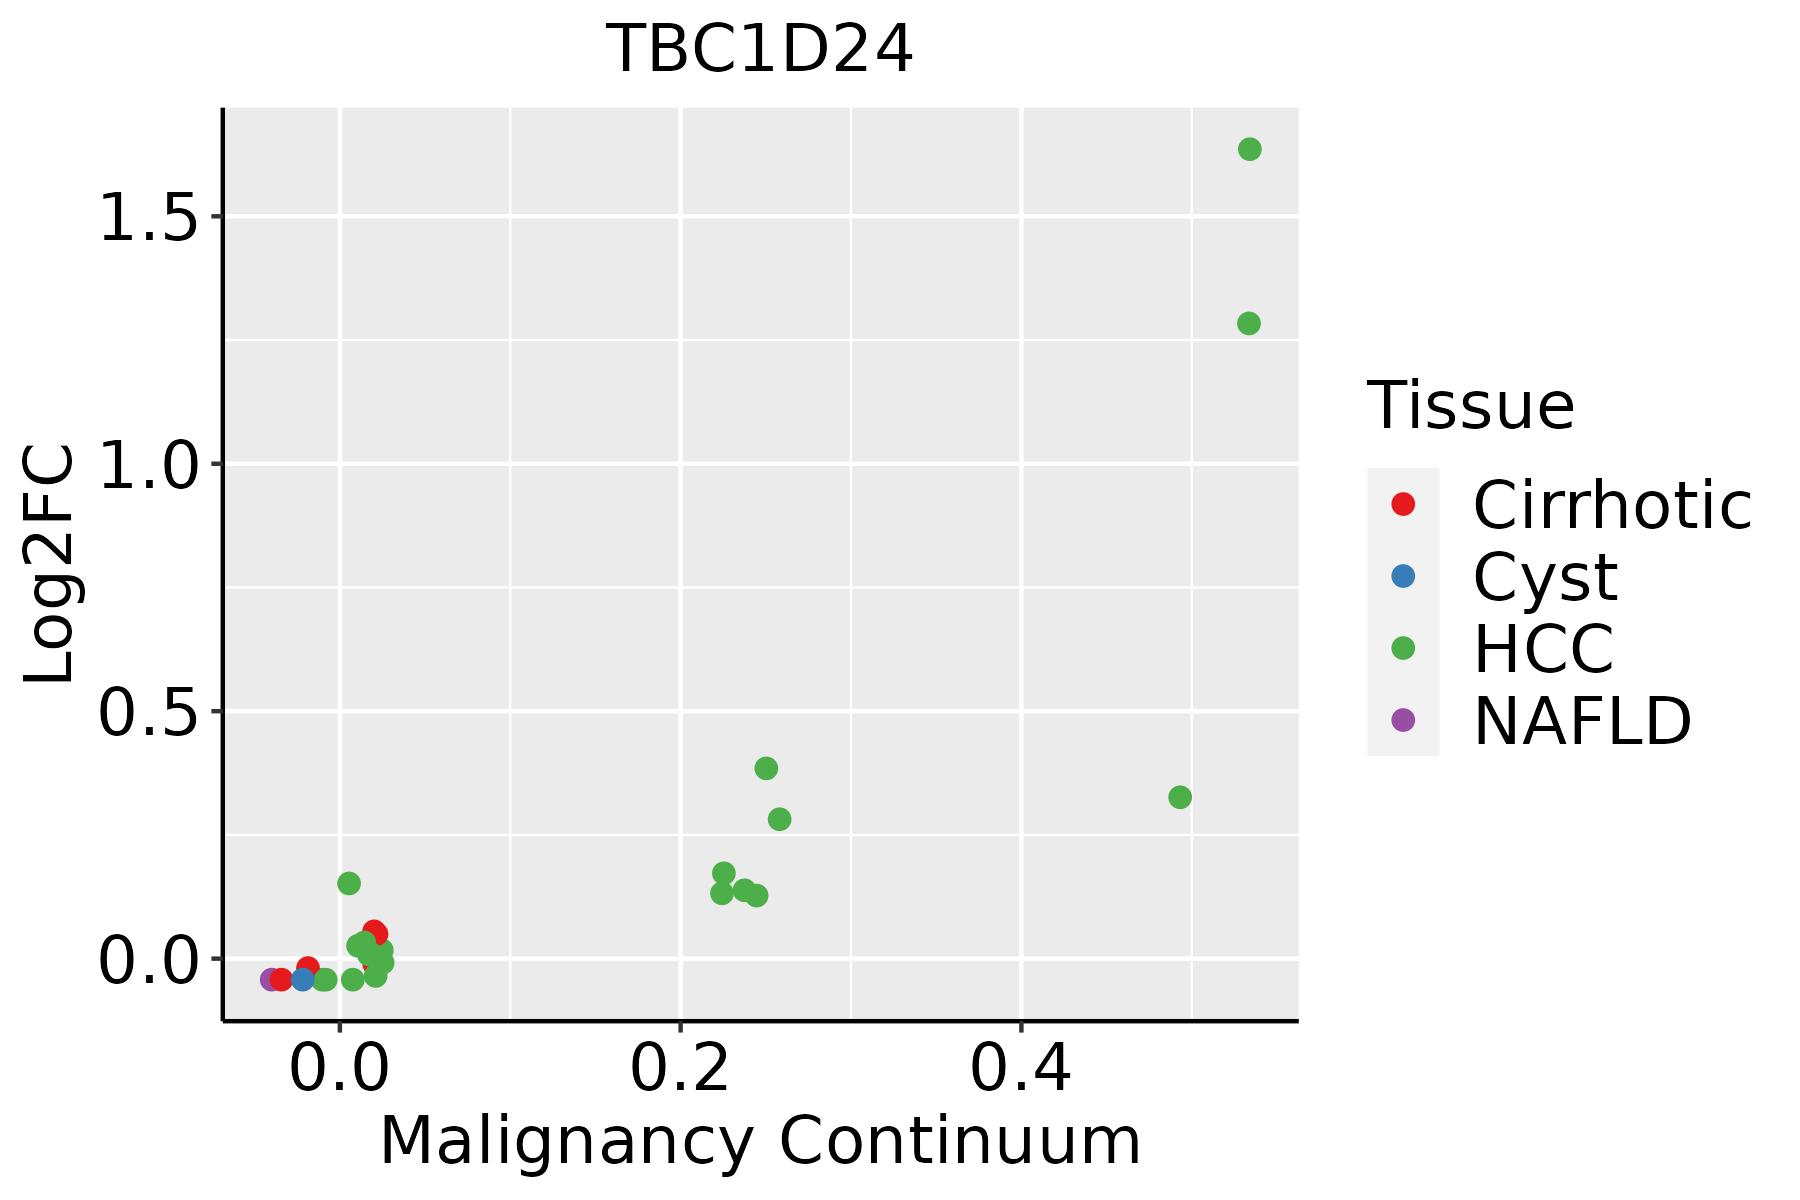 | HCC: Hepatocellular carcinoma |
| NAFLD: Non-alcoholic fatty liver disease |
| ∗log2FC in expression of this searched gene in stem-like cells from each diseased tissue sample relative to stem-like cells in normal samples in each tissue plotted against the malignancy continuum. Samples are colored based on if they are from different disease stage. |
Top |
Malignant transformation related pathway analysis |
| Find out the enriched GO biological processes and KEGG pathways involved in transition from healthy to precancer to cancer |
| Tissue | Disease Stage | Enriched GO biological Processes |
| Colorectum | AD |  |
| Colorectum | SER |  |
| Colorectum | MSS |  |
| Colorectum | MSI-H |  |
| Colorectum | FAP |  |
| ∗Top 15 enriched GO BP terms are showed in the bar plot of each disease state in each tissue. Each row represents a significant GO biological process which is colored according to the -log10(p.adjust). |
| Page: 1 2 3 4 5 6 7 8 9 |
| GO ID | Tissue | Disease Stage | Description | Gene Ratio | Bg Ratio | pvalue | p.adjust | Count |
| GO:000697912 | Liver | Cirrhotic | response to oxidative stress | 196/4634 | 446/18723 | 2.80e-19 | 5.86e-17 | 196 |
| GO:006219712 | Liver | Cirrhotic | cellular response to chemical stress | 147/4634 | 337/18723 | 1.84e-14 | 1.72e-12 | 147 |
| GO:003459912 | Liver | Cirrhotic | cellular response to oxidative stress | 127/4634 | 288/18723 | 4.29e-13 | 3.32e-11 | 127 |
| GO:007099712 | Liver | Cirrhotic | neuron death | 141/4634 | 361/18723 | 9.56e-10 | 4.38e-08 | 141 |
| GO:00364737 | Liver | Cirrhotic | cell death in response to oxidative stress | 43/4634 | 95/18723 | 1.03e-05 | 1.48e-04 | 43 |
| GO:00364755 | Liver | Cirrhotic | neuron death in response to oxidative stress | 17/4634 | 31/18723 | 3.19e-04 | 2.77e-03 | 17 |
| GO:000697922 | Liver | HCC | response to oxidative stress | 281/7958 | 446/18723 | 9.75e-19 | 1.24e-16 | 281 |
| GO:006219722 | Liver | HCC | cellular response to chemical stress | 216/7958 | 337/18723 | 6.86e-16 | 5.44e-14 | 216 |
| GO:003459922 | Liver | HCC | cellular response to oxidative stress | 183/7958 | 288/18723 | 3.65e-13 | 1.93e-11 | 183 |
| GO:007099722 | Liver | HCC | neuron death | 202/7958 | 361/18723 | 1.44e-07 | 2.70e-06 | 202 |
| GO:003647511 | Liver | HCC | neuron death in response to oxidative stress | 22/7958 | 31/18723 | 1.27e-03 | 6.92e-03 | 22 |
| GO:003647312 | Liver | HCC | cell death in response to oxidative stress | 55/7958 | 95/18723 | 1.76e-03 | 9.12e-03 | 55 |
| Page: 1 |
| Pathway ID | Tissue | Disease Stage | Description | Gene Ratio | Bg Ratio | pvalue | p.adjust | qvalue | Count |
| Page: 1 |
Top |
Cell-cell communication analysis |
| Identification of potential cell-cell interactions between two cell types and their ligand-receptor pairs for different disease states |
| Ligand | Receptor | LRpair | Pathway | Tissue | Disease Stage |
| Page: 1 |
Top |
Single-cell gene regulatory network inference analysis |
| Find out the significant the regulons (TFs) and the target genes of each regulon across cell types for different disease states |
| TF | Cell Type | Tissue | Disease Stage | Target Gene | RSS | Regulon Activity |
| ∗The dot plots of a searched regulon are shown for all cell subpopulations in each disease state of each tissue based on the regulon specific score inferred using pySCENIC and by calculating the average expression. |
| Page: 1 |
Top |
Somatic mutation of malignant transformation related genes |
| Annotation of somatic variants for genes involved in malignant transformation |
| Hugo Symbol | Variant Class | Variant Classification | dbSNP RS | HGVSc | HGVSp | HGVSp Short | SWISSPROT | BIOTYPE | SIFT | PolyPhen | Tumor Sample Barcode | Tissue | Histology | Sex | Age | Stage | Therapy Types | Drugs | Outcome |
| TBC1D24 | SNV | Missense_Mutation | novel | c.488A>G | p.Asp163Gly | p.D163G | Q9ULP9 | protein_coding | deleterious(0.01) | possibly_damaging(0.582) | TCGA-AN-A046-01 | Breast | breast invasive carcinoma | Female | >=65 | I/II | Unknown | Unknown | SD |
| TBC1D24 | SNV | Missense_Mutation | c.104T>C | p.Leu35Pro | p.L35P | Q9ULP9 | protein_coding | deleterious(0) | probably_damaging(0.959) | TCGA-D8-A1XQ-01 | Breast | breast invasive carcinoma | Female | >=65 | I/II | Unknown | Unknown | SD | |
| TBC1D24 | insertion | Nonsense_Mutation | novel | c.709_710insGAACTCTATCTCTAGCCTCTCATTACTC | p.Tyr237Ter | p.Y237* | Q9ULP9 | protein_coding | TCGA-A8-A09C-01 | Breast | breast invasive carcinoma | Female | >=65 | I/II | Unknown | Unknown | SD | ||
| TBC1D24 | SNV | Missense_Mutation | rs398122966 | c.118C>T | p.Arg40Cys | p.R40C | Q9ULP9 | protein_coding | deleterious(0) | probably_damaging(1) | TCGA-FU-A3NI-01 | Cervix | cervical & endocervical cancer | Female | <65 | I/II | Unknown | Unknown | SD |
| TBC1D24 | SNV | Missense_Mutation | c.240N>C | p.Lys80Asn | p.K80N | Q9ULP9 | protein_coding | tolerated(0.23) | benign(0.129) | TCGA-LP-A5U2-01 | Cervix | cervical & endocervical cancer | Female | <65 | III/IV | Unknown | Unknown | SD | |
| TBC1D24 | SNV | Missense_Mutation | rs368575199 | c.340G>A | p.Val114Met | p.V114M | Q9ULP9 | protein_coding | deleterious(0.02) | probably_damaging(0.988) | TCGA-AA-3685-01 | Colorectum | colon adenocarcinoma | Male | >=65 | I/II | Unknown | Unknown | SD |
| TBC1D24 | SNV | Missense_Mutation | rs483352866 | c.533C>T | p.Ser178Leu | p.S178L | Q9ULP9 | protein_coding | deleterious(0.01) | possibly_damaging(0.636) | TCGA-CK-6746-01 | Colorectum | colon adenocarcinoma | Female | >=65 | I/II | Unknown | Unknown | SD |
| TBC1D24 | SNV | Missense_Mutation | rs746963974 | c.599N>T | p.Ala200Val | p.A200V | Q9ULP9 | protein_coding | deleterious(0.03) | possibly_damaging(0.543) | TCGA-D5-6530-01 | Colorectum | colon adenocarcinoma | Male | <65 | I/II | Unknown | Unknown | SD |
| TBC1D24 | SNV | Missense_Mutation | rs537705878 | c.601G>A | p.Val201Met | p.V201M | Q9ULP9 | protein_coding | tolerated(0.13) | possibly_damaging(0.563) | TCGA-D5-6930-01 | Colorectum | colon adenocarcinoma | Male | >=65 | I/II | Unknown | Unknown | SD |
| TBC1D24 | SNV | Missense_Mutation | rs886051844 | c.151N>T | p.Arg51Trp | p.R51W | Q9ULP9 | protein_coding | deleterious(0) | probably_damaging(1) | TCGA-F4-6570-01 | Colorectum | colon adenocarcinoma | Female | >=65 | I/II | Unknown | Unknown | SD |
| Page: 1 2 3 4 5 |
Top |
Related drugs of malignant transformation related genes |
| Identification of chemicals and drugs interact with genes involved in malignant transfromation |
| (DGIdb 4.0) |
| Entrez ID | Symbol | Category | Interaction Types | Drug Claim Name | Drug Name | PMIDs |
| Page: 1 |

Copyright 2023-Present -The University of Texas Health Science Center at Houston |