
|
|||||
|
 | |
| |
| |
| |
| |
| |
|
Gene: TBC1D23 |
Gene summary for TBC1D23 |
| Gene information | Species | Human | Gene symbol | TBC1D23 | Gene ID | 55773 |
| Gene name | TBC1 domain family member 23 | |
| Gene Alias | NS4ATP1 | |
| Cytomap | 3q12.1-q12.2 | |
| Gene Type | protein-coding | GO ID | GO:0006810 | UniProtAcc | Q9NUY8 |
Top |
Malignant transformation analysis |
| Identification of the aberrant gene expression in precancerous and cancerous lesions by comparing the gene expression of stem-like cells in diseased tissues with normal stem cells |
| Entrez ID | Symbol | Replicates | Species | Organ | Tissue | Adj P-value | Log2FC | Malignancy |
| 55773 | TBC1D23 | LZE4T | Human | Esophagus | ESCC | 1.02e-09 | 4.50e-01 | 0.0811 |
| 55773 | TBC1D23 | LZE5T | Human | Esophagus | ESCC | 1.98e-03 | 1.71e-01 | 0.0514 |
| 55773 | TBC1D23 | LZE8T | Human | Esophagus | ESCC | 9.40e-12 | 2.26e-01 | 0.067 |
| 55773 | TBC1D23 | LZE20T | Human | Esophagus | ESCC | 1.54e-05 | 1.80e-01 | 0.0662 |
| 55773 | TBC1D23 | LZE24T | Human | Esophagus | ESCC | 1.28e-11 | 3.98e-01 | 0.0596 |
| 55773 | TBC1D23 | LZE6T | Human | Esophagus | ESCC | 1.12e-03 | 9.10e-02 | 0.0845 |
| 55773 | TBC1D23 | P1T-E | Human | Esophagus | ESCC | 1.05e-03 | 2.50e-01 | 0.0875 |
| 55773 | TBC1D23 | P2T-E | Human | Esophagus | ESCC | 1.33e-19 | 2.64e-01 | 0.1177 |
| 55773 | TBC1D23 | P4T-E | Human | Esophagus | ESCC | 8.47e-09 | 2.47e-01 | 0.1323 |
| 55773 | TBC1D23 | P5T-E | Human | Esophagus | ESCC | 3.98e-20 | 2.81e-01 | 0.1327 |
| 55773 | TBC1D23 | P8T-E | Human | Esophagus | ESCC | 2.04e-27 | 5.30e-01 | 0.0889 |
| 55773 | TBC1D23 | P9T-E | Human | Esophagus | ESCC | 6.88e-20 | 3.87e-01 | 0.1131 |
| 55773 | TBC1D23 | P10T-E | Human | Esophagus | ESCC | 3.28e-33 | 5.73e-01 | 0.116 |
| 55773 | TBC1D23 | P11T-E | Human | Esophagus | ESCC | 2.69e-12 | 3.97e-01 | 0.1426 |
| 55773 | TBC1D23 | P12T-E | Human | Esophagus | ESCC | 1.12e-11 | 2.56e-01 | 0.1122 |
| 55773 | TBC1D23 | P15T-E | Human | Esophagus | ESCC | 3.51e-17 | 4.14e-01 | 0.1149 |
| 55773 | TBC1D23 | P16T-E | Human | Esophagus | ESCC | 7.78e-22 | 4.67e-01 | 0.1153 |
| 55773 | TBC1D23 | P17T-E | Human | Esophagus | ESCC | 2.25e-03 | 2.63e-01 | 0.1278 |
| 55773 | TBC1D23 | P19T-E | Human | Esophagus | ESCC | 4.77e-07 | 5.68e-01 | 0.1662 |
| 55773 | TBC1D23 | P20T-E | Human | Esophagus | ESCC | 3.15e-19 | 3.72e-01 | 0.1124 |
| Page: 1 2 3 4 5 |
| Tissue | Expression Dynamics | Abbreviation |
| Esophagus | 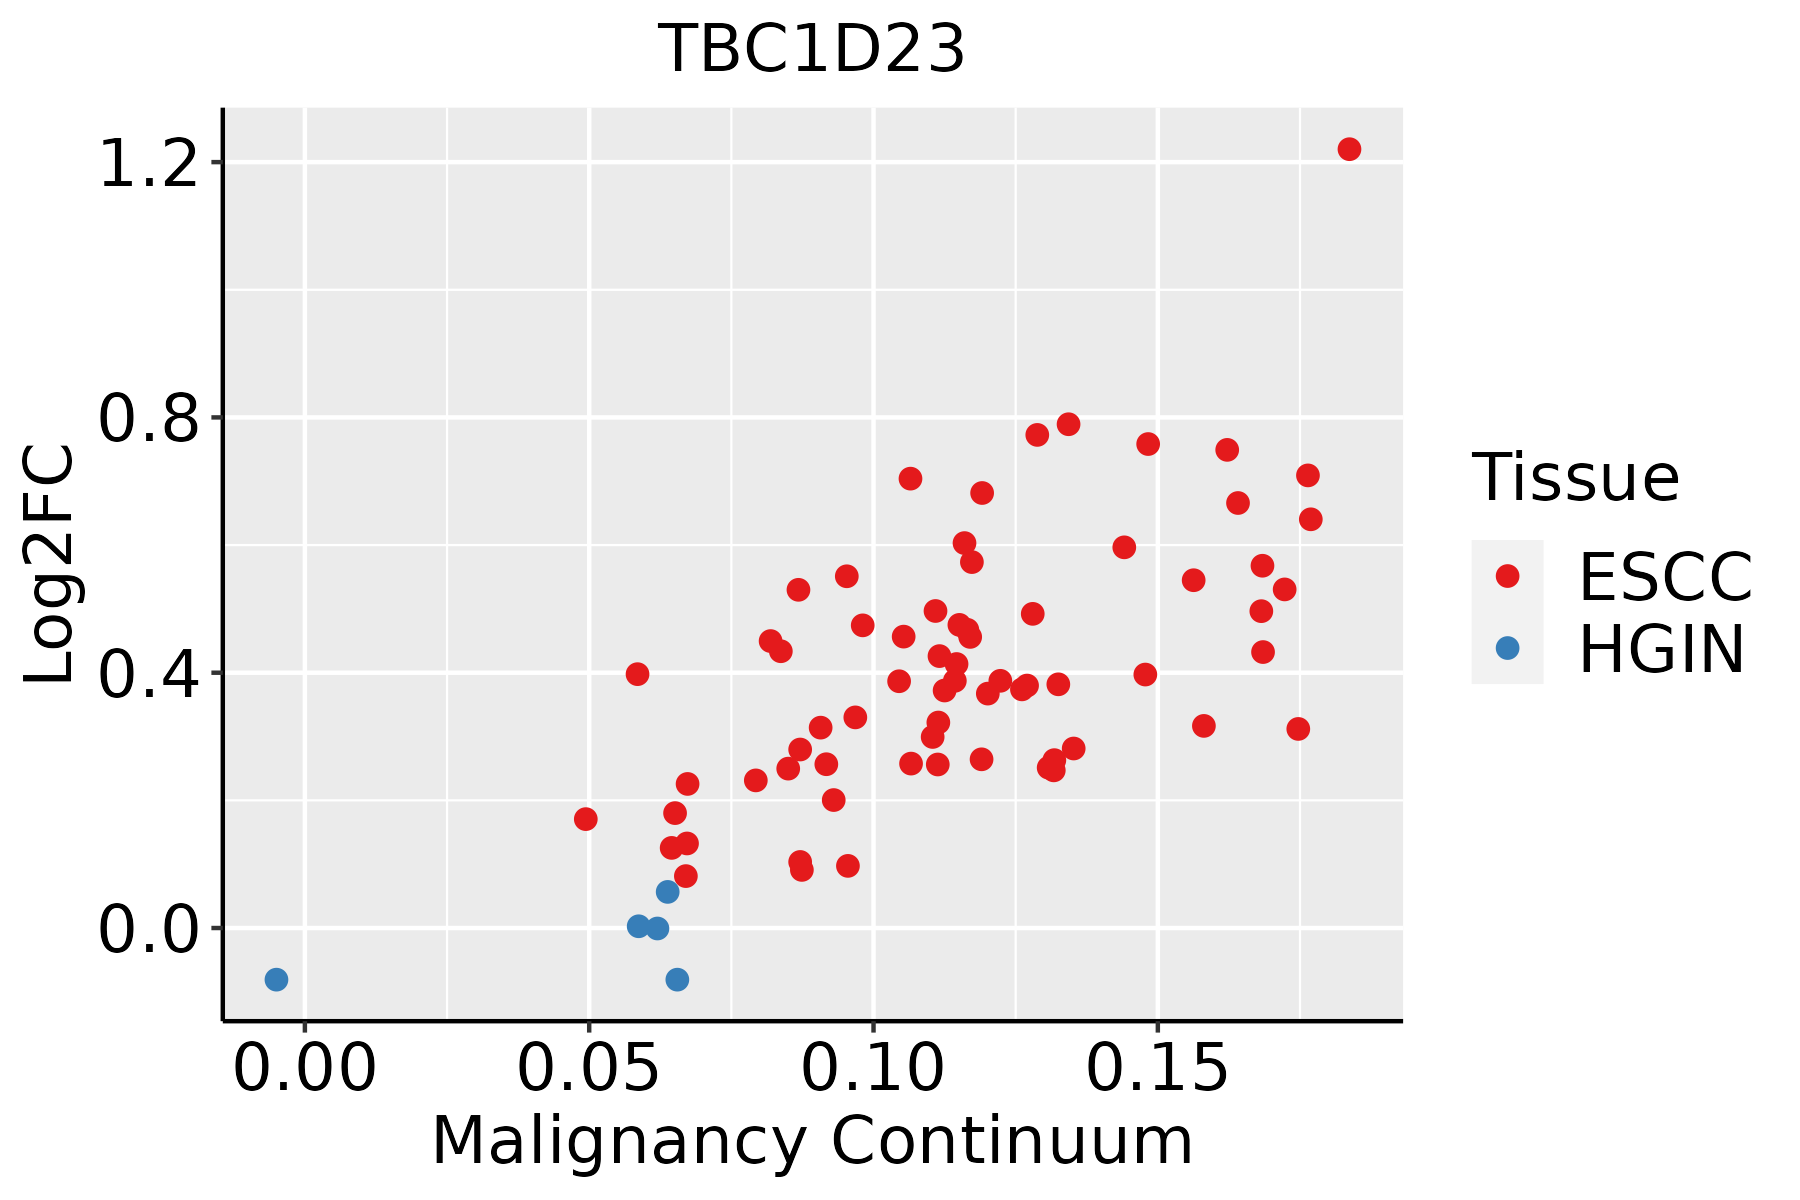 | ESCC: Esophageal squamous cell carcinoma |
| HGIN: High-grade intraepithelial neoplasias | ||
| LGIN: Low-grade intraepithelial neoplasias | ||
| Liver | 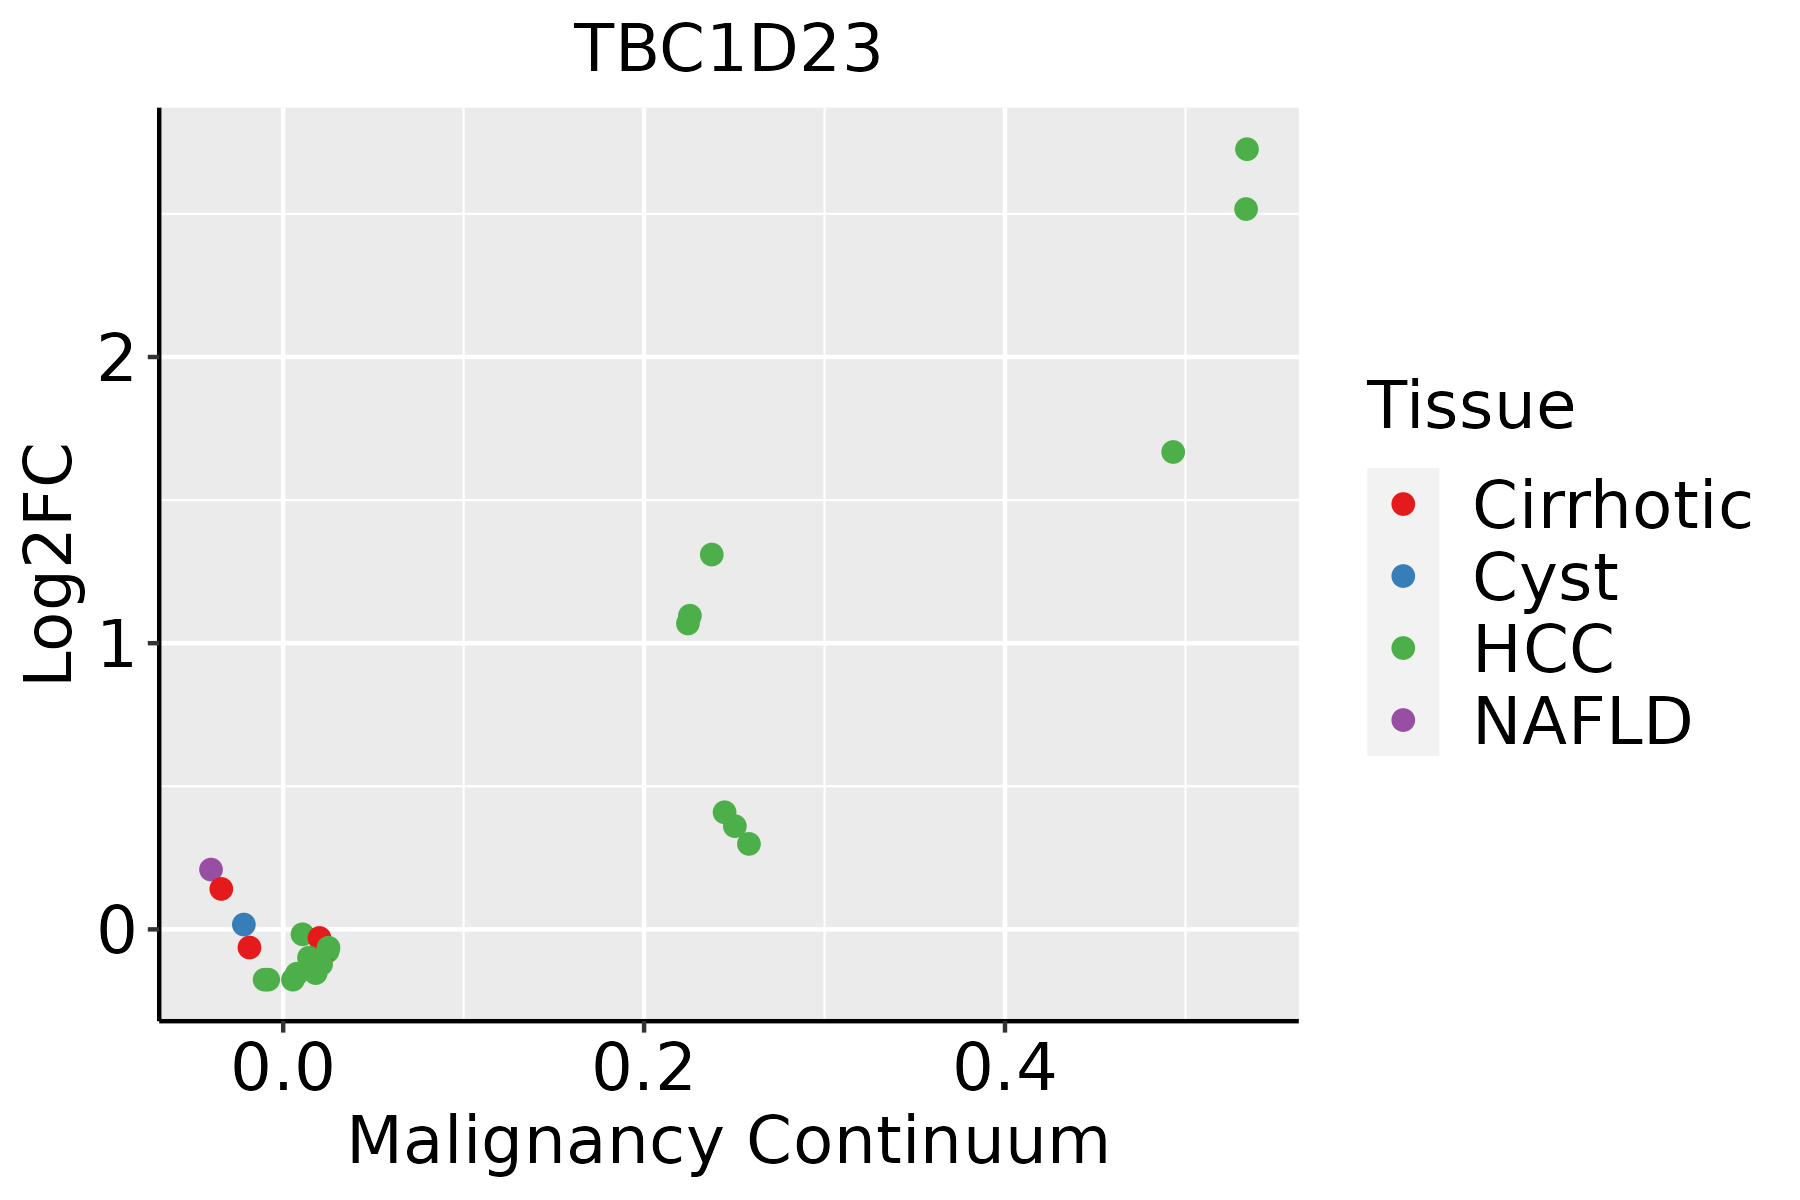 | HCC: Hepatocellular carcinoma |
| NAFLD: Non-alcoholic fatty liver disease | ||
| Oral Cavity |  | EOLP: Erosive Oral lichen planus |
| LP: leukoplakia | ||
| NEOLP: Non-erosive oral lichen planus | ||
| OSCC: Oral squamous cell carcinoma | ||
| Skin | 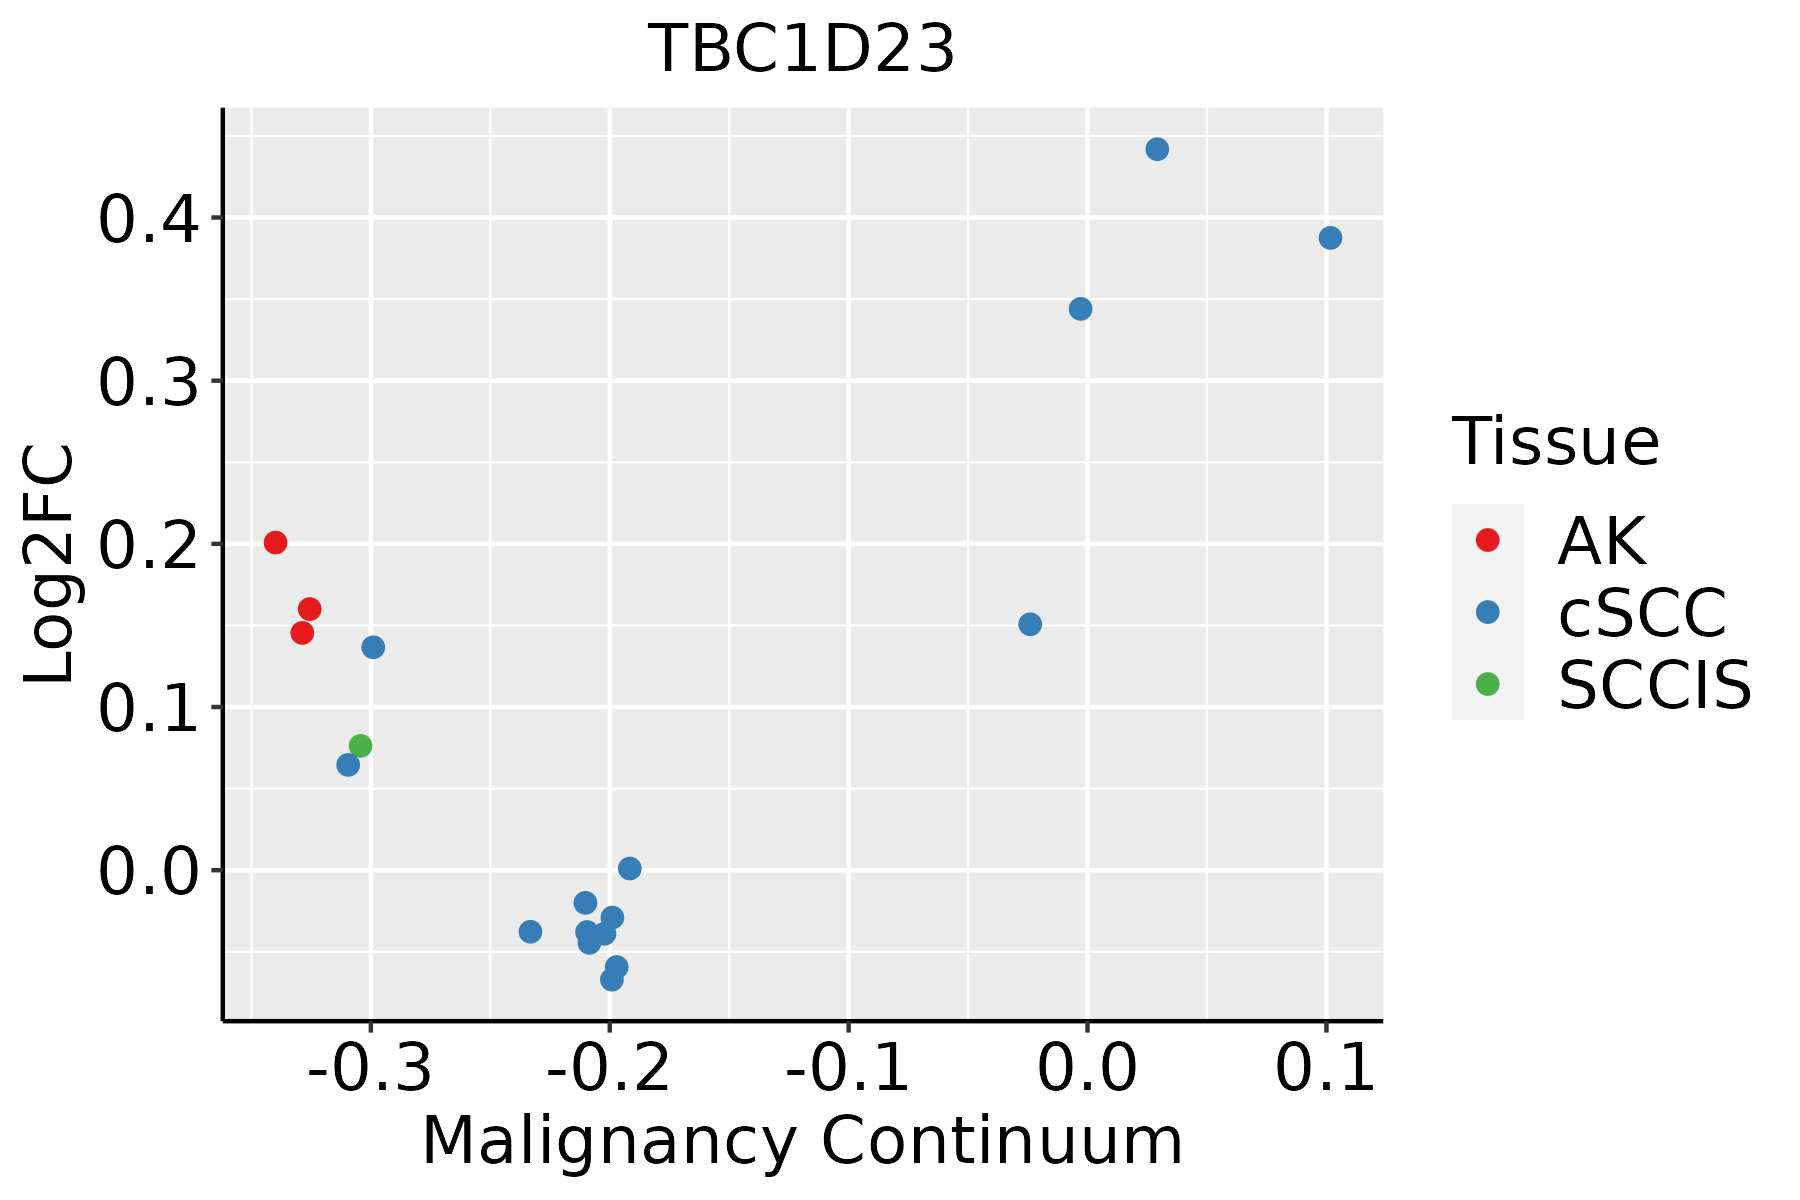 | AK: Actinic keratosis |
| cSCC: Cutaneous squamous cell carcinoma | ||
| SCCIS:squamous cell carcinoma in situ |
| ∗log2FC in expression of this searched gene in stem-like cells from each diseased tissue sample relative to stem-like cells in normal samples in each tissue plotted against the malignancy continuum. Samples are colored based on if they are from different disease stage. |
Top |
Malignant transformation related pathway analysis |
| Find out the enriched GO biological processes and KEGG pathways involved in transition from healthy to precancer to cancer |
| Tissue | Disease Stage | Enriched GO biological Processes |
| Colorectum | AD |  |
| Colorectum | SER |  |
| Colorectum | MSS |  |
| Colorectum | MSI-H |  |
| Colorectum | FAP |  |
| ∗Top 15 enriched GO BP terms are showed in the bar plot of each disease state in each tissue. Each row represents a significant GO biological process which is colored according to the -log10(p.adjust). |
| Page: 1 2 3 4 5 6 7 8 9 |
| GO ID | Tissue | Disease Stage | Description | Gene Ratio | Bg Ratio | pvalue | p.adjust | Count |
| GO:005165617 | Esophagus | ESCC | establishment of organelle localization | 273/8552 | 390/18723 | 9.13e-23 | 1.81e-20 | 273 |
| GO:001619715 | Esophagus | ESCC | endosomal transport | 168/8552 | 230/18723 | 2.28e-17 | 1.93e-15 | 168 |
| GO:001648210 | Esophagus | ESCC | cytosolic transport | 124/8552 | 168/18723 | 9.69e-14 | 4.69e-12 | 124 |
| GO:005165016 | Esophagus | ESCC | establishment of vesicle localization | 114/8552 | 161/18723 | 8.20e-11 | 2.53e-09 | 114 |
| GO:005164815 | Esophagus | ESCC | vesicle localization | 119/8552 | 177/18723 | 5.16e-09 | 1.08e-07 | 119 |
| GO:00069038 | Esophagus | ESCC | vesicle targeting | 38/8552 | 45/18723 | 8.42e-08 | 1.43e-06 | 38 |
| GO:00421477 | Esophagus | ESCC | retrograde transport, endosome to Golgi | 63/8552 | 91/18723 | 4.58e-06 | 4.87e-05 | 63 |
| GO:00485687 | Esophagus | ESCC | embryonic organ development | 228/8552 | 427/18723 | 7.28e-04 | 3.79e-03 | 228 |
| GO:00990222 | Esophagus | ESCC | vesicle tethering | 10/8552 | 11/18723 | 2.54e-03 | 1.08e-02 | 10 |
| GO:001619721 | Liver | HCC | endosomal transport | 154/7958 | 230/18723 | 4.74e-14 | 2.95e-12 | 154 |
| GO:001648221 | Liver | HCC | cytosolic transport | 117/7958 | 168/18723 | 8.83e-13 | 4.48e-11 | 117 |
| GO:005165621 | Liver | HCC | establishment of organelle localization | 226/7958 | 390/18723 | 4.15e-10 | 1.34e-08 | 226 |
| GO:005165021 | Liver | HCC | establishment of vesicle localization | 103/7958 | 161/18723 | 2.94e-08 | 6.69e-07 | 103 |
| GO:005164821 | Liver | HCC | vesicle localization | 107/7958 | 177/18723 | 1.05e-06 | 1.57e-05 | 107 |
| GO:004214721 | Liver | HCC | retrograde transport, endosome to Golgi | 61/7958 | 91/18723 | 1.94e-06 | 2.68e-05 | 61 |
| GO:000690311 | Liver | HCC | vesicle targeting | 34/7958 | 45/18723 | 6.75e-06 | 8.08e-05 | 34 |
| GO:005165610 | Oral cavity | OSCC | establishment of organelle localization | 239/7305 | 390/18723 | 2.46e-19 | 3.31e-17 | 239 |
| GO:00161979 | Oral cavity | OSCC | endosomal transport | 141/7305 | 230/18723 | 5.40e-12 | 2.06e-10 | 141 |
| GO:00164829 | Oral cavity | OSCC | cytosolic transport | 106/7305 | 168/18723 | 2.08e-10 | 5.90e-09 | 106 |
| GO:00069037 | Oral cavity | OSCC | vesicle targeting | 38/7305 | 45/18723 | 4.49e-10 | 1.19e-08 | 38 |
| Page: 1 2 3 |
| Pathway ID | Tissue | Disease Stage | Description | Gene Ratio | Bg Ratio | pvalue | p.adjust | qvalue | Count |
| Page: 1 |
Top |
Cell-cell communication analysis |
| Identification of potential cell-cell interactions between two cell types and their ligand-receptor pairs for different disease states |
| Ligand | Receptor | LRpair | Pathway | Tissue | Disease Stage |
| Page: 1 |
Top |
Single-cell gene regulatory network inference analysis |
| Find out the significant the regulons (TFs) and the target genes of each regulon across cell types for different disease states |
| TF | Cell Type | Tissue | Disease Stage | Target Gene | RSS | Regulon Activity |
| ∗The dot plots of a searched regulon are shown for all cell subpopulations in each disease state of each tissue based on the regulon specific score inferred using pySCENIC and by calculating the average expression. |
| Page: 1 |
Top |
Somatic mutation of malignant transformation related genes |
| Annotation of somatic variants for genes involved in malignant transformation |
| Hugo Symbol | Variant Class | Variant Classification | dbSNP RS | HGVSc | HGVSp | HGVSp Short | SWISSPROT | BIOTYPE | SIFT | PolyPhen | Tumor Sample Barcode | Tissue | Histology | Sex | Age | Stage | Therapy Types | Drugs | Outcome |
| TBC1D23 | SNV | Missense_Mutation | novel | c.584C>G | p.Ser195Cys | p.S195C | Q9NUY8 | protein_coding | tolerated(0.17) | benign(0.027) | TCGA-5L-AAT1-01 | Breast | breast invasive carcinoma | Female | <65 | III/IV | Hormone Therapy | letrozol | SD |
| TBC1D23 | SNV | Missense_Mutation | c.1666G>C | p.Asp556His | p.D556H | Q9NUY8 | protein_coding | deleterious(0) | probably_damaging(0.998) | TCGA-B6-A0X1-01 | Breast | breast invasive carcinoma | Female | <65 | I/II | Unknown | Unknown | PD | |
| TBC1D23 | SNV | Missense_Mutation | c.472N>T | p.Pro158Ser | p.P158S | Q9NUY8 | protein_coding | deleterious(0) | benign(0.215) | TCGA-BH-A0EE-01 | Breast | breast invasive carcinoma | Female | >=65 | I/II | Chemotherapy | docetaxel | SD | |
| TBC1D23 | SNV | Missense_Mutation | c.830C>G | p.Ser277Cys | p.S277C | Q9NUY8 | protein_coding | deleterious(0) | possibly_damaging(0.541) | TCGA-E2-A158-01 | Breast | breast invasive carcinoma | Female | <65 | I/II | Chemotherapy | arimidex | SD | |
| TBC1D23 | insertion | Frame_Shift_Ins | novel | c.472_473insTAGAAGTCTTCTGTTTCTTT | p.Pro158LeufsTer83 | p.P158Lfs*83 | Q9NUY8 | protein_coding | TCGA-AN-A041-01 | Breast | breast invasive carcinoma | Female | <65 | I/II | Unknown | Unknown | SD | ||
| TBC1D23 | insertion | In_Frame_Ins | novel | c.474_475insCTTCTCTCTCAACAGACT | p.Pro158_Arg159insLeuLeuSerGlnGlnThr | p.P158_R159insLLSQQT | Q9NUY8 | protein_coding | TCGA-AN-A041-01 | Breast | breast invasive carcinoma | Female | <65 | I/II | Unknown | Unknown | SD | ||
| TBC1D23 | deletion | In_Frame_Del | novel | c.1044_1061delNNNNNNNNNNNNNNNNNN | p.Tyr349_Leu354del | p.Y349_L354del | Q9NUY8 | protein_coding | TCGA-EW-A3U0-01 | Breast | breast invasive carcinoma | Female | <65 | III/IV | Chemotherapy | cisplatin | CR | ||
| TBC1D23 | SNV | Missense_Mutation | c.1243N>A | p.Val415Ile | p.V415I | Q9NUY8 | protein_coding | tolerated(0.06) | possibly_damaging(0.695) | TCGA-AA-3492-01 | Colorectum | colon adenocarcinoma | Female | >=65 | I/II | Unknown | Unknown | SD | |
| TBC1D23 | SNV | Missense_Mutation | rs775998079 | c.494N>A | p.Gly165Glu | p.G165E | Q9NUY8 | protein_coding | deleterious(0.04) | probably_damaging(0.992) | TCGA-AA-3811-01 | Colorectum | colon adenocarcinoma | Female | >=65 | III/IV | Unknown | Unknown | PD |
| TBC1D23 | SNV | Missense_Mutation | novel | c.1478N>T | p.Ala493Val | p.A493V | Q9NUY8 | protein_coding | tolerated(0.6) | benign(0.292) | TCGA-AA-3845-01 | Colorectum | colon adenocarcinoma | Female | >=65 | I/II | Unknown | Unknown | PD |
| Page: 1 2 3 4 5 6 7 |
Top |
Related drugs of malignant transformation related genes |
| Identification of chemicals and drugs interact with genes involved in malignant transfromation |
| (DGIdb 4.0) |
| Entrez ID | Symbol | Category | Interaction Types | Drug Claim Name | Drug Name | PMIDs |
| Page: 1 |

Copyright 2023-Present -The University of Texas Health Science Center at Houston |