
|
|||||
|
 | |
| |
| |
| |
| |
| |
|
Gene: TBC1D22B |
Gene summary for TBC1D22B |
| Gene information | Species | Human | Gene symbol | TBC1D22B | Gene ID | 55633 |
| Gene name | TBC1 domain family member 22B | |
| Gene Alias | C6orf197 | |
| Cytomap | 6p21.2 | |
| Gene Type | protein-coding | GO ID | GO:0006810 | UniProtAcc | Q9NU19 |
Top |
Malignant transformation analysis |
| Identification of the aberrant gene expression in precancerous and cancerous lesions by comparing the gene expression of stem-like cells in diseased tissues with normal stem cells |
| Entrez ID | Symbol | Replicates | Species | Organ | Tissue | Adj P-value | Log2FC | Malignancy |
| 55633 | TBC1D22B | LZE2T | Human | Esophagus | ESCC | 1.44e-03 | 3.79e-01 | 0.082 |
| 55633 | TBC1D22B | LZE7T | Human | Esophagus | ESCC | 1.60e-04 | 1.95e-01 | 0.0667 |
| 55633 | TBC1D22B | LZE24T | Human | Esophagus | ESCC | 5.05e-06 | 1.89e-01 | 0.0596 |
| 55633 | TBC1D22B | P2T-E | Human | Esophagus | ESCC | 2.48e-11 | 2.16e-01 | 0.1177 |
| 55633 | TBC1D22B | P4T-E | Human | Esophagus | ESCC | 7.55e-10 | 1.67e-01 | 0.1323 |
| 55633 | TBC1D22B | P5T-E | Human | Esophagus | ESCC | 4.45e-05 | 9.03e-02 | 0.1327 |
| 55633 | TBC1D22B | P8T-E | Human | Esophagus | ESCC | 4.74e-08 | 1.38e-01 | 0.0889 |
| 55633 | TBC1D22B | P9T-E | Human | Esophagus | ESCC | 1.01e-06 | 1.33e-01 | 0.1131 |
| 55633 | TBC1D22B | P10T-E | Human | Esophagus | ESCC | 7.30e-07 | 1.10e-01 | 0.116 |
| 55633 | TBC1D22B | P11T-E | Human | Esophagus | ESCC | 9.11e-06 | 2.44e-01 | 0.1426 |
| 55633 | TBC1D22B | P12T-E | Human | Esophagus | ESCC | 2.76e-04 | 1.58e-01 | 0.1122 |
| 55633 | TBC1D22B | P15T-E | Human | Esophagus | ESCC | 3.80e-09 | 1.89e-01 | 0.1149 |
| 55633 | TBC1D22B | P16T-E | Human | Esophagus | ESCC | 9.75e-08 | 1.12e-01 | 0.1153 |
| 55633 | TBC1D22B | P17T-E | Human | Esophagus | ESCC | 4.57e-04 | 2.48e-01 | 0.1278 |
| 55633 | TBC1D22B | P21T-E | Human | Esophagus | ESCC | 7.40e-04 | 1.20e-01 | 0.1617 |
| 55633 | TBC1D22B | P22T-E | Human | Esophagus | ESCC | 4.17e-10 | 8.72e-02 | 0.1236 |
| 55633 | TBC1D22B | P23T-E | Human | Esophagus | ESCC | 7.21e-12 | 2.20e-01 | 0.108 |
| 55633 | TBC1D22B | P24T-E | Human | Esophagus | ESCC | 2.27e-07 | 1.84e-01 | 0.1287 |
| 55633 | TBC1D22B | P26T-E | Human | Esophagus | ESCC | 2.92e-08 | 1.21e-01 | 0.1276 |
| 55633 | TBC1D22B | P27T-E | Human | Esophagus | ESCC | 4.05e-06 | 1.69e-01 | 0.1055 |
| Page: 1 2 3 4 |
| Tissue | Expression Dynamics | Abbreviation |
| Esophagus | 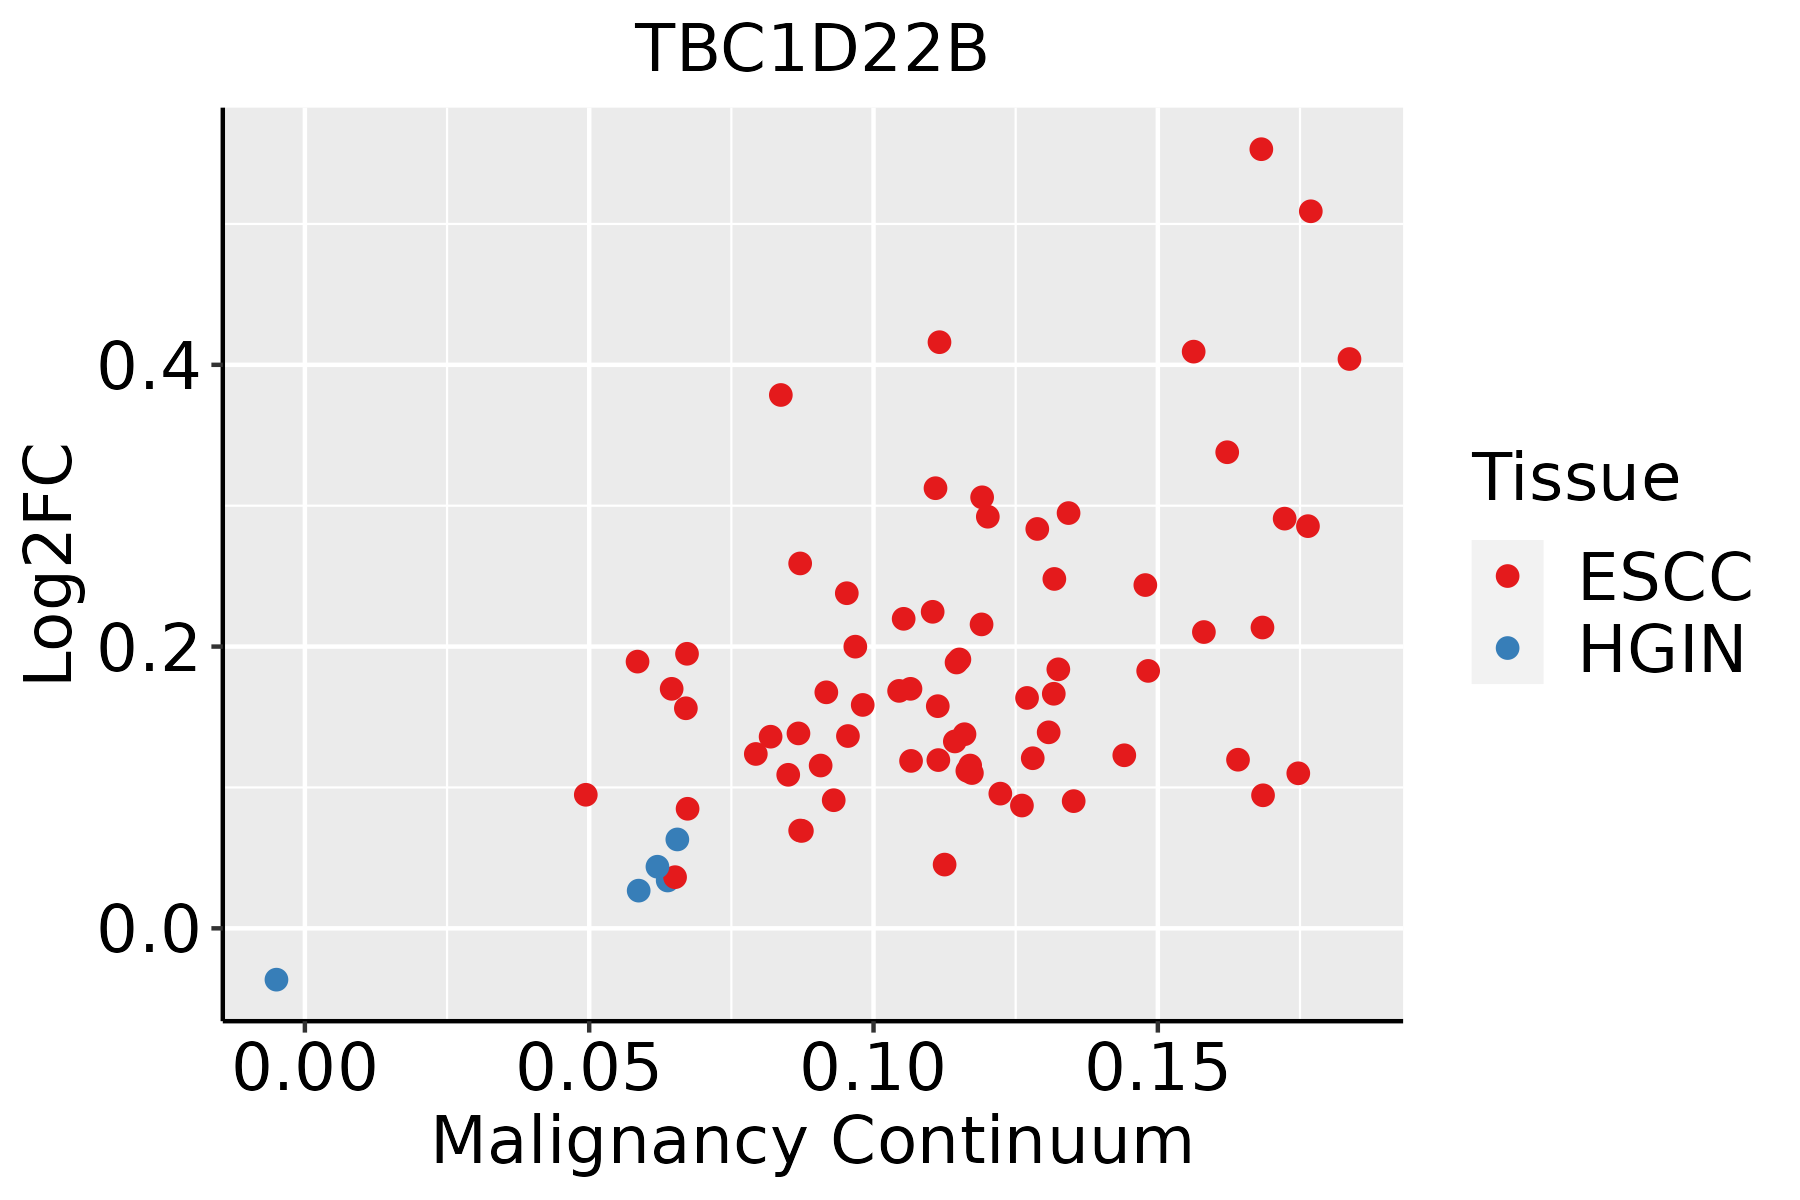 | ESCC: Esophageal squamous cell carcinoma |
| HGIN: High-grade intraepithelial neoplasias | ||
| LGIN: Low-grade intraepithelial neoplasias | ||
| Lung | 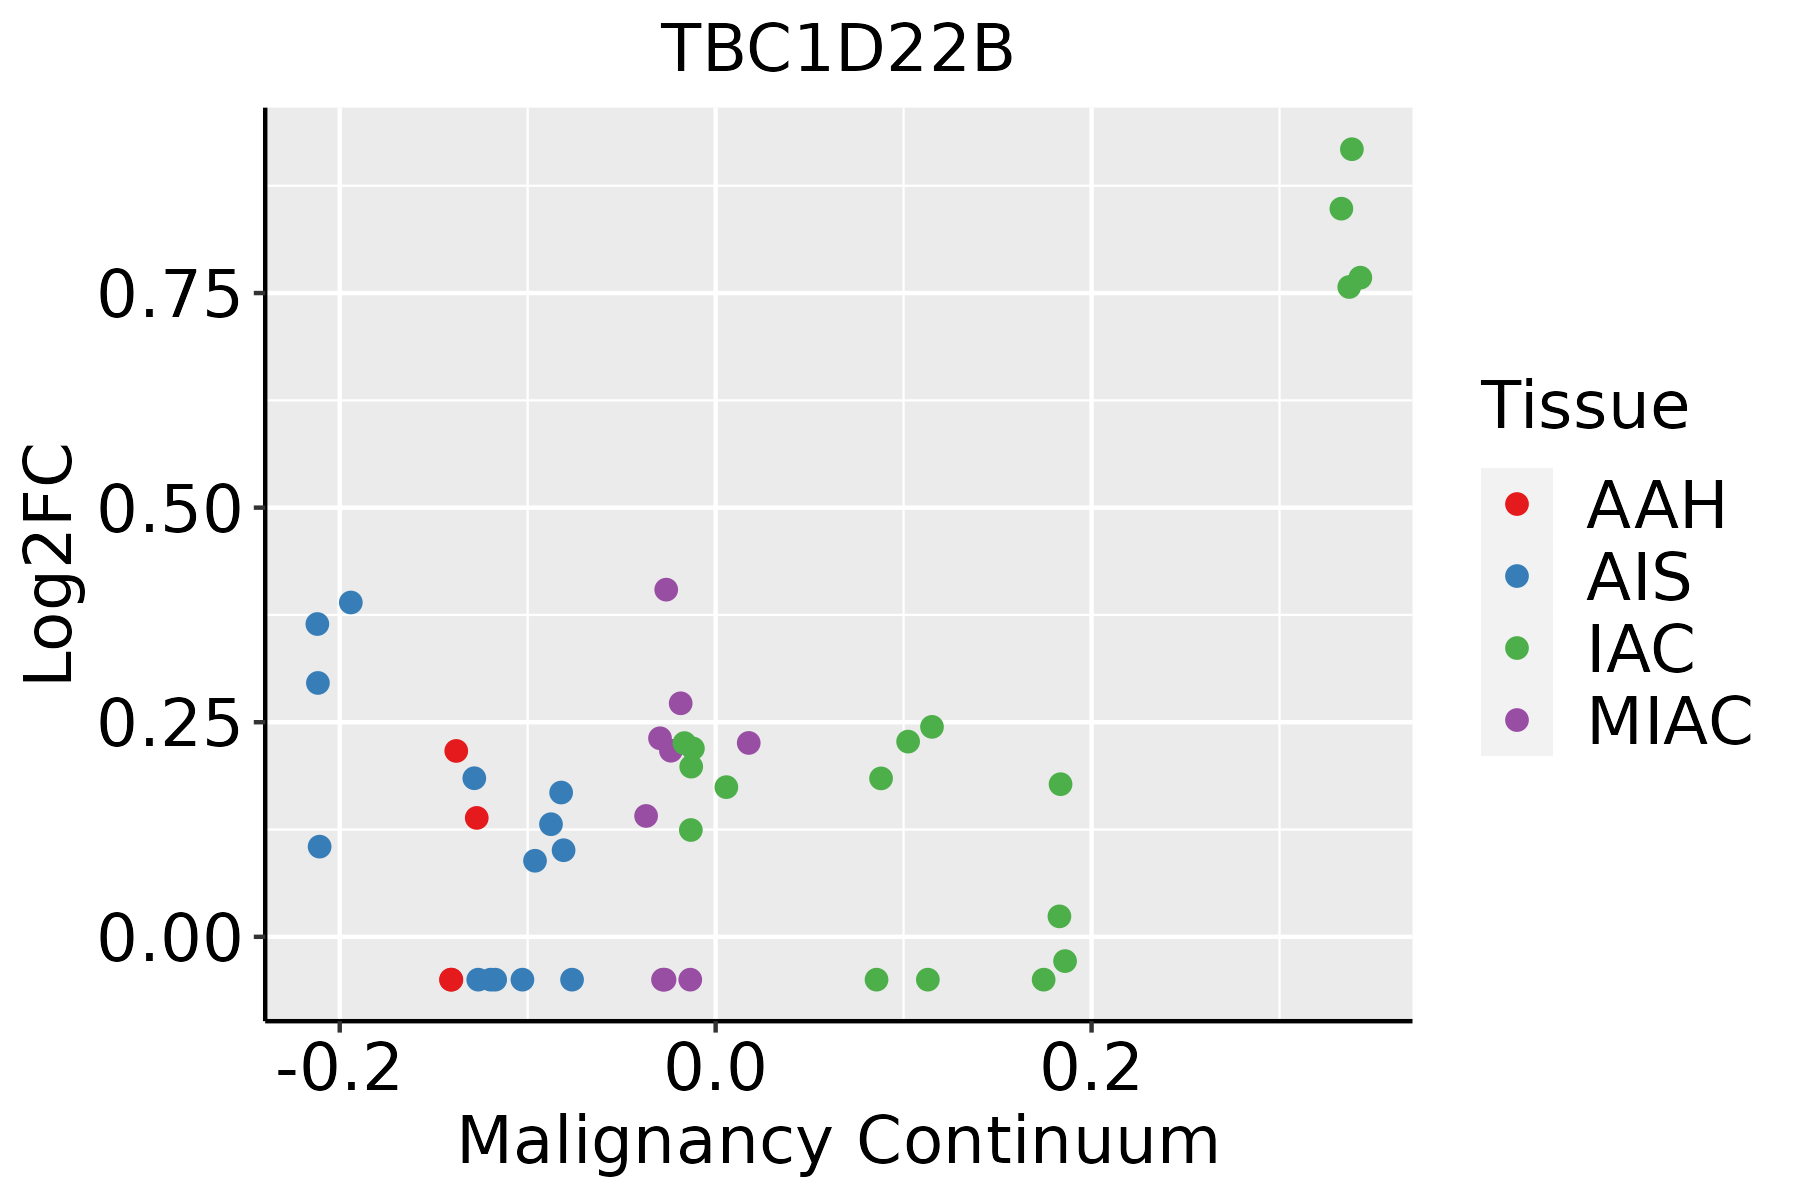 | AAH: Atypical adenomatous hyperplasia |
| AIS: Adenocarcinoma in situ | ||
| IAC: Invasive lung adenocarcinoma | ||
| MIA: Minimally invasive adenocarcinoma | ||
| Thyroid | 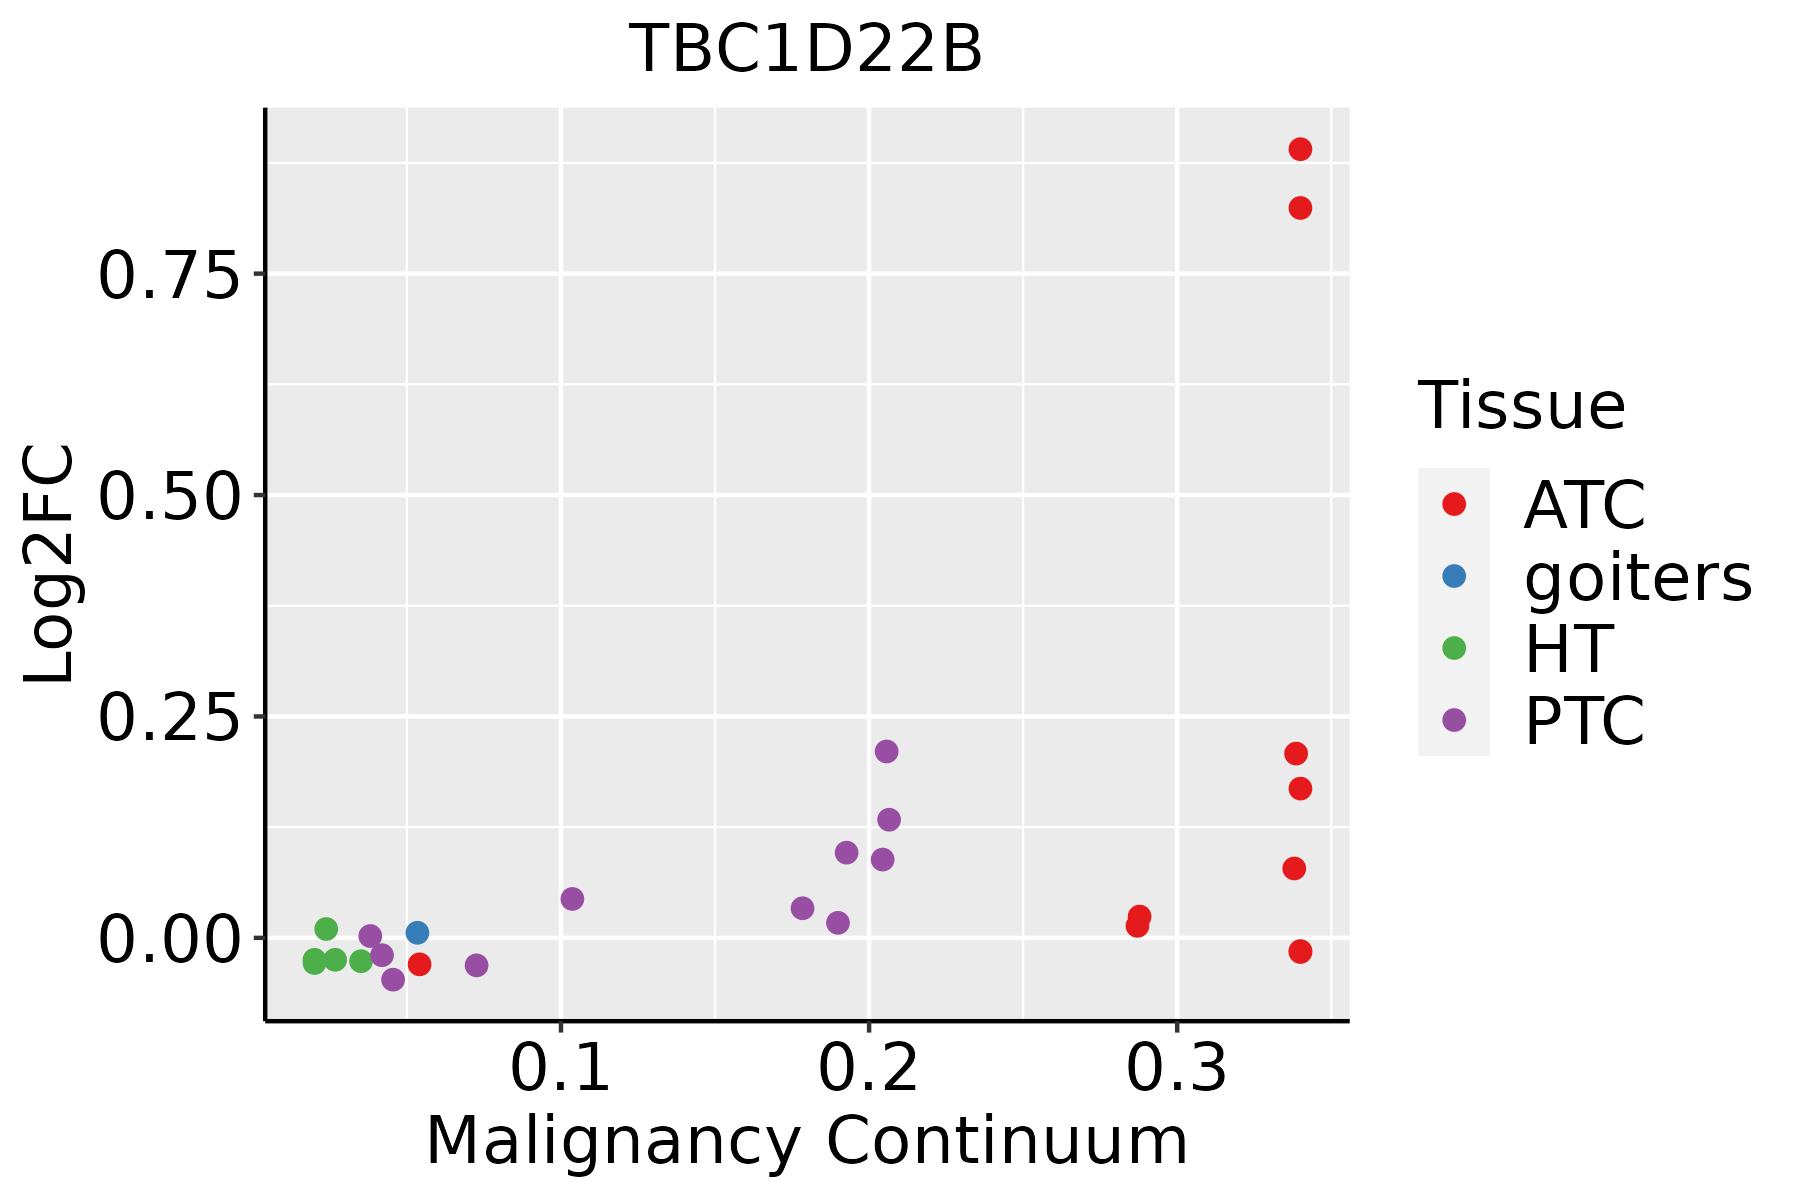 | ATC: Anaplastic thyroid cancer |
| HT: Hashimoto's thyroiditis | ||
| PTC: Papillary thyroid cancer |
| ∗log2FC in expression of this searched gene in stem-like cells from each diseased tissue sample relative to stem-like cells in normal samples in each tissue plotted against the malignancy continuum. Samples are colored based on if they are from different disease stage. |
Top |
Malignant transformation related pathway analysis |
| Find out the enriched GO biological processes and KEGG pathways involved in transition from healthy to precancer to cancer |
| Tissue | Disease Stage | Enriched GO biological Processes |
| Colorectum | AD |  |
| Colorectum | SER |  |
| Colorectum | MSS |  |
| Colorectum | MSI-H |  |
| Colorectum | FAP |  |
| ∗Top 15 enriched GO BP terms are showed in the bar plot of each disease state in each tissue. Each row represents a significant GO biological process which is colored according to the -log10(p.adjust). |
| Page: 1 2 3 4 5 6 7 8 9 |
| GO ID | Tissue | Disease Stage | Description | Gene Ratio | Bg Ratio | pvalue | p.adjust | Count |
| GO:004308715 | Esophagus | ESCC | regulation of GTPase activity | 183/8552 | 348/18723 | 5.34e-03 | 2.00e-02 | 183 |
| GO:00430876 | Lung | IAC | regulation of GTPase activity | 67/2061 | 348/18723 | 3.43e-06 | 1.44e-04 | 67 |
| GO:00435475 | Lung | IAC | positive regulation of GTPase activity | 48/2061 | 255/18723 | 1.40e-04 | 2.60e-03 | 48 |
| GO:00906303 | Lung | IAC | activation of GTPase activity | 22/2061 | 115/18723 | 6.80e-03 | 4.73e-02 | 22 |
| GO:004308711 | Lung | AIS | regulation of GTPase activity | 65/1849 | 348/18723 | 3.35e-07 | 2.83e-05 | 65 |
| GO:004354711 | Lung | AIS | positive regulation of GTPase activity | 44/1849 | 255/18723 | 1.74e-04 | 3.64e-03 | 44 |
| GO:009063011 | Lung | AIS | activation of GTPase activity | 21/1849 | 115/18723 | 4.07e-03 | 3.65e-02 | 21 |
| GO:004308718 | Thyroid | PTC | regulation of GTPase activity | 148/5968 | 348/18723 | 1.63e-05 | 1.71e-04 | 148 |
| GO:004354714 | Thyroid | PTC | positive regulation of GTPase activity | 103/5968 | 255/18723 | 2.38e-03 | 1.25e-02 | 103 |
| GO:004308719 | Thyroid | ATC | regulation of GTPase activity | 153/6293 | 348/18723 | 3.24e-05 | 2.68e-04 | 153 |
| GO:004354715 | Thyroid | ATC | positive regulation of GTPase activity | 106/6293 | 255/18723 | 4.58e-03 | 1.89e-02 | 106 |
| Page: 1 |
| Pathway ID | Tissue | Disease Stage | Description | Gene Ratio | Bg Ratio | pvalue | p.adjust | qvalue | Count |
| Page: 1 |
Top |
Cell-cell communication analysis |
| Identification of potential cell-cell interactions between two cell types and their ligand-receptor pairs for different disease states |
| Ligand | Receptor | LRpair | Pathway | Tissue | Disease Stage |
| Page: 1 |
Top |
Single-cell gene regulatory network inference analysis |
| Find out the significant the regulons (TFs) and the target genes of each regulon across cell types for different disease states |
| TF | Cell Type | Tissue | Disease Stage | Target Gene | RSS | Regulon Activity |
| ∗The dot plots of a searched regulon are shown for all cell subpopulations in each disease state of each tissue based on the regulon specific score inferred using pySCENIC and by calculating the average expression. |
| Page: 1 |
Top |
Somatic mutation of malignant transformation related genes |
| Annotation of somatic variants for genes involved in malignant transformation |
| Hugo Symbol | Variant Class | Variant Classification | dbSNP RS | HGVSc | HGVSp | HGVSp Short | SWISSPROT | BIOTYPE | SIFT | PolyPhen | Tumor Sample Barcode | Tissue | Histology | Sex | Age | Stage | Therapy Types | Drugs | Outcome |
| TBC1D22B | SNV | Missense_Mutation | c.806A>G | p.His269Arg | p.H269R | Q9NU19 | protein_coding | deleterious(0.01) | benign(0.345) | TCGA-A8-A07I-01 | Breast | breast invasive carcinoma | Female | >=65 | III/IV | Chemotherapy | 5-fluorouracil | CR | |
| TBC1D22B | SNV | Missense_Mutation | rs371644904 | c.1034N>A | p.Arg345Gln | p.R345Q | Q9NU19 | protein_coding | tolerated(0.31) | benign(0.041) | TCGA-A8-A095-01 | Breast | breast invasive carcinoma | Female | <65 | I/II | Chemotherapy | 5-fluorouracil | CR |
| TBC1D22B | SNV | Missense_Mutation | c.1136N>T | p.Ala379Val | p.A379V | Q9NU19 | protein_coding | tolerated(1) | benign(0.315) | TCGA-AN-A0AK-01 | Breast | breast invasive carcinoma | Female | >=65 | I/II | Unknown | Unknown | SD | |
| TBC1D22B | SNV | Missense_Mutation | rs150909093 | c.191G>A | p.Arg64Gln | p.R64Q | Q9NU19 | protein_coding | tolerated(0.34) | benign(0.007) | TCGA-AR-A0TQ-01 | Breast | breast invasive carcinoma | Female | <65 | III/IV | Chemotherapy | doxorubicin | SD |
| TBC1D22B | SNV | Missense_Mutation | rs778955950 | c.523N>C | p.Ala175Pro | p.A175P | Q9NU19 | protein_coding | tolerated(0.19) | benign(0.003) | TCGA-AR-A1AT-01 | Breast | breast invasive carcinoma | Female | <65 | I/II | Hormone Therapy | anastrozole | SD |
| TBC1D22B | SNV | Missense_Mutation | novel | c.467N>G | p.Pro156Arg | p.P156R | Q9NU19 | protein_coding | tolerated(0.06) | benign(0.067) | TCGA-S3-AA17-01 | Breast | breast invasive carcinoma | Female | <65 | I/II | Hormone Therapy | anastrozole | SD |
| TBC1D22B | insertion | In_Frame_Ins | novel | c.1245_1246insACTCACACCTGTAATCCCAGC | p.Met415_Arg416insThrHisThrCysAsnProSer | p.M415_R416insTHTCNPS | Q9NU19 | protein_coding | TCGA-A8-A07J-01 | Breast | breast invasive carcinoma | Female | <65 | I/II | Chemotherapy | 5-fluorouracil | CR | ||
| TBC1D22B | insertion | Frame_Shift_Ins | novel | c.345_346insGCAAAACAGAT | p.Ser116AlafsTer17 | p.S116Afs*17 | Q9NU19 | protein_coding | TCGA-A8-A08H-01 | Breast | breast invasive carcinoma | Female | >=65 | I/II | Unknown | Unknown | SD | ||
| TBC1D22B | insertion | Nonsense_Mutation | novel | c.347_348insACACACTATATGACAGTATATACAAATAAG | p.Ser116_Thr117insHisThrIleTerGlnTyrIleGlnIleArg | p.S116_T117insHTI*QYIQIR | Q9NU19 | protein_coding | TCGA-A8-A08H-01 | Breast | breast invasive carcinoma | Female | >=65 | I/II | Unknown | Unknown | SD | ||
| TBC1D22B | insertion | Frame_Shift_Ins | novel | c.1066_1067insCTGAGTATAATTCATTGAACAT | p.Ser356ThrfsTer17 | p.S356Tfs*17 | Q9NU19 | protein_coding | TCGA-B6-A0IK-01 | Breast | breast invasive carcinoma | Female | <65 | III/IV | Unknown | Unknown | PD |
| Page: 1 2 3 4 5 6 7 |
Top |
Related drugs of malignant transformation related genes |
| Identification of chemicals and drugs interact with genes involved in malignant transfromation |
| (DGIdb 4.0) |
| Entrez ID | Symbol | Category | Interaction Types | Drug Claim Name | Drug Name | PMIDs |
| Page: 1 |

Copyright 2023-Present -The University of Texas Health Science Center at Houston |