
|
|||||
|
 | |
| |
| |
| |
| |
| |
|
Gene: TBC1D22A |
Gene summary for TBC1D22A |
| Gene information | Species | Human | Gene symbol | TBC1D22A | Gene ID | 25771 |
| Gene name | TBC1 domain family member 22A | |
| Gene Alias | C22orf4 | |
| Cytomap | 22q13.31 | |
| Gene Type | protein-coding | GO ID | GO:0006810 | UniProtAcc | Q8WUA7 |
Top |
Malignant transformation analysis |
| Identification of the aberrant gene expression in precancerous and cancerous lesions by comparing the gene expression of stem-like cells in diseased tissues with normal stem cells |
| Entrez ID | Symbol | Replicates | Species | Organ | Tissue | Adj P-value | Log2FC | Malignancy |
| 25771 | TBC1D22A | CCI_1 | Human | Cervix | CC | 1.57e-12 | 1.43e+00 | 0.528 |
| 25771 | TBC1D22A | CCI_2 | Human | Cervix | CC | 2.33e-02 | 6.22e-01 | 0.5249 |
| 25771 | TBC1D22A | CCI_3 | Human | Cervix | CC | 4.87e-23 | 1.38e+00 | 0.516 |
| 25771 | TBC1D22A | HTA11_3410_2000001011 | Human | Colorectum | AD | 1.57e-15 | -6.16e-01 | 0.0155 |
| 25771 | TBC1D22A | HTA11_347_2000001011 | Human | Colorectum | AD | 1.52e-09 | 4.78e-01 | -0.1954 |
| 25771 | TBC1D22A | HTA11_7862_2000001011 | Human | Colorectum | AD | 1.49e-02 | -4.47e-01 | -0.0179 |
| 25771 | TBC1D22A | HTA11_866_3004761011 | Human | Colorectum | AD | 2.24e-05 | -4.38e-01 | 0.096 |
| 25771 | TBC1D22A | HTA11_10711_2000001011 | Human | Colorectum | AD | 2.15e-03 | -4.94e-01 | 0.0338 |
| 25771 | TBC1D22A | HTA11_7696_3000711011 | Human | Colorectum | AD | 3.30e-06 | -3.38e-01 | 0.0674 |
| 25771 | TBC1D22A | HTA11_99999970781_79442 | Human | Colorectum | MSS | 1.67e-31 | -6.77e-01 | 0.294 |
| 25771 | TBC1D22A | HTA11_99999974143_84620 | Human | Colorectum | MSS | 2.54e-09 | -4.52e-01 | 0.3005 |
| 25771 | TBC1D22A | F007 | Human | Colorectum | FAP | 2.07e-03 | -2.68e-01 | 0.1176 |
| 25771 | TBC1D22A | A002-C-010 | Human | Colorectum | FAP | 5.69e-03 | -2.31e-01 | 0.242 |
| 25771 | TBC1D22A | A001-C-207 | Human | Colorectum | FAP | 4.45e-03 | -1.82e-01 | 0.1278 |
| 25771 | TBC1D22A | A015-C-203 | Human | Colorectum | FAP | 4.34e-37 | -5.43e-01 | -0.1294 |
| 25771 | TBC1D22A | A015-C-204 | Human | Colorectum | FAP | 1.42e-09 | -4.71e-01 | -0.0228 |
| 25771 | TBC1D22A | A014-C-040 | Human | Colorectum | FAP | 1.04e-06 | -5.16e-01 | -0.1184 |
| 25771 | TBC1D22A | A002-C-201 | Human | Colorectum | FAP | 5.40e-18 | -3.52e-01 | 0.0324 |
| 25771 | TBC1D22A | A002-C-203 | Human | Colorectum | FAP | 1.48e-02 | -1.79e-01 | 0.2786 |
| 25771 | TBC1D22A | A001-C-119 | Human | Colorectum | FAP | 4.29e-08 | -4.59e-01 | -0.1557 |
| Page: 1 2 3 4 5 6 7 8 9 |
| Tissue | Expression Dynamics | Abbreviation |
| Cervix | 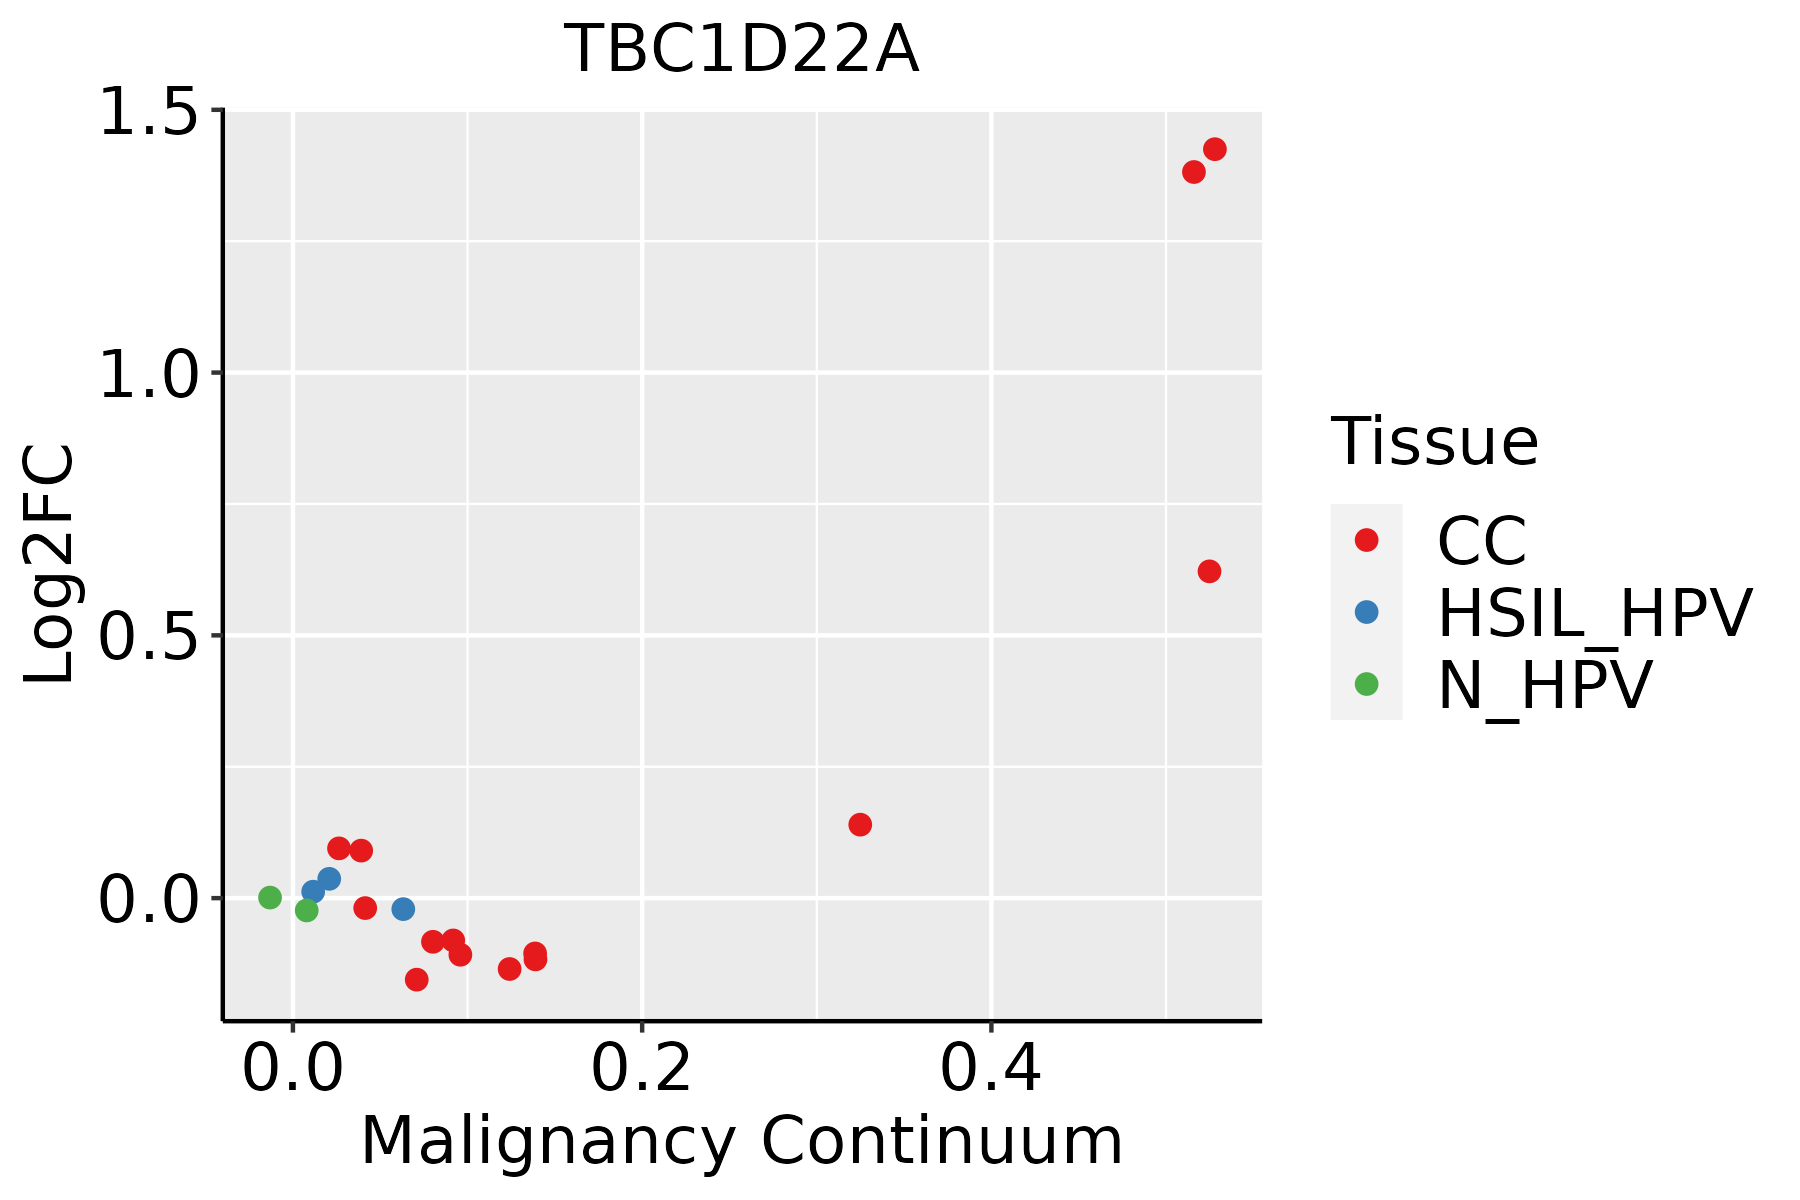 | CC: Cervix cancer |
| HSIL_HPV: HPV-infected high-grade squamous intraepithelial lesions | ||
| N_HPV: HPV-infected normal cervix | ||
| Colorectum (GSE201348) |  | FAP: Familial adenomatous polyposis |
| CRC: Colorectal cancer | ||
| Colorectum (HTA11) |  | AD: Adenomas |
| SER: Sessile serrated lesions | ||
| MSI-H: Microsatellite-high colorectal cancer | ||
| MSS: Microsatellite stable colorectal cancer | ||
| Endometrium | 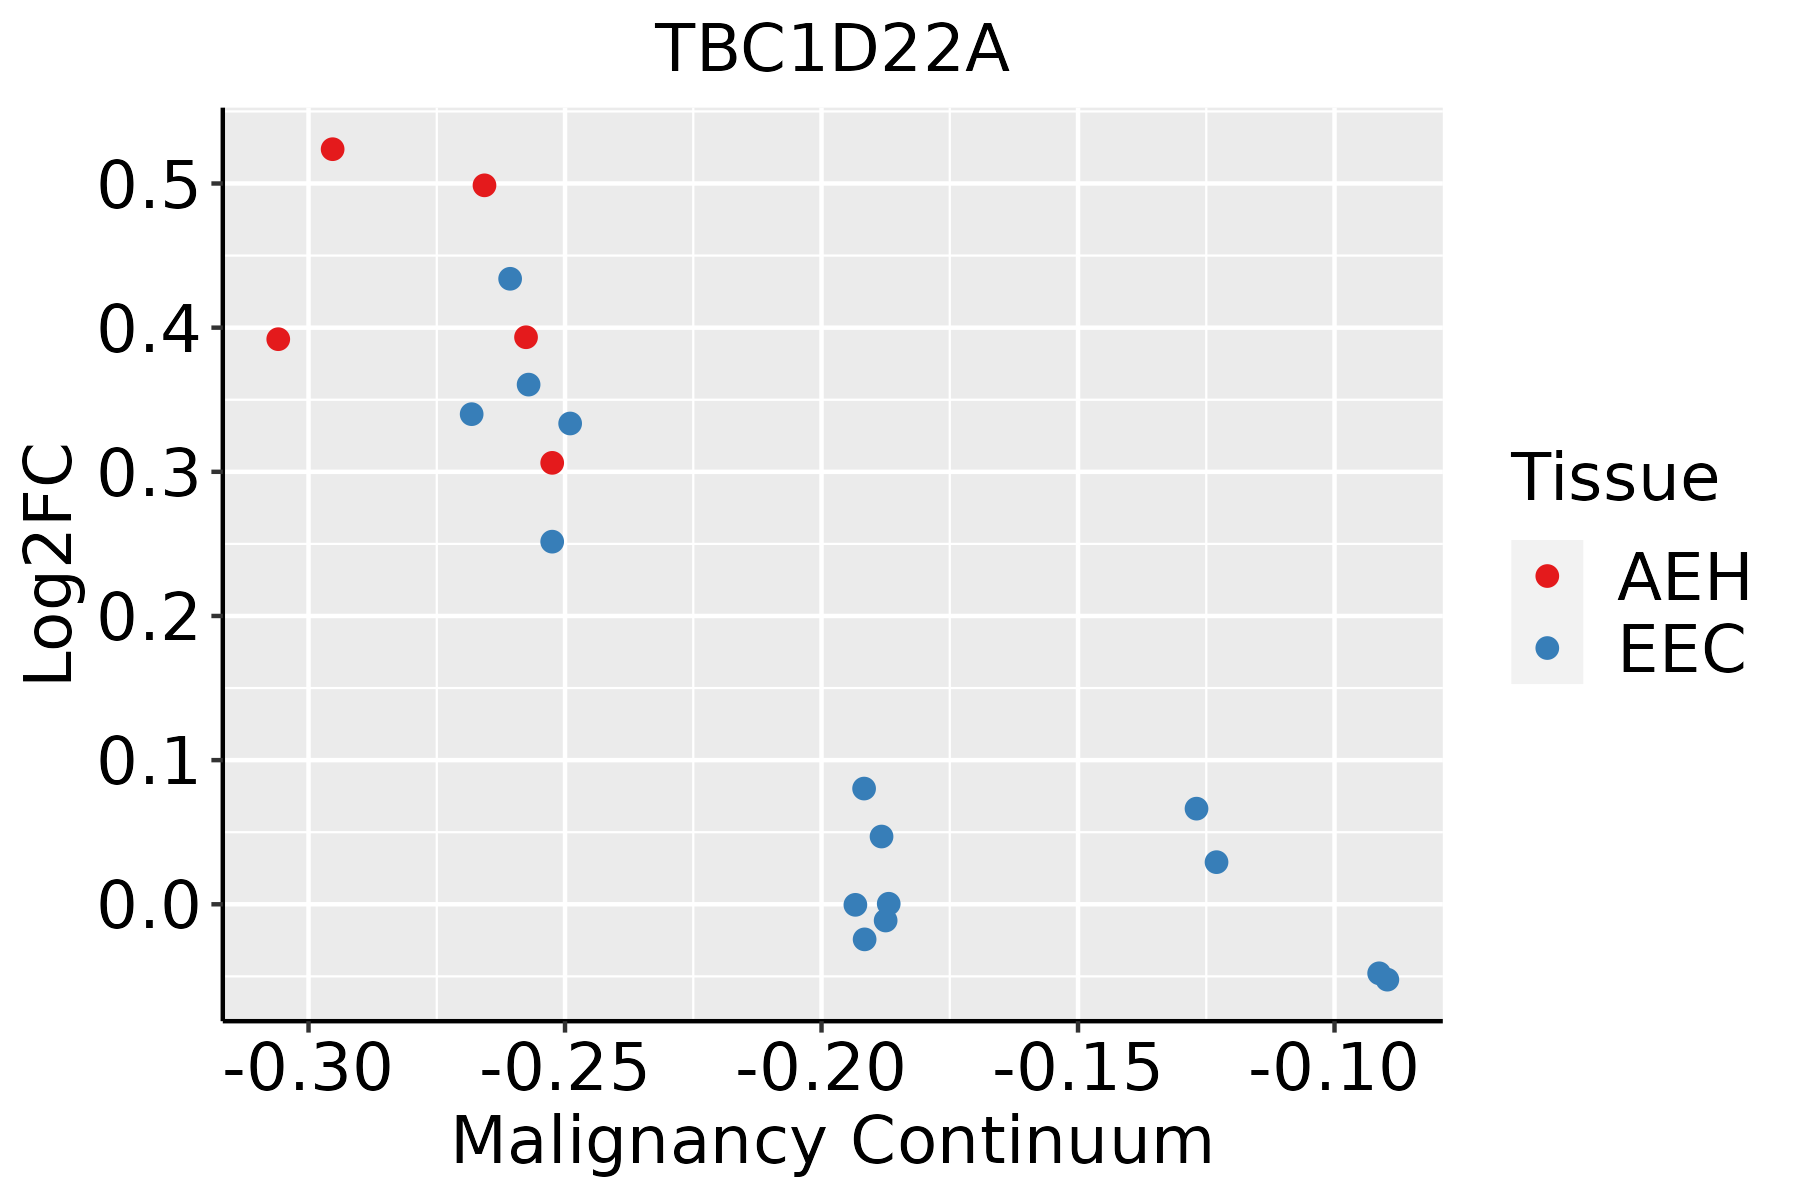 | AEH: Atypical endometrial hyperplasia |
| EEC: Endometrioid Cancer | ||
| Esophagus | 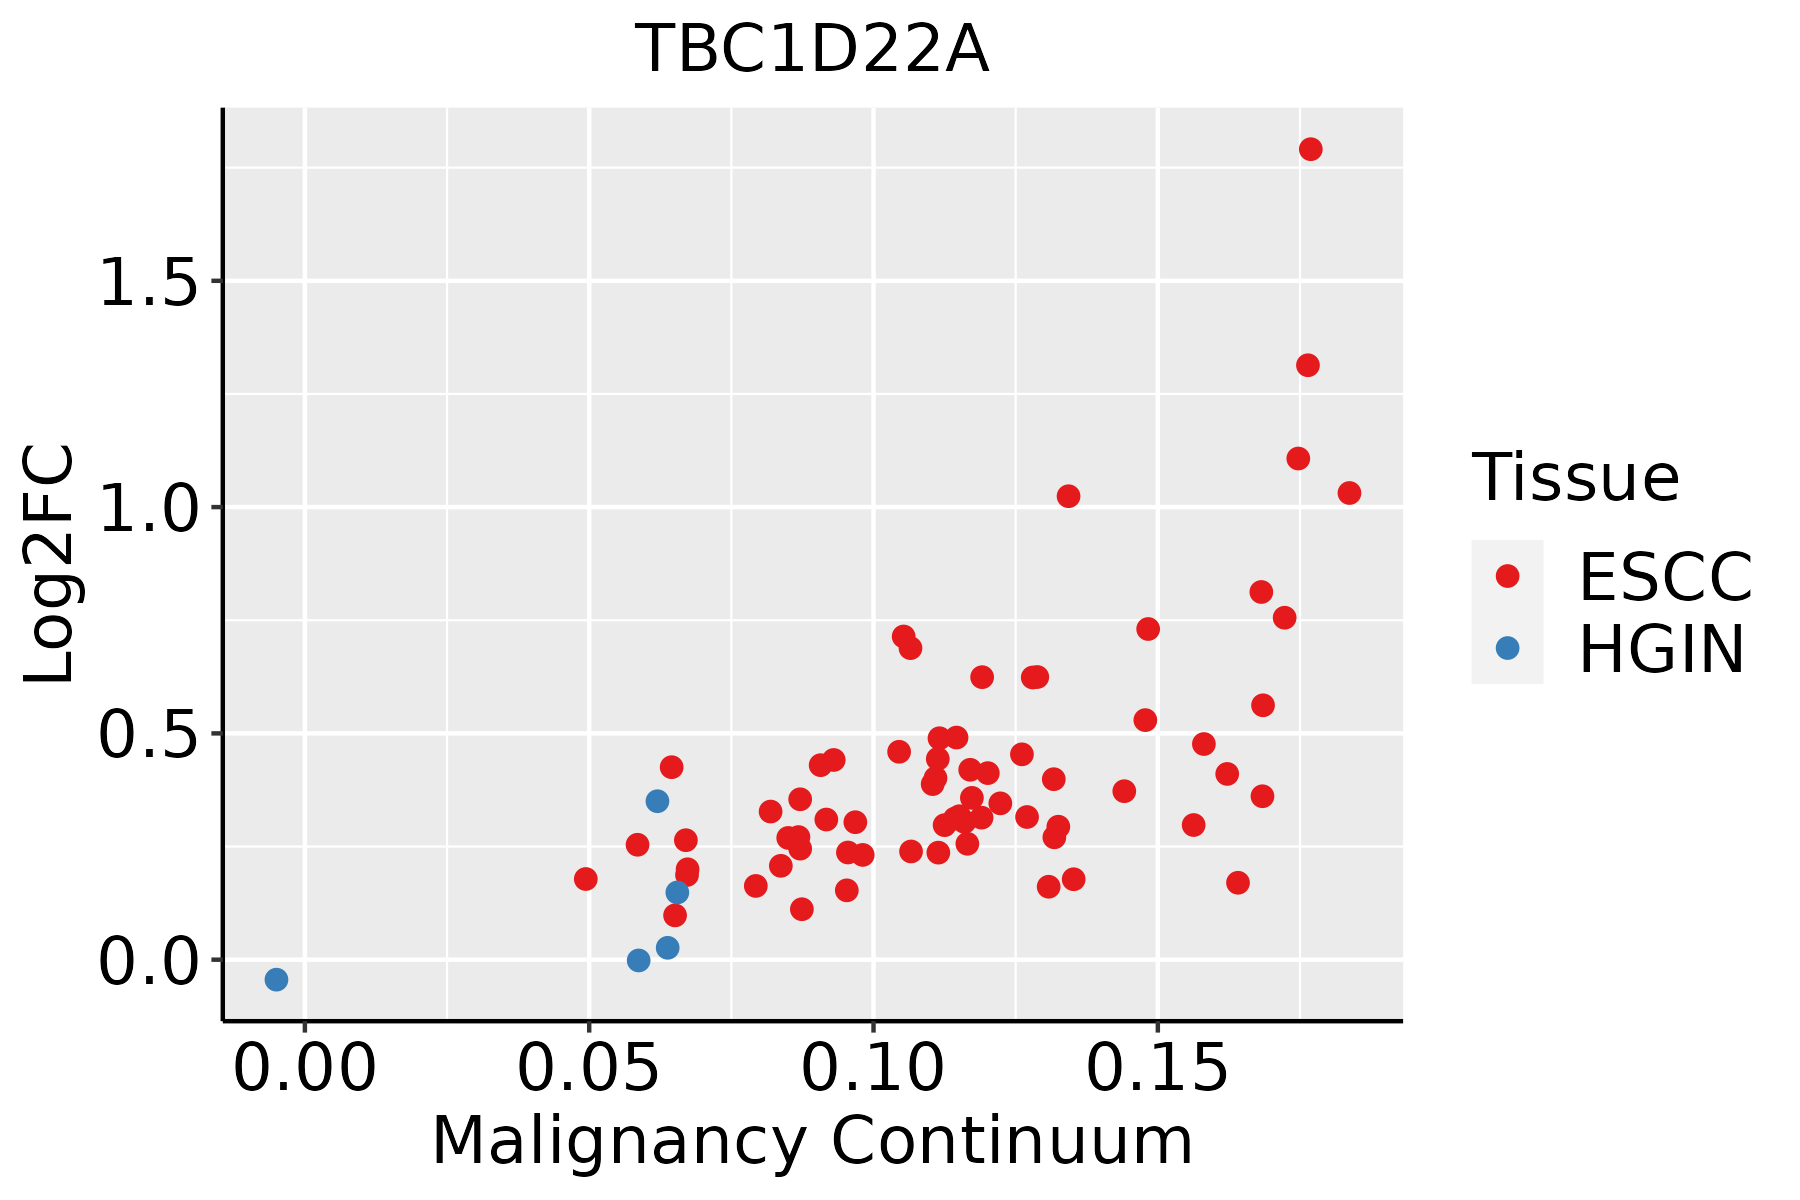 | ESCC: Esophageal squamous cell carcinoma |
| HGIN: High-grade intraepithelial neoplasias | ||
| LGIN: Low-grade intraepithelial neoplasias | ||
| Liver | 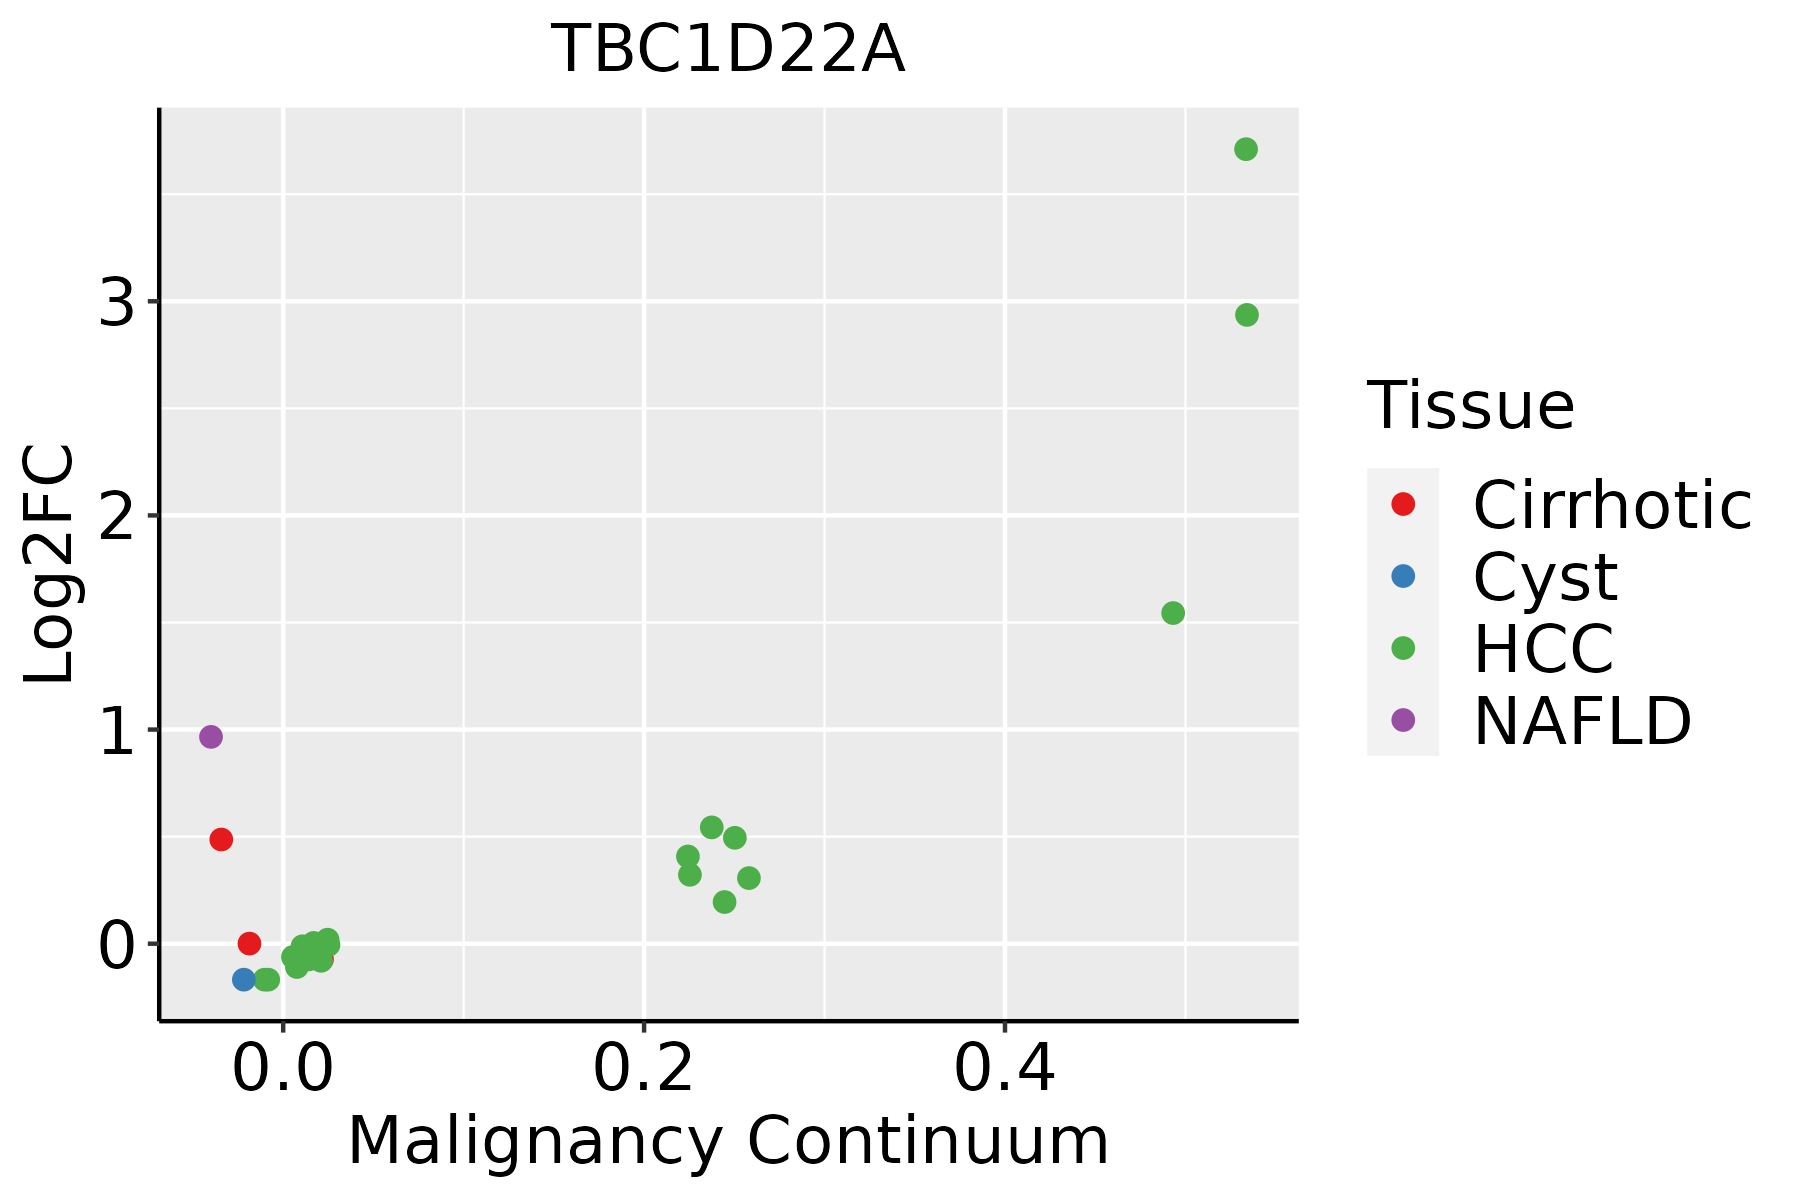 | HCC: Hepatocellular carcinoma |
| NAFLD: Non-alcoholic fatty liver disease | ||
| Lung | 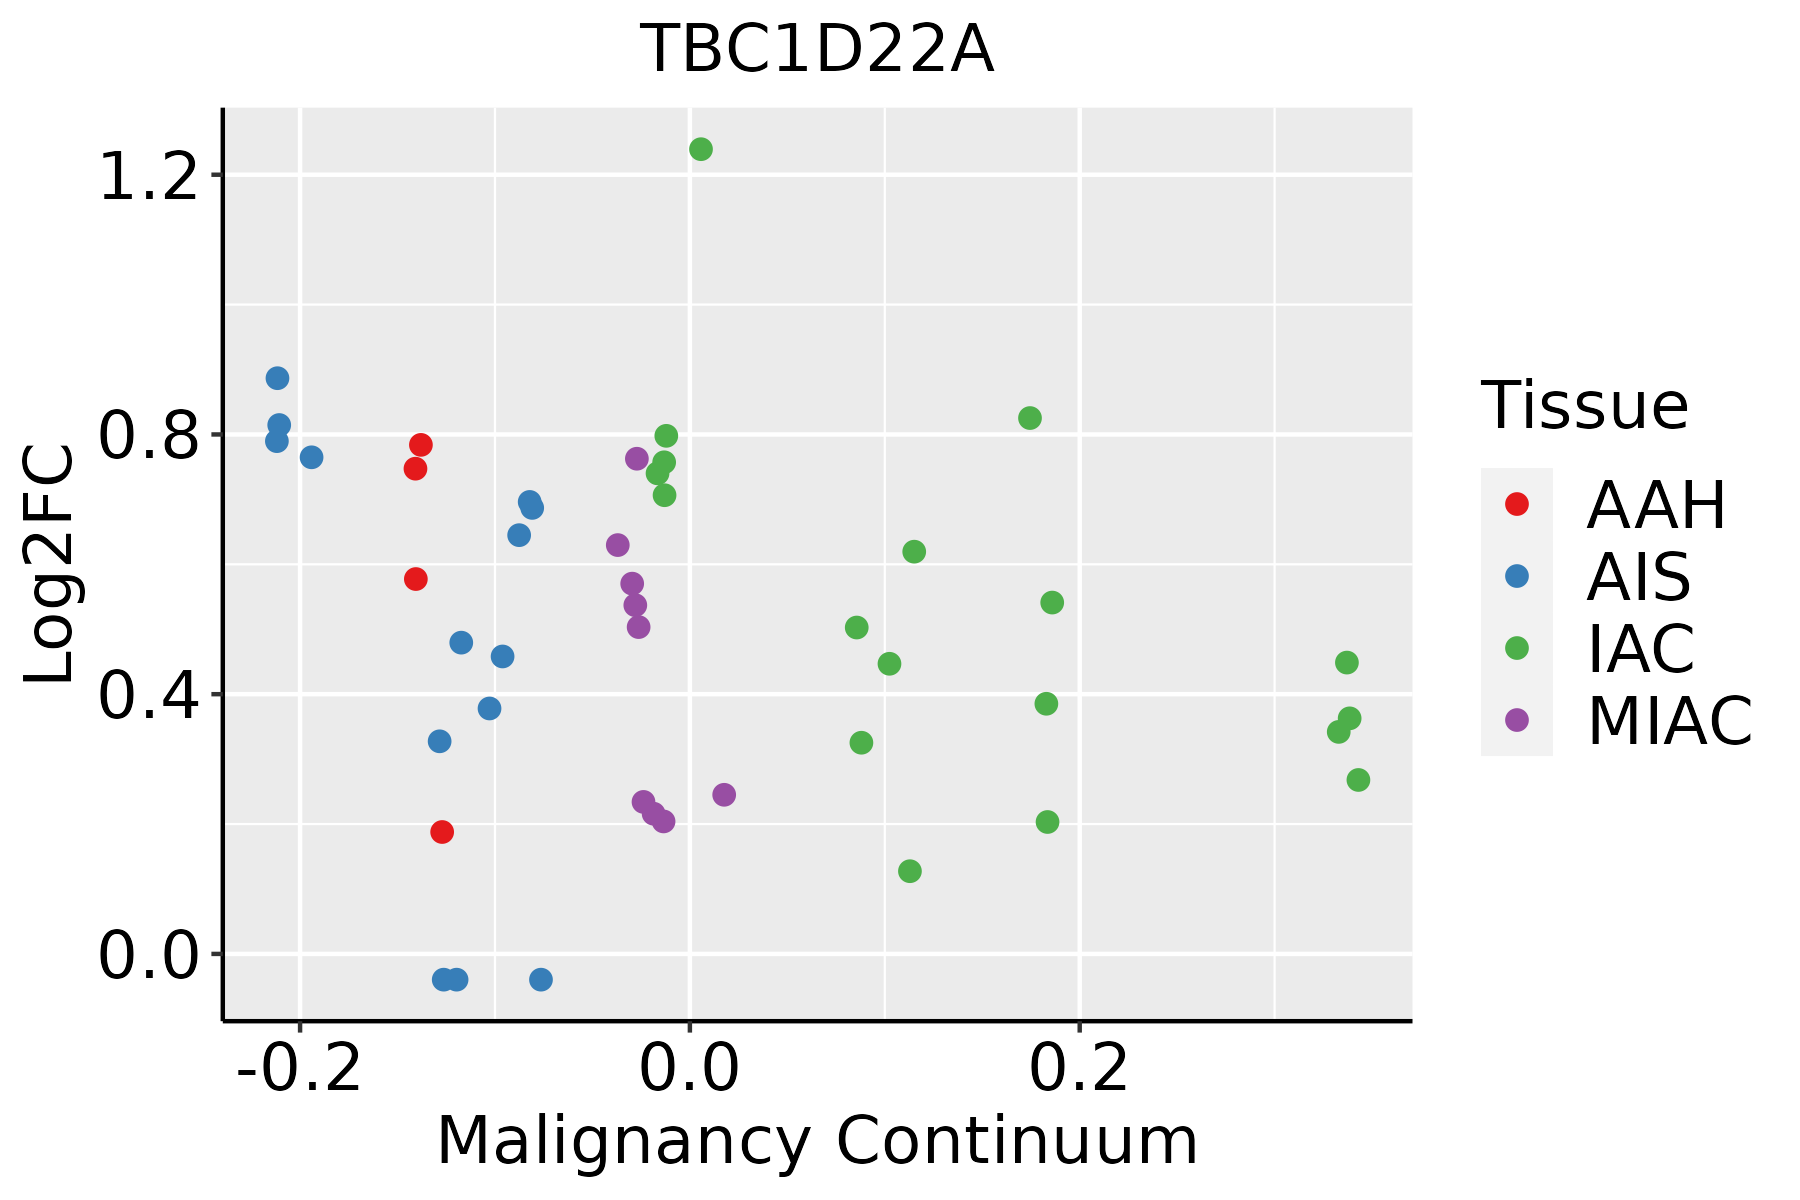 | AAH: Atypical adenomatous hyperplasia |
| AIS: Adenocarcinoma in situ | ||
| IAC: Invasive lung adenocarcinoma | ||
| MIA: Minimally invasive adenocarcinoma | ||
| Oral Cavity |  | EOLP: Erosive Oral lichen planus |
| LP: leukoplakia | ||
| NEOLP: Non-erosive oral lichen planus | ||
| OSCC: Oral squamous cell carcinoma |
| ∗log2FC in expression of this searched gene in stem-like cells from each diseased tissue sample relative to stem-like cells in normal samples in each tissue plotted against the malignancy continuum. Samples are colored based on if they are from different disease stage. |
Top |
Malignant transformation related pathway analysis |
| Find out the enriched GO biological processes and KEGG pathways involved in transition from healthy to precancer to cancer |
| Tissue | Disease Stage | Enriched GO biological Processes |
| Colorectum | AD |  |
| Colorectum | SER |  |
| Colorectum | MSS |  |
| Colorectum | MSI-H |  |
| Colorectum | FAP |  |
| ∗Top 15 enriched GO BP terms are showed in the bar plot of each disease state in each tissue. Each row represents a significant GO biological process which is colored according to the -log10(p.adjust). |
| Page: 1 2 3 4 5 6 7 8 9 |
| GO ID | Tissue | Disease Stage | Description | Gene Ratio | Bg Ratio | pvalue | p.adjust | Count |
| GO:00430877 | Cervix | CC | regulation of GTPase activity | 79/2311 | 348/18723 | 4.21e-08 | 2.60e-06 | 79 |
| GO:00435476 | Cervix | CC | positive regulation of GTPase activity | 53/2311 | 255/18723 | 8.72e-05 | 1.16e-03 | 53 |
| GO:0043087 | Colorectum | AD | regulation of GTPase activity | 110/3918 | 348/18723 | 1.64e-06 | 5.03e-05 | 110 |
| GO:0043547 | Colorectum | AD | positive regulation of GTPase activity | 75/3918 | 255/18723 | 7.95e-04 | 7.91e-03 | 75 |
| GO:00430872 | Colorectum | MSS | regulation of GTPase activity | 101/3467 | 348/18723 | 1.00e-06 | 3.46e-05 | 101 |
| GO:00435471 | Colorectum | MSS | positive regulation of GTPase activity | 68/3467 | 255/18723 | 7.97e-04 | 8.38e-03 | 68 |
| GO:00430873 | Colorectum | FAP | regulation of GTPase activity | 85/2622 | 348/18723 | 1.20e-07 | 7.68e-06 | 85 |
| GO:00435472 | Colorectum | FAP | positive regulation of GTPase activity | 61/2622 | 255/18723 | 1.39e-05 | 3.73e-04 | 61 |
| GO:0090630 | Colorectum | FAP | activation of GTPase activity | 27/2622 | 115/18723 | 4.23e-03 | 2.90e-02 | 27 |
| GO:00430874 | Colorectum | CRC | regulation of GTPase activity | 69/2078 | 348/18723 | 1.11e-06 | 6.69e-05 | 69 |
| GO:00435473 | Colorectum | CRC | positive regulation of GTPase activity | 49/2078 | 255/18723 | 8.67e-05 | 1.77e-03 | 49 |
| GO:00430878 | Endometrium | AEH | regulation of GTPase activity | 66/2100 | 348/18723 | 1.26e-05 | 2.77e-04 | 66 |
| GO:00435477 | Endometrium | AEH | positive regulation of GTPase activity | 48/2100 | 255/18723 | 2.18e-04 | 2.67e-03 | 48 |
| GO:00906304 | Endometrium | AEH | activation of GTPase activity | 22/2100 | 115/18723 | 8.42e-03 | 4.60e-02 | 22 |
| GO:004308712 | Endometrium | EEC | regulation of GTPase activity | 67/2168 | 348/18723 | 1.84e-05 | 3.43e-04 | 67 |
| GO:004354712 | Endometrium | EEC | positive regulation of GTPase activity | 50/2168 | 255/18723 | 1.26e-04 | 1.66e-03 | 50 |
| GO:009063012 | Endometrium | EEC | activation of GTPase activity | 23/2168 | 115/18723 | 6.04e-03 | 3.57e-02 | 23 |
| GO:004308715 | Esophagus | ESCC | regulation of GTPase activity | 183/8552 | 348/18723 | 5.34e-03 | 2.00e-02 | 183 |
| GO:00430875 | Liver | NAFLD | regulation of GTPase activity | 62/1882 | 348/18723 | 5.65e-06 | 2.03e-04 | 62 |
| GO:00435474 | Liver | NAFLD | positive regulation of GTPase activity | 45/1882 | 255/18723 | 1.30e-04 | 2.47e-03 | 45 |
| Page: 1 2 |
| Pathway ID | Tissue | Disease Stage | Description | Gene Ratio | Bg Ratio | pvalue | p.adjust | qvalue | Count |
| Page: 1 |
Top |
Cell-cell communication analysis |
| Identification of potential cell-cell interactions between two cell types and their ligand-receptor pairs for different disease states |
| Ligand | Receptor | LRpair | Pathway | Tissue | Disease Stage |
| Page: 1 |
Top |
Single-cell gene regulatory network inference analysis |
| Find out the significant the regulons (TFs) and the target genes of each regulon across cell types for different disease states |
| TF | Cell Type | Tissue | Disease Stage | Target Gene | RSS | Regulon Activity |
| ∗The dot plots of a searched regulon are shown for all cell subpopulations in each disease state of each tissue based on the regulon specific score inferred using pySCENIC and by calculating the average expression. |
| Page: 1 |
Top |
Somatic mutation of malignant transformation related genes |
| Annotation of somatic variants for genes involved in malignant transformation |
| Hugo Symbol | Variant Class | Variant Classification | dbSNP RS | HGVSc | HGVSp | HGVSp Short | SWISSPROT | BIOTYPE | SIFT | PolyPhen | Tumor Sample Barcode | Tissue | Histology | Sex | Age | Stage | Therapy Types | Drugs | Outcome |
| TBC1D22A | SNV | Missense_Mutation | rs369108625 | c.1000A>G | p.Ile334Val | p.I334V | Q8WUA7 | protein_coding | tolerated(0.13) | benign(0) | TCGA-A8-A094-01 | Breast | breast invasive carcinoma | Female | >=65 | I/II | Unknown | Unknown | SD |
| TBC1D22A | SNV | Missense_Mutation | c.1192C>T | p.Arg398Trp | p.R398W | Q8WUA7 | protein_coding | deleterious(0) | probably_damaging(0.999) | TCGA-AN-A0FV-01 | Breast | breast invasive carcinoma | Female | <65 | I/II | Unknown | Unknown | SD | |
| TBC1D22A | insertion | Frame_Shift_Ins | novel | c.246_247insT | p.Ala83CysfsTer22 | p.A83Cfs*22 | Q8WUA7 | protein_coding | TCGA-BH-A0DS-01 | Breast | breast invasive carcinoma | Female | >=65 | III/IV | Chemotherapy | cyclophosphamide | SD | ||
| TBC1D22A | SNV | Missense_Mutation | rs138576280 | c.1342N>A | p.Gly448Ser | p.G448S | Q8WUA7 | protein_coding | deleterious(0.01) | probably_damaging(0.957) | TCGA-2W-A8YY-01 | Cervix | cervical & endocervical cancer | Female | <65 | I/II | Chemotherapy | cisplatin | CR |
| TBC1D22A | SNV | Missense_Mutation | c.1372N>A | p.Ala458Thr | p.A458T | Q8WUA7 | protein_coding | deleterious(0) | possibly_damaging(0.896) | TCGA-A6-2672-01 | Colorectum | colon adenocarcinoma | Female | >=65 | III/IV | Unknown | Unknown | SD | |
| TBC1D22A | SNV | Missense_Mutation | novel | c.334N>T | p.Pro112Ser | p.P112S | Q8WUA7 | protein_coding | tolerated(0.74) | benign(0.006) | TCGA-A6-2677-01 | Colorectum | colon adenocarcinoma | Female | >=65 | III/IV | Ancillary | leucovorin | SD |
| TBC1D22A | SNV | Missense_Mutation | c.1372N>A | p.Ala458Thr | p.A458T | Q8WUA7 | protein_coding | deleterious(0) | possibly_damaging(0.896) | TCGA-A6-5660-01 | Colorectum | colon adenocarcinoma | Male | >=65 | III/IV | Ancillary | leucovorin | SD | |
| TBC1D22A | SNV | Missense_Mutation | rs756141681 | c.796N>A | p.Asp266Asn | p.D266N | Q8WUA7 | protein_coding | deleterious(0.04) | benign(0.015) | TCGA-AA-3510-01 | Colorectum | colon adenocarcinoma | Male | >=65 | I/II | Unknown | Unknown | SD |
| TBC1D22A | SNV | Missense_Mutation | rs771756934 | c.935G>A | p.Arg312His | p.R312H | Q8WUA7 | protein_coding | deleterious(0) | probably_damaging(0.929) | TCGA-AA-3710-01 | Colorectum | colon adenocarcinoma | Female | >=65 | I/II | Unknown | Unknown | SD |
| TBC1D22A | SNV | Missense_Mutation | c.1496C>T | p.Ala499Val | p.A499V | Q8WUA7 | protein_coding | deleterious(0) | possibly_damaging(0.451) | TCGA-AA-3864-01 | Colorectum | colon adenocarcinoma | Male | >=65 | I/II | Unknown | Unknown | SD |
| Page: 1 2 3 4 5 6 7 8 |
Top |
Related drugs of malignant transformation related genes |
| Identification of chemicals and drugs interact with genes involved in malignant transfromation |
| (DGIdb 4.0) |
| Entrez ID | Symbol | Category | Interaction Types | Drug Claim Name | Drug Name | PMIDs |
| Page: 1 |

Copyright 2023-Present -The University of Texas Health Science Center at Houston |