
|
|||||
|
 | |
| |
| |
| |
| |
| |
|
Gene: TBC1D20 |
Gene summary for TBC1D20 |
| Gene information | Species | Human | Gene symbol | TBC1D20 | Gene ID | 128637 |
| Gene name | TBC1 domain family member 20 | |
| Gene Alias | C20orf140 | |
| Cytomap | 20p13 | |
| Gene Type | protein-coding | GO ID | GO:0000003 | UniProtAcc | Q96BZ9 |
Top |
Malignant transformation analysis |
| Identification of the aberrant gene expression in precancerous and cancerous lesions by comparing the gene expression of stem-like cells in diseased tissues with normal stem cells |
| Entrez ID | Symbol | Replicates | Species | Organ | Tissue | Adj P-value | Log2FC | Malignancy |
| 128637 | TBC1D20 | LZE2T | Human | Esophagus | ESCC | 2.07e-04 | 3.75e-01 | 0.082 |
| 128637 | TBC1D20 | LZE4T | Human | Esophagus | ESCC | 1.51e-05 | 1.43e-01 | 0.0811 |
| 128637 | TBC1D20 | LZE20T | Human | Esophagus | ESCC | 1.17e-02 | 1.24e-01 | 0.0662 |
| 128637 | TBC1D20 | LZE24T | Human | Esophagus | ESCC | 8.34e-11 | 3.15e-01 | 0.0596 |
| 128637 | TBC1D20 | P1T-E | Human | Esophagus | ESCC | 8.69e-10 | 3.91e-01 | 0.0875 |
| 128637 | TBC1D20 | P2T-E | Human | Esophagus | ESCC | 7.00e-27 | 3.81e-01 | 0.1177 |
| 128637 | TBC1D20 | P4T-E | Human | Esophagus | ESCC | 6.86e-25 | 4.89e-01 | 0.1323 |
| 128637 | TBC1D20 | P5T-E | Human | Esophagus | ESCC | 2.83e-03 | 1.51e-01 | 0.1327 |
| 128637 | TBC1D20 | P8T-E | Human | Esophagus | ESCC | 5.81e-14 | 2.23e-01 | 0.0889 |
| 128637 | TBC1D20 | P9T-E | Human | Esophagus | ESCC | 2.57e-17 | 3.50e-01 | 0.1131 |
| 128637 | TBC1D20 | P10T-E | Human | Esophagus | ESCC | 4.08e-22 | 4.36e-01 | 0.116 |
| 128637 | TBC1D20 | P11T-E | Human | Esophagus | ESCC | 2.27e-18 | 4.75e-01 | 0.1426 |
| 128637 | TBC1D20 | P12T-E | Human | Esophagus | ESCC | 2.28e-27 | 5.40e-01 | 0.1122 |
| 128637 | TBC1D20 | P15T-E | Human | Esophagus | ESCC | 7.20e-25 | 4.36e-01 | 0.1149 |
| 128637 | TBC1D20 | P16T-E | Human | Esophagus | ESCC | 1.21e-19 | 4.05e-01 | 0.1153 |
| 128637 | TBC1D20 | P17T-E | Human | Esophagus | ESCC | 4.08e-07 | 2.89e-01 | 0.1278 |
| 128637 | TBC1D20 | P19T-E | Human | Esophagus | ESCC | 4.10e-05 | 2.74e-01 | 0.1662 |
| 128637 | TBC1D20 | P20T-E | Human | Esophagus | ESCC | 9.90e-20 | 3.56e-01 | 0.1124 |
| 128637 | TBC1D20 | P21T-E | Human | Esophagus | ESCC | 2.26e-31 | 5.51e-01 | 0.1617 |
| 128637 | TBC1D20 | P22T-E | Human | Esophagus | ESCC | 2.56e-16 | 2.66e-01 | 0.1236 |
| Page: 1 2 3 4 5 |
| Tissue | Expression Dynamics | Abbreviation |
| Esophagus | 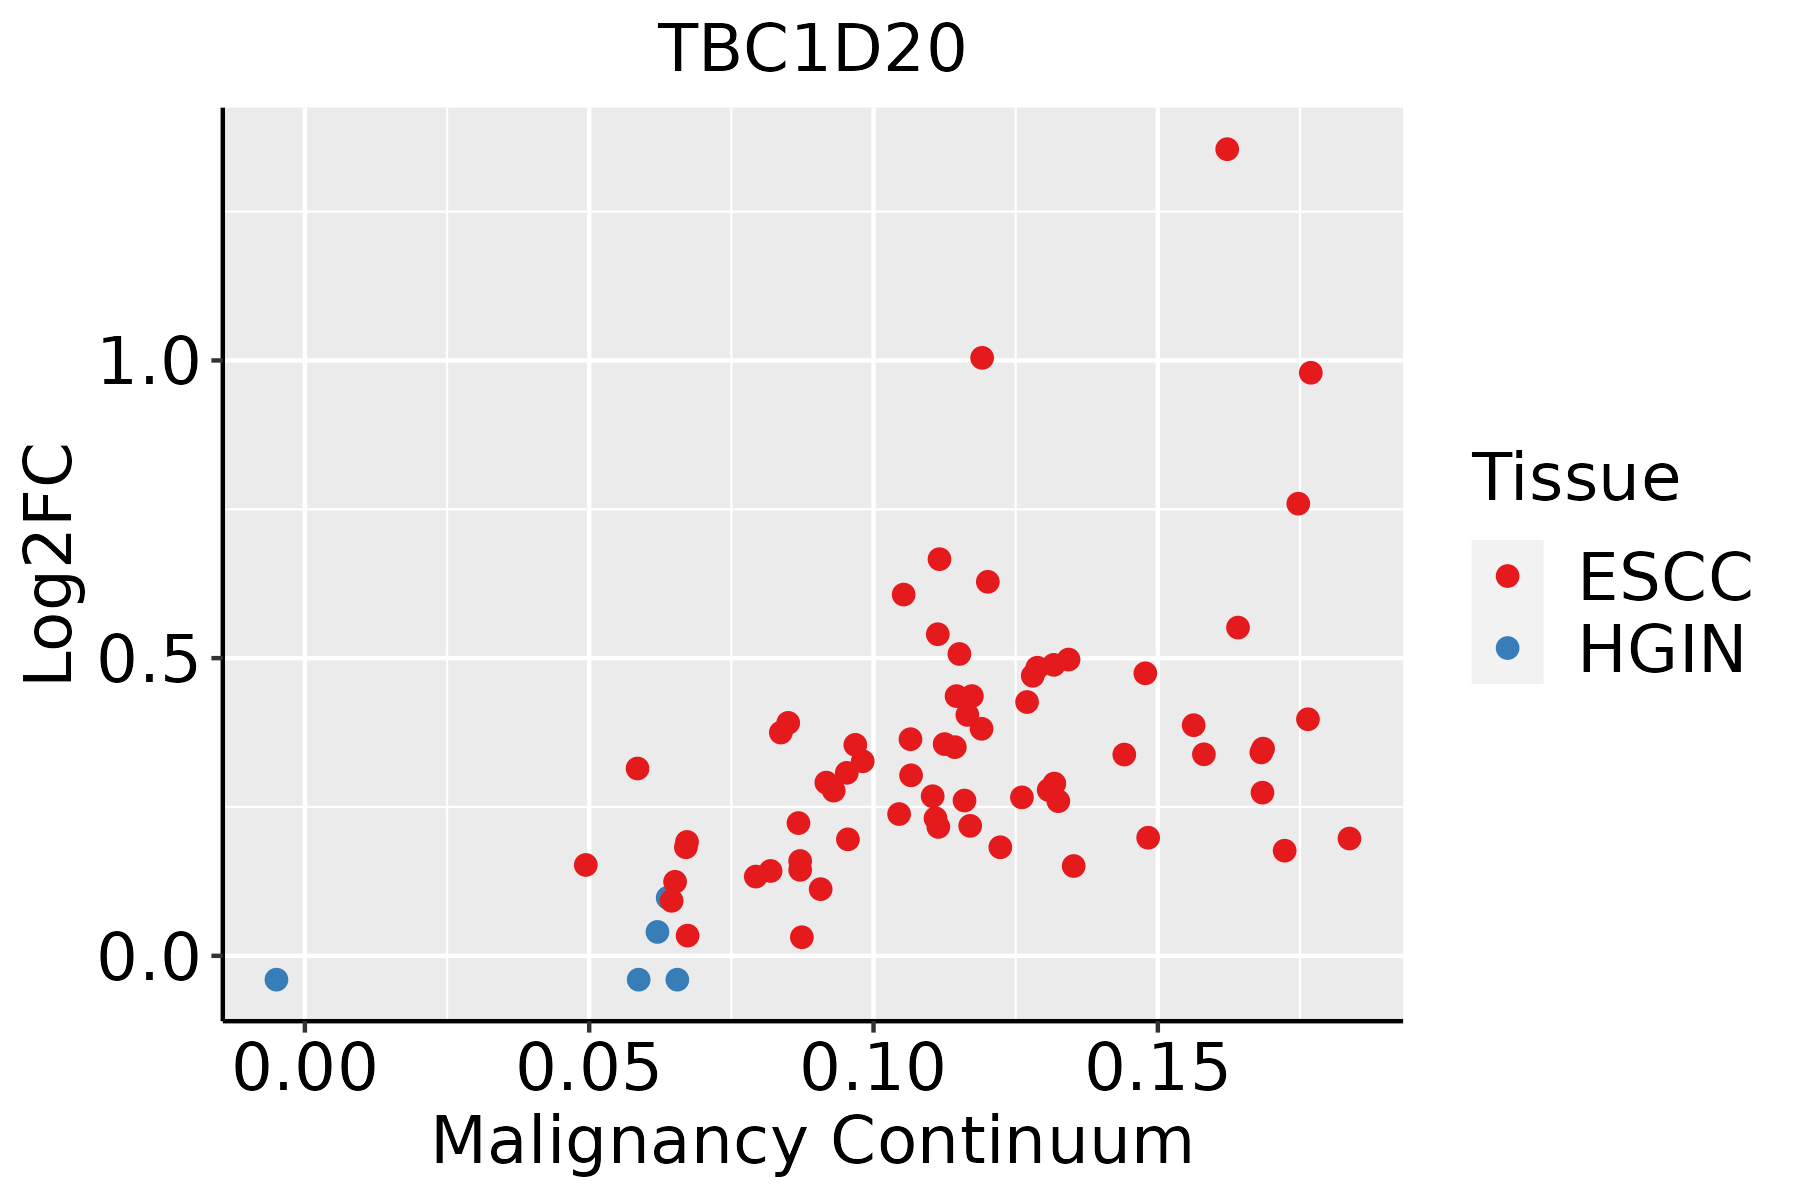 | ESCC: Esophageal squamous cell carcinoma |
| HGIN: High-grade intraepithelial neoplasias | ||
| LGIN: Low-grade intraepithelial neoplasias | ||
| Liver | 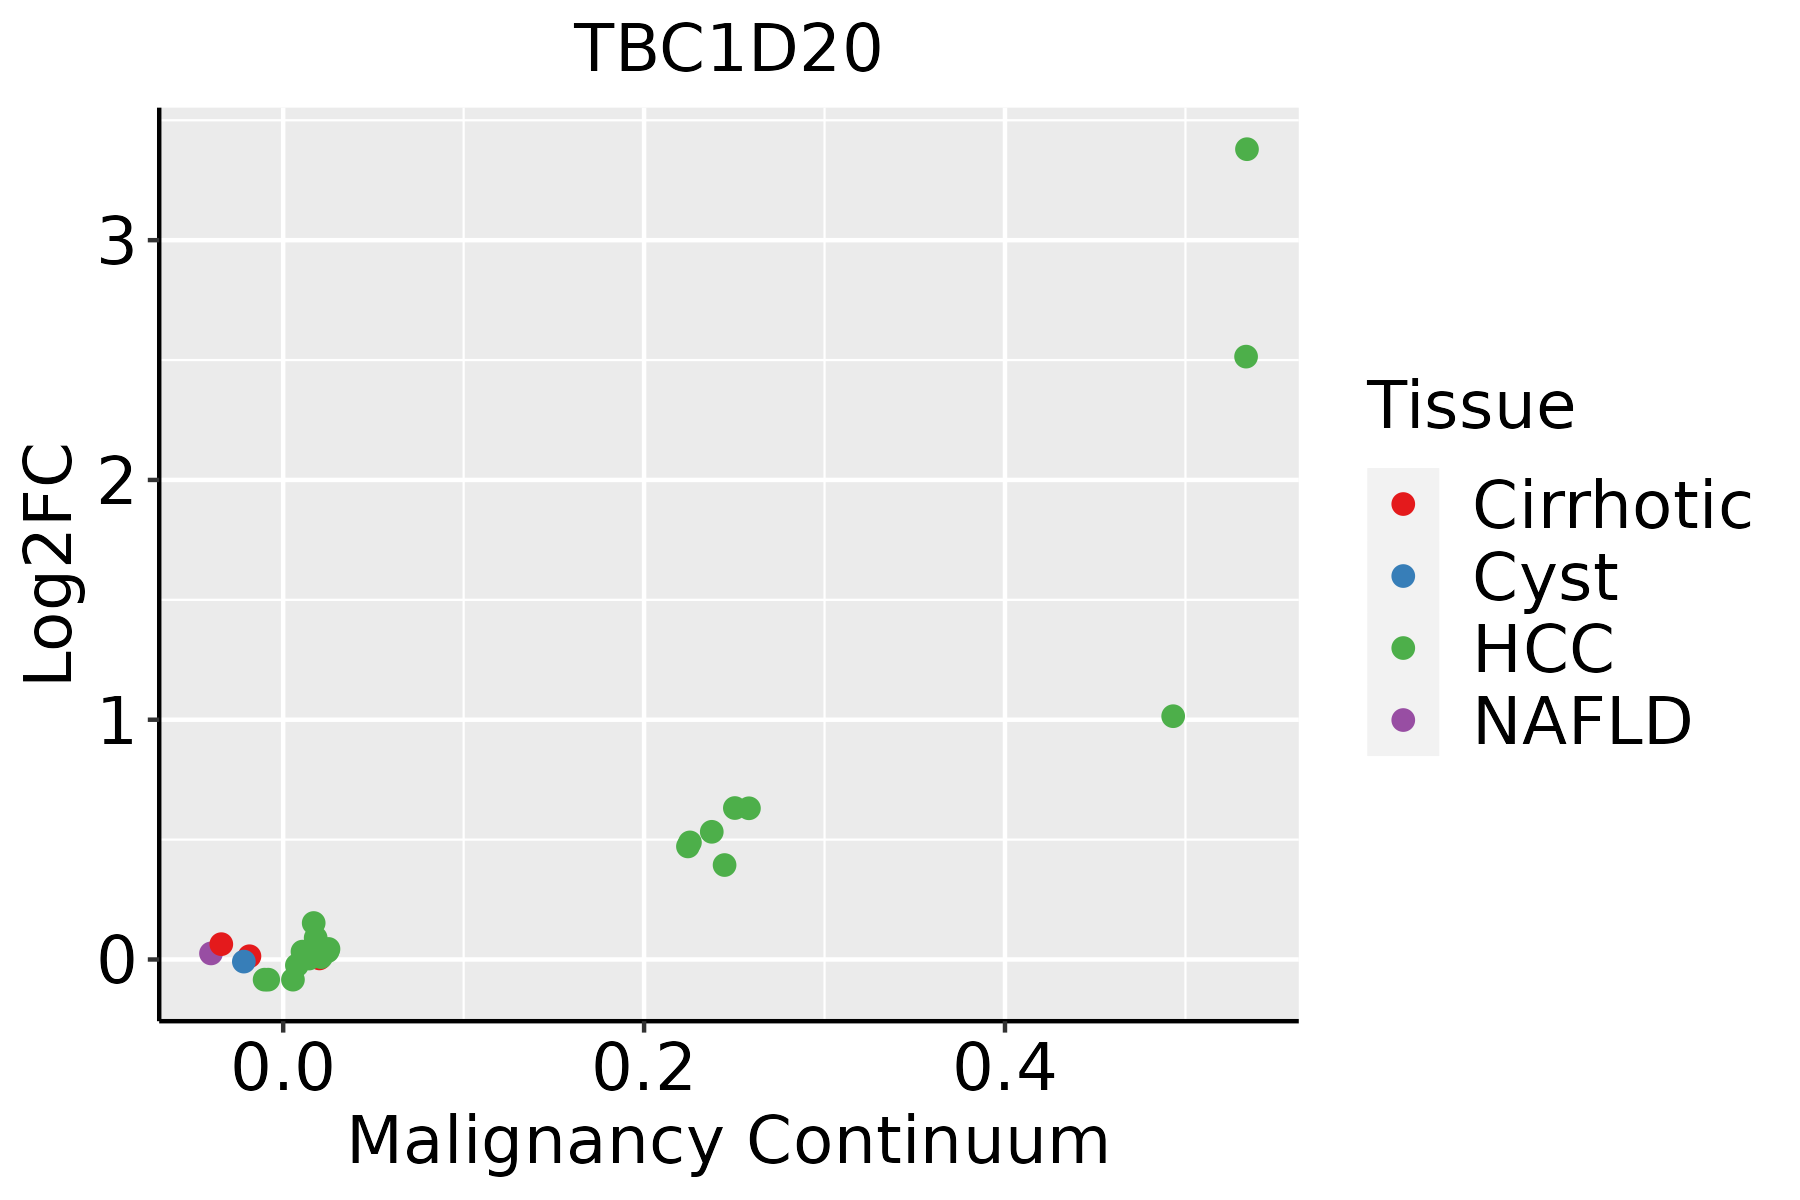 | HCC: Hepatocellular carcinoma |
| NAFLD: Non-alcoholic fatty liver disease | ||
| Oral Cavity | 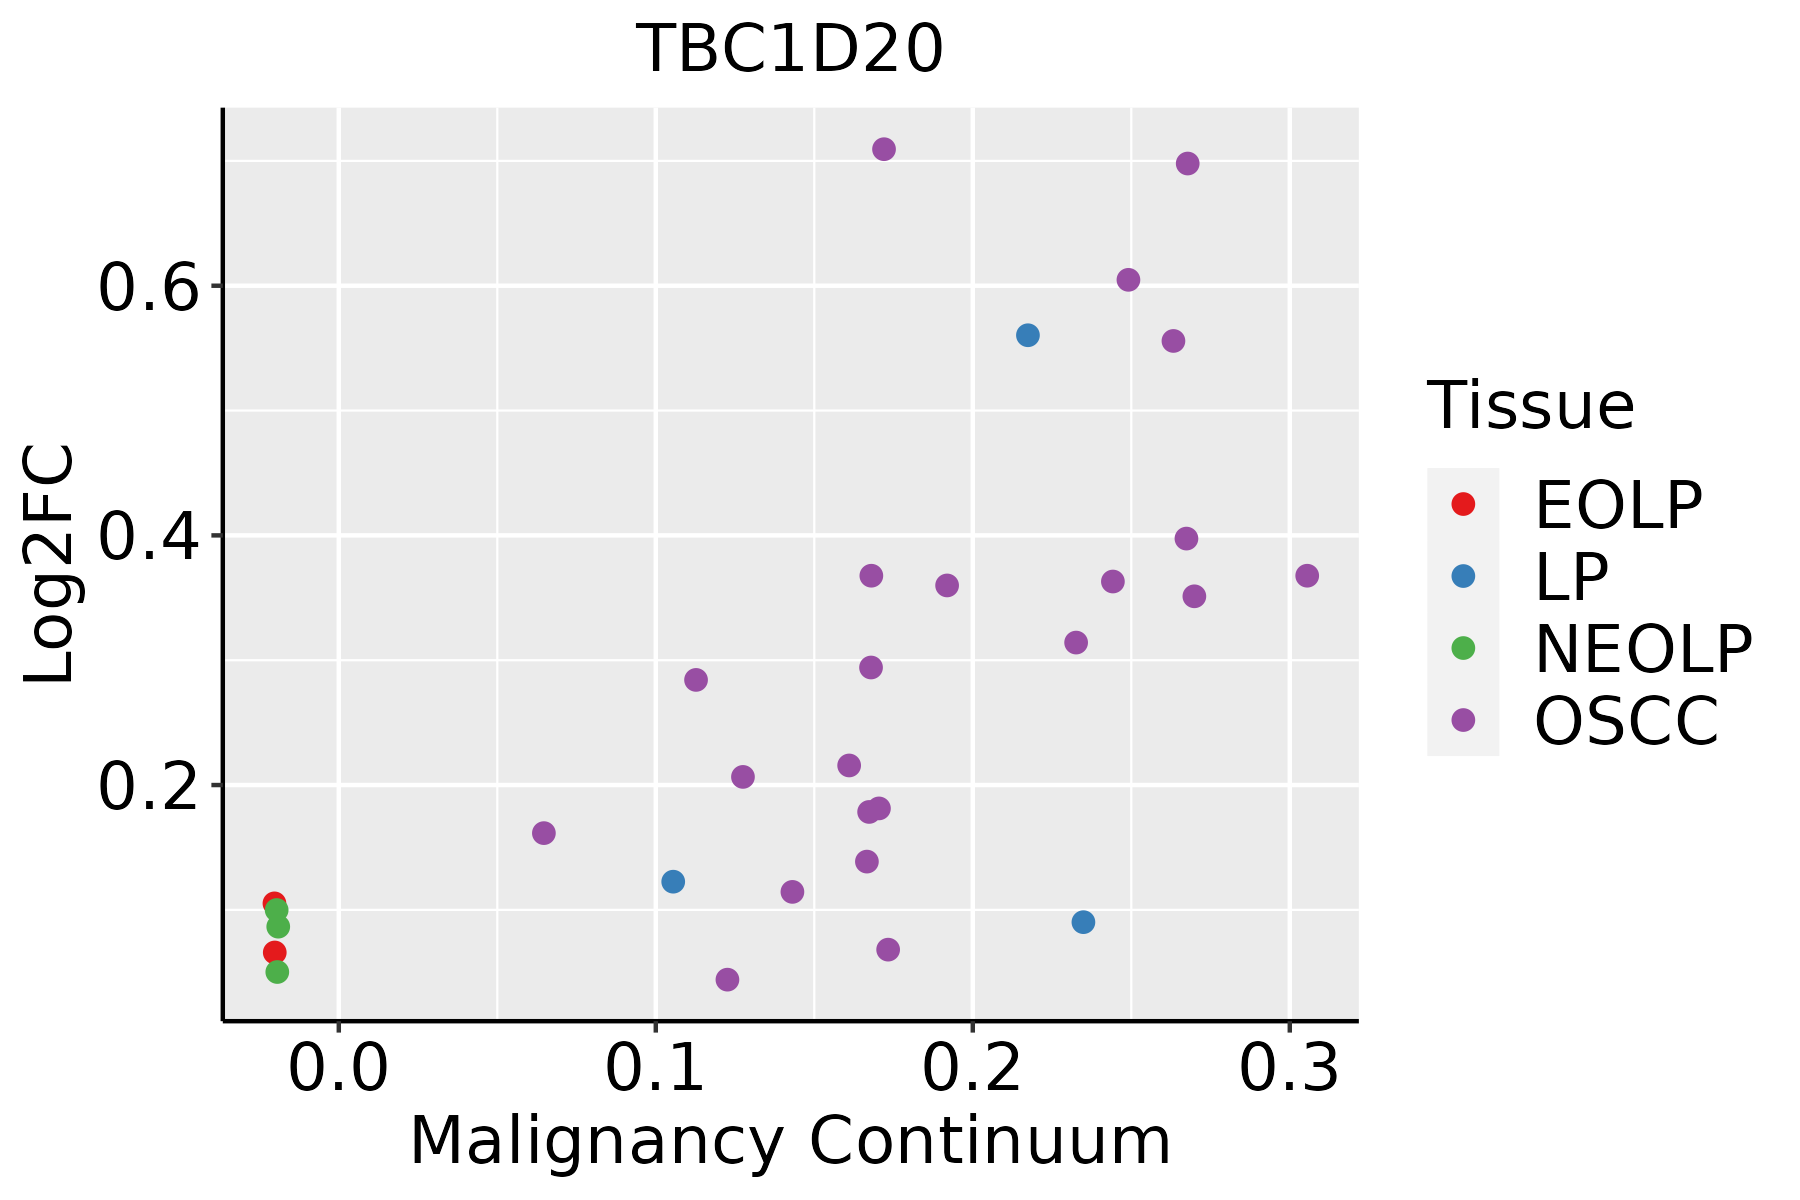 | EOLP: Erosive Oral lichen planus |
| LP: leukoplakia | ||
| NEOLP: Non-erosive oral lichen planus | ||
| OSCC: Oral squamous cell carcinoma | ||
| Thyroid | 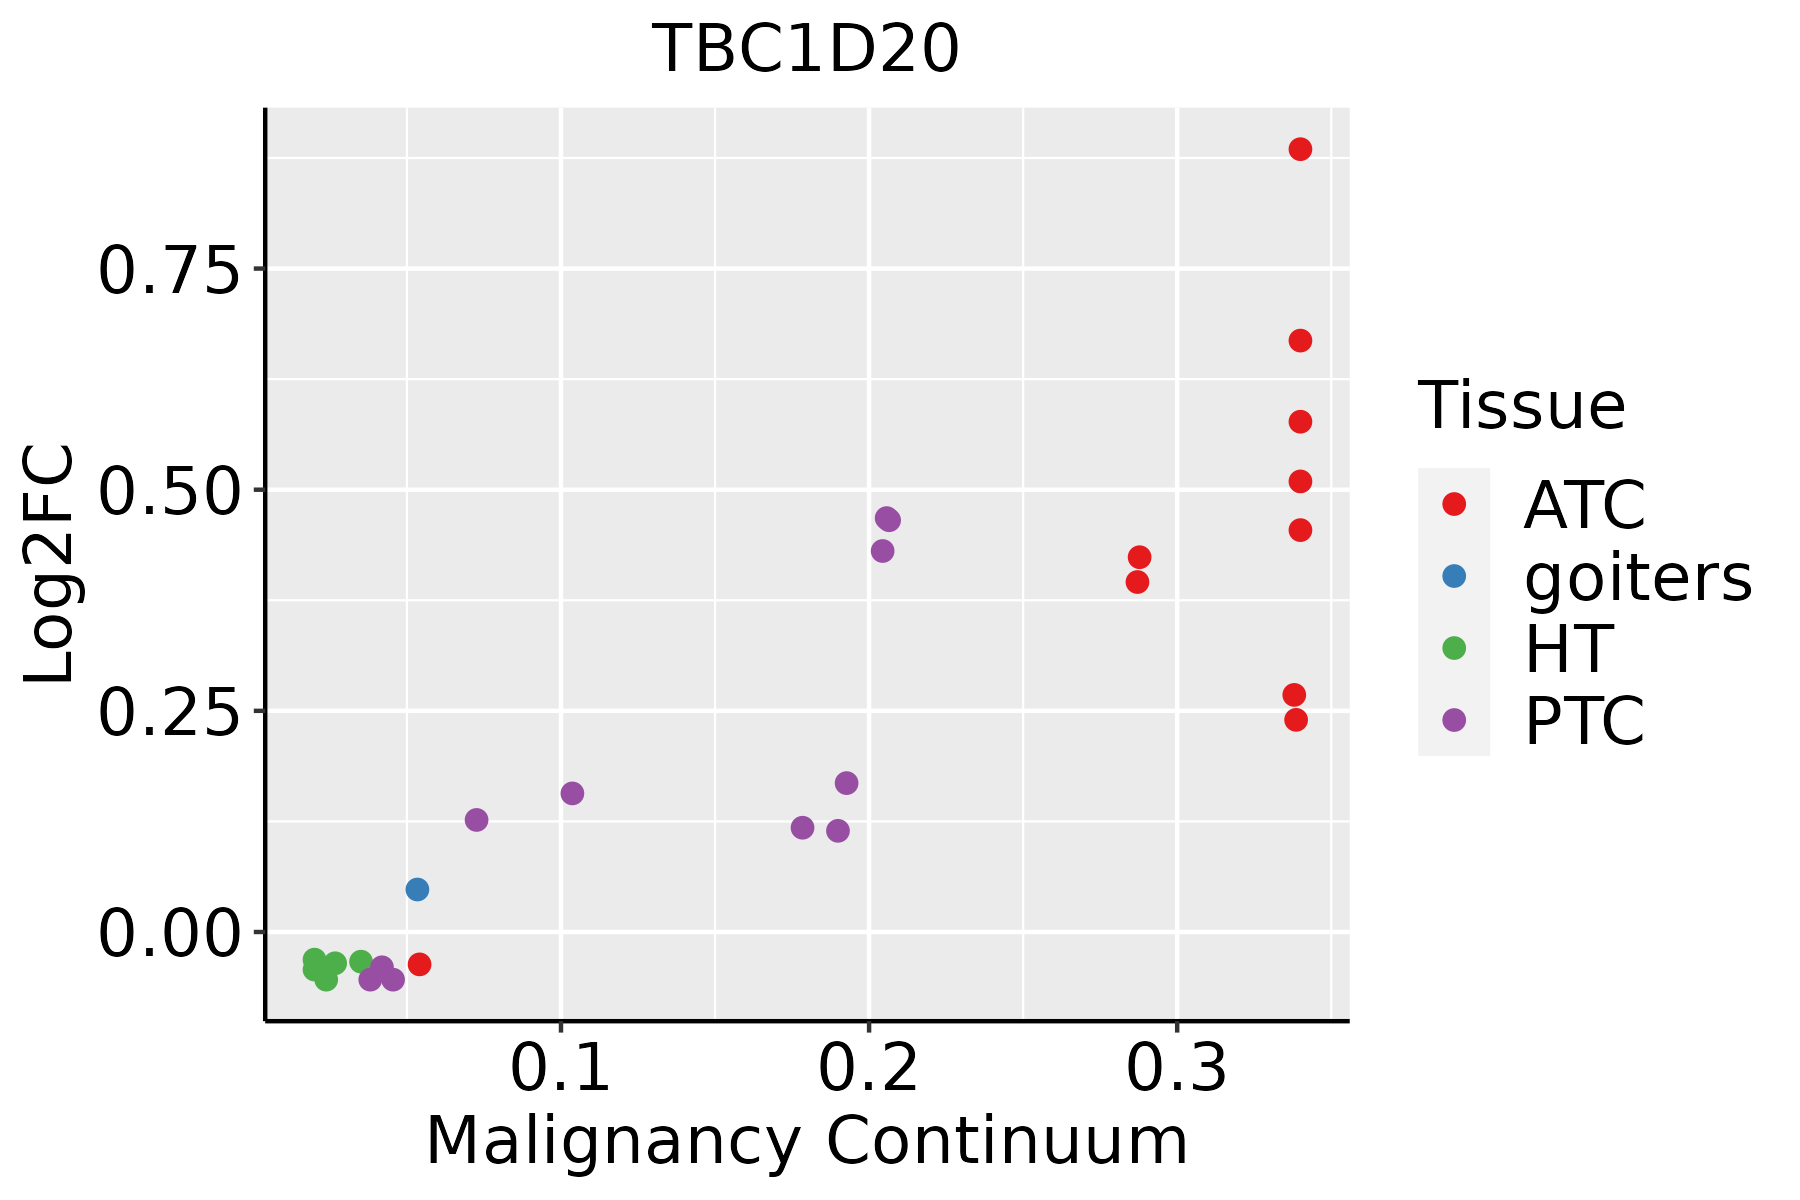 | ATC: Anaplastic thyroid cancer |
| HT: Hashimoto's thyroiditis | ||
| PTC: Papillary thyroid cancer |
| ∗log2FC in expression of this searched gene in stem-like cells from each diseased tissue sample relative to stem-like cells in normal samples in each tissue plotted against the malignancy continuum. Samples are colored based on if they are from different disease stage. |
Top |
Malignant transformation related pathway analysis |
| Find out the enriched GO biological processes and KEGG pathways involved in transition from healthy to precancer to cancer |
| Tissue | Disease Stage | Enriched GO biological Processes |
| Colorectum | AD |  |
| Colorectum | SER |  |
| Colorectum | MSS |  |
| Colorectum | MSI-H |  |
| Colorectum | FAP |  |
| ∗Top 15 enriched GO BP terms are showed in the bar plot of each disease state in each tissue. Each row represents a significant GO biological process which is colored according to the -log10(p.adjust). |
| Page: 1 2 3 4 5 6 7 8 9 |
| GO ID | Tissue | Disease Stage | Description | Gene Ratio | Bg Ratio | pvalue | p.adjust | Count |
| GO:004819318 | Esophagus | ESCC | Golgi vesicle transport | 231/8552 | 296/18723 | 1.82e-30 | 9.63e-28 | 231 |
| GO:0016032111 | Esophagus | ESCC | viral process | 301/8552 | 415/18723 | 3.34e-29 | 1.32e-26 | 301 |
| GO:003238618 | Esophagus | ESCC | regulation of intracellular transport | 243/8552 | 337/18723 | 3.20e-23 | 7.25e-21 | 243 |
| GO:0019058111 | Esophagus | ESCC | viral life cycle | 226/8552 | 317/18723 | 1.17e-20 | 1.76e-18 | 226 |
| GO:001605014 | Esophagus | ESCC | vesicle organization | 211/8552 | 300/18723 | 2.85e-18 | 2.87e-16 | 211 |
| GO:0032388110 | Esophagus | ESCC | positive regulation of intracellular transport | 152/8552 | 202/18723 | 7.89e-18 | 7.36e-16 | 152 |
| GO:000688815 | Esophagus | ESCC | endoplasmic reticulum to Golgi vesicle-mediated transport | 102/8552 | 130/18723 | 1.73e-14 | 9.22e-13 | 102 |
| GO:0019079111 | Esophagus | ESCC | viral genome replication | 102/8552 | 131/18723 | 4.31e-14 | 2.19e-12 | 102 |
| GO:0050792111 | Esophagus | ESCC | regulation of viral process | 119/8552 | 164/18723 | 2.19e-12 | 9.03e-11 | 119 |
| GO:0006900111 | Esophagus | ESCC | vesicle budding from membrane | 54/8552 | 61/18723 | 2.66e-12 | 1.07e-10 | 54 |
| GO:0044403111 | Esophagus | ESCC | biological process involved in symbiotic interaction | 186/8552 | 290/18723 | 1.43e-10 | 4.16e-09 | 186 |
| GO:0048524110 | Esophagus | ESCC | positive regulation of viral process | 52/8552 | 65/18723 | 1.41e-08 | 2.77e-07 | 52 |
| GO:009011414 | Esophagus | ESCC | COPII-coated vesicle budding | 27/8552 | 29/18723 | 8.09e-08 | 1.39e-06 | 27 |
| GO:001906815 | Esophagus | ESCC | virion assembly | 31/8552 | 35/18723 | 1.40e-07 | 2.25e-06 | 31 |
| GO:0061458110 | Esophagus | ESCC | reproductive system development | 247/8552 | 427/18723 | 2.24e-07 | 3.42e-06 | 247 |
| GO:004860818 | Esophagus | ESCC | reproductive structure development | 245/8552 | 424/18723 | 2.82e-07 | 4.14e-06 | 245 |
| GO:000206420 | Esophagus | ESCC | epithelial cell development | 136/8552 | 220/18723 | 9.50e-07 | 1.21e-05 | 136 |
| GO:00070308 | Esophagus | ESCC | Golgi organization | 101/8552 | 157/18723 | 1.78e-06 | 2.10e-05 | 101 |
| GO:005185115 | Esophagus | ESCC | modulation by host of symbiont process | 43/8552 | 60/18723 | 4.00e-05 | 3.22e-04 | 43 |
| GO:005181714 | Esophagus | ESCC | modulation of process of other organism involved in symbiotic interaction | 54/8552 | 81/18723 | 1.09e-04 | 7.64e-04 | 54 |
| Page: 1 2 3 4 5 6 7 8 |
| Pathway ID | Tissue | Disease Stage | Description | Gene Ratio | Bg Ratio | pvalue | p.adjust | qvalue | Count |
| Page: 1 |
Top |
Cell-cell communication analysis |
| Identification of potential cell-cell interactions between two cell types and their ligand-receptor pairs for different disease states |
| Ligand | Receptor | LRpair | Pathway | Tissue | Disease Stage |
| Page: 1 |
Top |
Single-cell gene regulatory network inference analysis |
| Find out the significant the regulons (TFs) and the target genes of each regulon across cell types for different disease states |
| TF | Cell Type | Tissue | Disease Stage | Target Gene | RSS | Regulon Activity |
| ∗The dot plots of a searched regulon are shown for all cell subpopulations in each disease state of each tissue based on the regulon specific score inferred using pySCENIC and by calculating the average expression. |
| Page: 1 |
Top |
Somatic mutation of malignant transformation related genes |
| Annotation of somatic variants for genes involved in malignant transformation |
| Hugo Symbol | Variant Class | Variant Classification | dbSNP RS | HGVSc | HGVSp | HGVSp Short | SWISSPROT | BIOTYPE | SIFT | PolyPhen | Tumor Sample Barcode | Tissue | Histology | Sex | Age | Stage | Therapy Types | Drugs | Outcome |
| TBC1D20 | SNV | Missense_Mutation | c.570N>A | p.Asn190Lys | p.N190K | Q96BZ9 | protein_coding | deleterious(0) | probably_damaging(0.968) | TCGA-A8-A08H-01 | Breast | breast invasive carcinoma | Female | >=65 | I/II | Unknown | Unknown | SD | |
| TBC1D20 | SNV | Missense_Mutation | c.736N>A | p.His246Asn | p.H246N | Q96BZ9 | protein_coding | tolerated(0.09) | benign(0.272) | TCGA-AR-A256-01 | Breast | breast invasive carcinoma | Female | <65 | I/II | Chemotherapy | doxorubicin | PD | |
| TBC1D20 | SNV | Missense_Mutation | rs866434631 | c.364N>A | p.Leu122Ile | p.L122I | Q96BZ9 | protein_coding | deleterious(0.01) | probably_damaging(1) | TCGA-E9-A295-01 | Breast | breast invasive carcinoma | Female | >=65 | I/II | Hormone Therapy | tamoxiphen | SD |
| TBC1D20 | deletion | Frame_Shift_Del | novel | c.582delN | p.Ile195SerfsTer5 | p.I195Sfs*5 | Q96BZ9 | protein_coding | TCGA-EW-A2FV-01 | Breast | breast invasive carcinoma | Female | <65 | III/IV | Chemotherapy | docetaxel | SD | ||
| TBC1D20 | SNV | Missense_Mutation | c.1064N>T | p.Thr355Ile | p.T355I | Q96BZ9 | protein_coding | tolerated(0.17) | benign(0.009) | TCGA-A6-3809-01 | Colorectum | colon adenocarcinoma | Female | >=65 | I/II | Unknown | Unknown | SD | |
| TBC1D20 | SNV | Missense_Mutation | novel | c.551A>C | p.Asn184Thr | p.N184T | Q96BZ9 | protein_coding | tolerated(0.1) | possibly_damaging(0.577) | TCGA-AA-3947-01 | Colorectum | colon adenocarcinoma | Female | <65 | I/II | Unknown | Unknown | SD |
| TBC1D20 | SNV | Missense_Mutation | c.896T>G | p.Phe299Cys | p.F299C | Q96BZ9 | protein_coding | deleterious(0) | possibly_damaging(0.821) | TCGA-AA-A010-01 | Colorectum | colon adenocarcinoma | Female | <65 | I/II | Chemotherapy | folinic | CR | |
| TBC1D20 | SNV | Missense_Mutation | rs756036966 | c.916N>A | p.Glu306Lys | p.E306K | Q96BZ9 | protein_coding | tolerated(0.48) | benign(0) | TCGA-AZ-4315-01 | Colorectum | colon adenocarcinoma | Male | <65 | I/II | Unknown | Unknown | SD |
| TBC1D20 | SNV | Missense_Mutation | c.108N>G | p.Ile36Met | p.I36M | Q96BZ9 | protein_coding | deleterious(0) | probably_damaging(0.999) | TCGA-CK-5915-01 | Colorectum | colon adenocarcinoma | Male | <65 | I/II | Unknown | Unknown | SD | |
| TBC1D20 | SNV | Missense_Mutation | c.178N>A | p.Leu60Ile | p.L60I | Q96BZ9 | protein_coding | deleterious(0.01) | probably_damaging(0.955) | TCGA-G4-6628-01 | Colorectum | colon adenocarcinoma | Male | >=65 | I/II | Unknown | Unknown | SD |
| Page: 1 2 3 4 |
Top |
Related drugs of malignant transformation related genes |
| Identification of chemicals and drugs interact with genes involved in malignant transfromation |
| (DGIdb 4.0) |
| Entrez ID | Symbol | Category | Interaction Types | Drug Claim Name | Drug Name | PMIDs |
| Page: 1 |

Copyright 2023-Present -The University of Texas Health Science Center at Houston |