
|
|||||
|
 | |
| |
| |
| |
| |
| |
|
Gene: TBC1D16 |
Gene summary for TBC1D16 |
| Gene information | Species | Human | Gene symbol | TBC1D16 | Gene ID | 125058 |
| Gene name | TBC1 domain family member 16 | |
| Gene Alias | TBC1D16 | |
| Cytomap | 17q25.3 | |
| Gene Type | protein-coding | GO ID | GO:0001881 | UniProtAcc | Q8TBP0 |
Top |
Malignant transformation analysis |
| Identification of the aberrant gene expression in precancerous and cancerous lesions by comparing the gene expression of stem-like cells in diseased tissues with normal stem cells |
| Entrez ID | Symbol | Replicates | Species | Organ | Tissue | Adj P-value | Log2FC | Malignancy |
| 125058 | TBC1D16 | HTA11_1391_2000001011 | Human | Colorectum | AD | 4.78e-02 | 3.98e-01 | -0.059 |
| 125058 | TBC1D16 | HTA11_7696_3000711011 | Human | Colorectum | AD | 4.77e-03 | 3.74e-01 | 0.0674 |
| 125058 | TBC1D16 | HTA11_99999965104_69814 | Human | Colorectum | MSS | 1.18e-05 | 5.78e-01 | 0.281 |
| 125058 | TBC1D16 | HTA11_99999971662_82457 | Human | Colorectum | MSS | 5.85e-11 | 5.37e-01 | 0.3859 |
| 125058 | TBC1D16 | HTA11_99999973899_84307 | Human | Colorectum | MSS | 2.31e-03 | 5.63e-01 | 0.2585 |
| 125058 | TBC1D16 | HTA11_99999974143_84620 | Human | Colorectum | MSS | 4.99e-17 | 6.82e-01 | 0.3005 |
| 125058 | TBC1D16 | A015-C-203 | Human | Colorectum | FAP | 6.28e-07 | -6.35e-02 | -0.1294 |
| 125058 | TBC1D16 | A002-C-205 | Human | Colorectum | FAP | 9.11e-06 | 4.97e-02 | -0.1236 |
| 125058 | TBC1D16 | A015-C-006 | Human | Colorectum | FAP | 5.71e-03 | 6.11e-02 | -0.0994 |
| 125058 | TBC1D16 | A002-C-114 | Human | Colorectum | FAP | 8.53e-04 | -2.61e-02 | -0.1561 |
| 125058 | TBC1D16 | A015-C-104 | Human | Colorectum | FAP | 5.32e-07 | -7.26e-02 | -0.1899 |
| 125058 | TBC1D16 | A002-C-016 | Human | Colorectum | FAP | 1.15e-03 | -6.70e-02 | 0.0521 |
| 125058 | TBC1D16 | A002-C-116 | Human | Colorectum | FAP | 2.18e-09 | -6.21e-02 | -0.0452 |
| 125058 | TBC1D16 | A014-C-008 | Human | Colorectum | FAP | 1.41e-03 | 1.58e-01 | -0.191 |
| 125058 | TBC1D16 | A018-E-020 | Human | Colorectum | FAP | 3.23e-03 | -4.62e-02 | -0.2034 |
| 125058 | TBC1D16 | F034 | Human | Colorectum | FAP | 2.22e-04 | 1.01e-01 | -0.0665 |
| 125058 | TBC1D16 | LZE7T | Human | Esophagus | ESCC | 3.75e-03 | 2.98e-01 | 0.0667 |
| 125058 | TBC1D16 | LZE24T | Human | Esophagus | ESCC | 7.06e-08 | 2.48e-01 | 0.0596 |
| 125058 | TBC1D16 | P2T-E | Human | Esophagus | ESCC | 2.50e-10 | 1.69e-01 | 0.1177 |
| 125058 | TBC1D16 | P4T-E | Human | Esophagus | ESCC | 7.73e-03 | 1.26e-01 | 0.1323 |
| Page: 1 2 3 4 |
| Tissue | Expression Dynamics | Abbreviation |
| Colorectum (GSE201348) |  | FAP: Familial adenomatous polyposis |
| CRC: Colorectal cancer | ||
| Colorectum (HTA11) |  | AD: Adenomas |
| SER: Sessile serrated lesions | ||
| MSI-H: Microsatellite-high colorectal cancer | ||
| MSS: Microsatellite stable colorectal cancer | ||
| Esophagus | 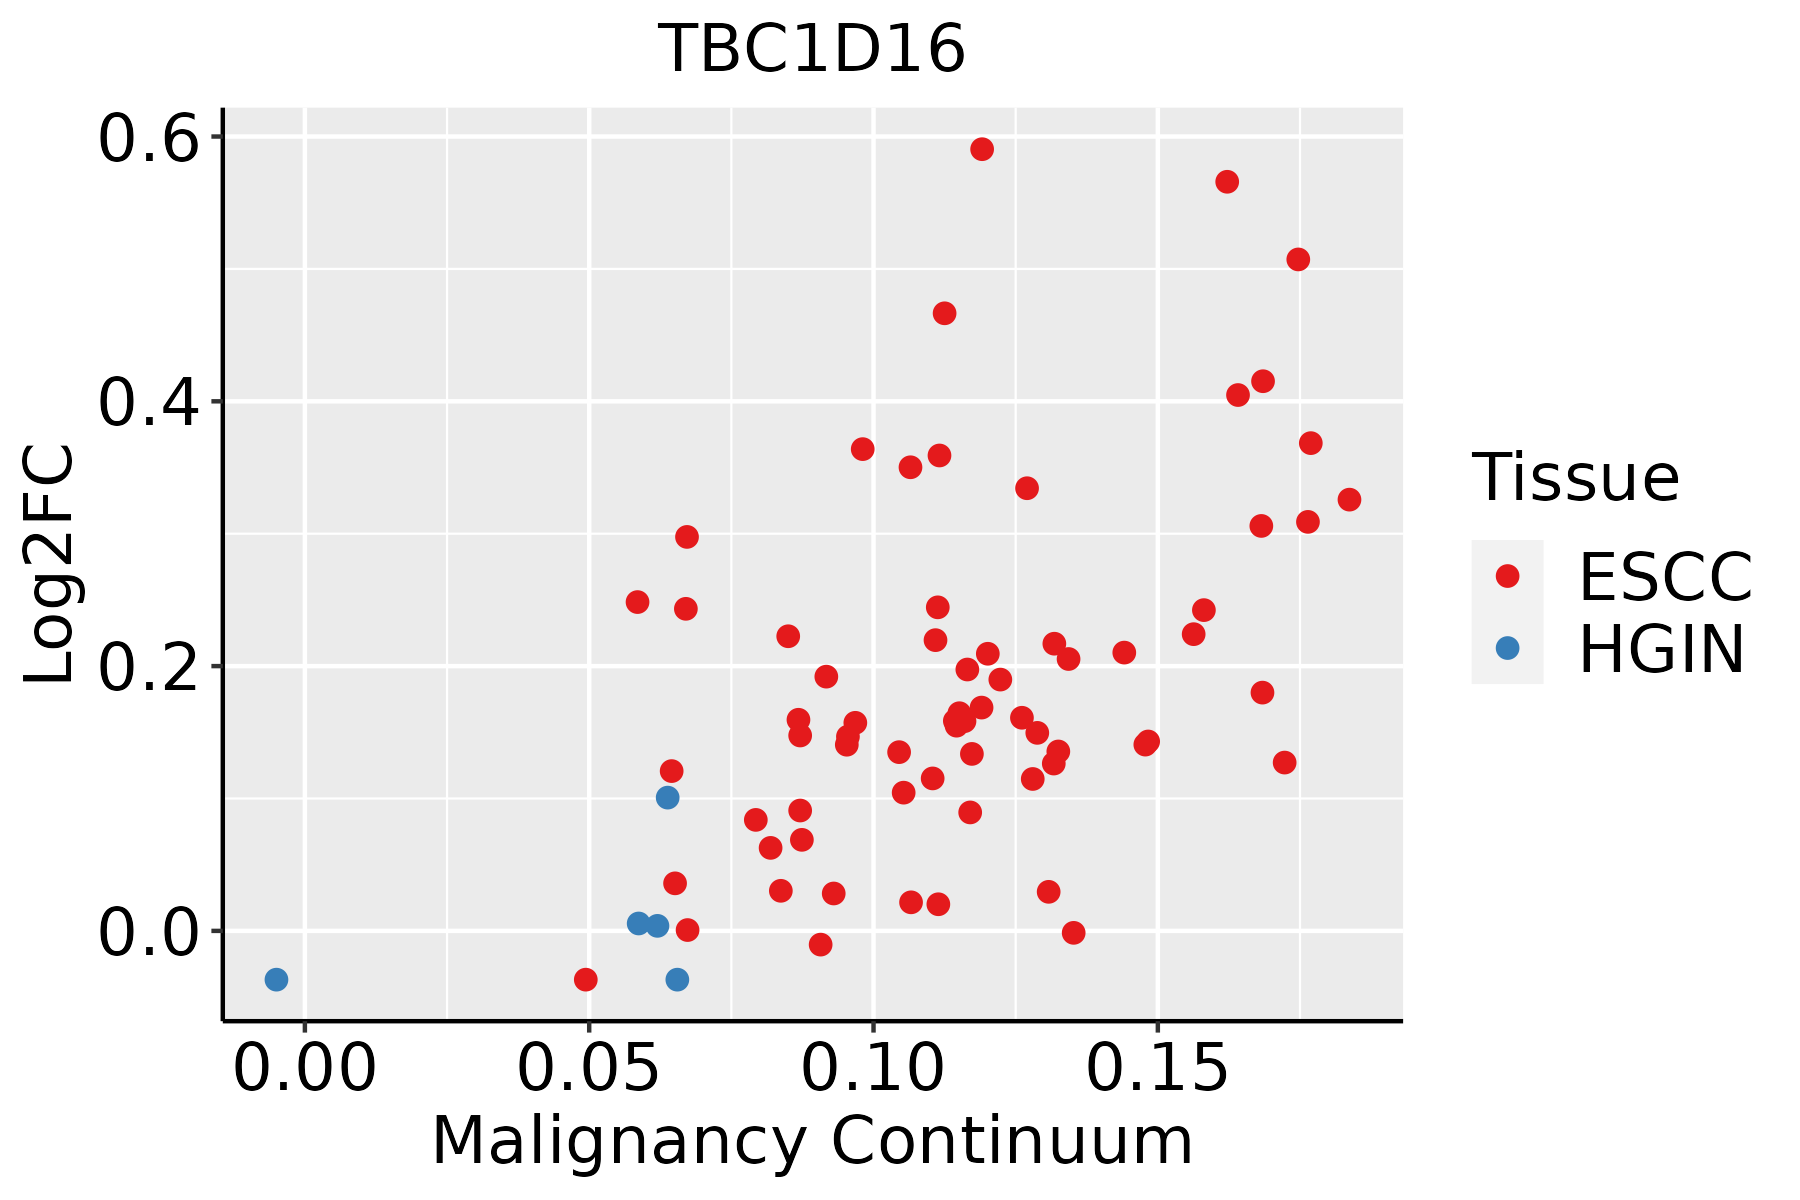 | ESCC: Esophageal squamous cell carcinoma |
| HGIN: High-grade intraepithelial neoplasias | ||
| LGIN: Low-grade intraepithelial neoplasias | ||
| Liver | 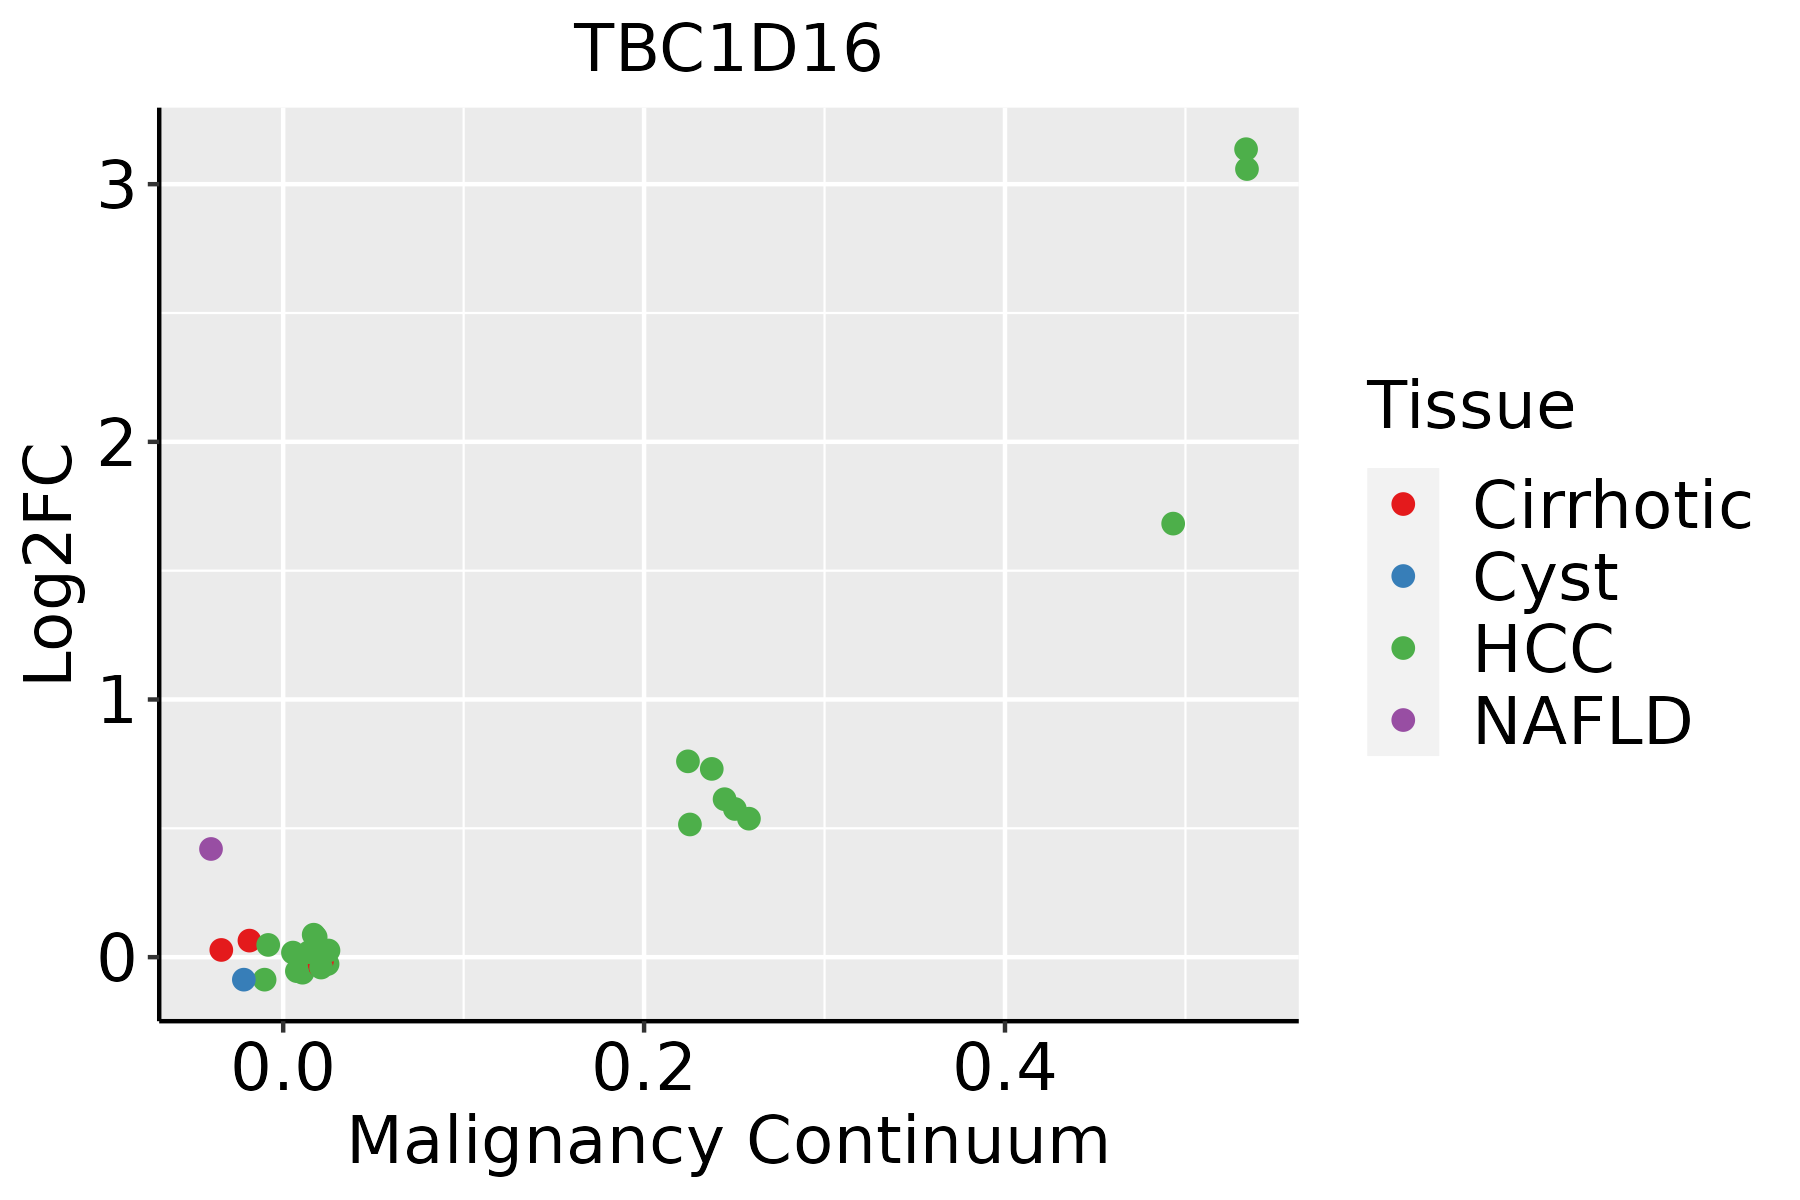 | HCC: Hepatocellular carcinoma |
| NAFLD: Non-alcoholic fatty liver disease |
| ∗log2FC in expression of this searched gene in stem-like cells from each diseased tissue sample relative to stem-like cells in normal samples in each tissue plotted against the malignancy continuum. Samples are colored based on if they are from different disease stage. |
Top |
Malignant transformation related pathway analysis |
| Find out the enriched GO biological processes and KEGG pathways involved in transition from healthy to precancer to cancer |
| Tissue | Disease Stage | Enriched GO biological Processes |
| Colorectum | AD |  |
| Colorectum | SER |  |
| Colorectum | MSS |  |
| Colorectum | MSI-H |  |
| Colorectum | FAP |  |
| ∗Top 15 enriched GO BP terms are showed in the bar plot of each disease state in each tissue. Each row represents a significant GO biological process which is colored according to the -log10(p.adjust). |
| Page: 1 2 3 4 5 6 7 8 9 |
| GO ID | Tissue | Disease Stage | Description | Gene Ratio | Bg Ratio | pvalue | p.adjust | Count |
| GO:0043112 | Colorectum | AD | receptor metabolic process | 62/3918 | 166/18723 | 8.18e-07 | 2.85e-05 | 62 |
| GO:0043087 | Colorectum | AD | regulation of GTPase activity | 110/3918 | 348/18723 | 1.64e-06 | 5.03e-05 | 110 |
| GO:0001881 | Colorectum | AD | receptor recycling | 18/3918 | 33/18723 | 2.23e-05 | 4.40e-04 | 18 |
| GO:0043547 | Colorectum | AD | positive regulation of GTPase activity | 75/3918 | 255/18723 | 7.95e-04 | 7.91e-03 | 75 |
| GO:0001919 | Colorectum | AD | regulation of receptor recycling | 12/3918 | 23/18723 | 9.11e-04 | 8.71e-03 | 12 |
| GO:00431121 | Colorectum | MSS | receptor metabolic process | 57/3467 | 166/18723 | 8.47e-07 | 2.97e-05 | 57 |
| GO:00430872 | Colorectum | MSS | regulation of GTPase activity | 101/3467 | 348/18723 | 1.00e-06 | 3.46e-05 | 101 |
| GO:00018811 | Colorectum | MSS | receptor recycling | 16/3467 | 33/18723 | 8.66e-05 | 1.40e-03 | 16 |
| GO:00435471 | Colorectum | MSS | positive regulation of GTPase activity | 68/3467 | 255/18723 | 7.97e-04 | 8.38e-03 | 68 |
| GO:00019191 | Colorectum | MSS | regulation of receptor recycling | 11/3467 | 23/18723 | 1.29e-03 | 1.23e-02 | 11 |
| GO:00430873 | Colorectum | FAP | regulation of GTPase activity | 85/2622 | 348/18723 | 1.20e-07 | 7.68e-06 | 85 |
| GO:00431122 | Colorectum | FAP | receptor metabolic process | 46/2622 | 166/18723 | 2.70e-06 | 1.02e-04 | 46 |
| GO:00435472 | Colorectum | FAP | positive regulation of GTPase activity | 61/2622 | 255/18723 | 1.39e-05 | 3.73e-04 | 61 |
| GO:00018812 | Colorectum | FAP | receptor recycling | 11/2622 | 33/18723 | 3.95e-03 | 2.75e-02 | 11 |
| GO:0090630 | Colorectum | FAP | activation of GTPase activity | 27/2622 | 115/18723 | 4.23e-03 | 2.90e-02 | 27 |
| GO:004311218 | Esophagus | ESCC | receptor metabolic process | 104/8552 | 166/18723 | 7.44e-06 | 7.37e-05 | 104 |
| GO:00019192 | Esophagus | ESCC | regulation of receptor recycling | 19/8552 | 23/18723 | 3.12e-04 | 1.85e-03 | 19 |
| GO:00018813 | Esophagus | ESCC | receptor recycling | 25/8552 | 33/18723 | 4.30e-04 | 2.43e-03 | 25 |
| GO:004308715 | Esophagus | ESCC | regulation of GTPase activity | 183/8552 | 348/18723 | 5.34e-03 | 2.00e-02 | 183 |
| GO:00430875 | Liver | NAFLD | regulation of GTPase activity | 62/1882 | 348/18723 | 5.65e-06 | 2.03e-04 | 62 |
| Page: 1 2 |
| Pathway ID | Tissue | Disease Stage | Description | Gene Ratio | Bg Ratio | pvalue | p.adjust | qvalue | Count |
| Page: 1 |
Top |
Cell-cell communication analysis |
| Identification of potential cell-cell interactions between two cell types and their ligand-receptor pairs for different disease states |
| Ligand | Receptor | LRpair | Pathway | Tissue | Disease Stage |
| Page: 1 |
Top |
Single-cell gene regulatory network inference analysis |
| Find out the significant the regulons (TFs) and the target genes of each regulon across cell types for different disease states |
| TF | Cell Type | Tissue | Disease Stage | Target Gene | RSS | Regulon Activity |
| ∗The dot plots of a searched regulon are shown for all cell subpopulations in each disease state of each tissue based on the regulon specific score inferred using pySCENIC and by calculating the average expression. |
| Page: 1 |
Top |
Somatic mutation of malignant transformation related genes |
| Annotation of somatic variants for genes involved in malignant transformation |
| Hugo Symbol | Variant Class | Variant Classification | dbSNP RS | HGVSc | HGVSp | HGVSp Short | SWISSPROT | BIOTYPE | SIFT | PolyPhen | Tumor Sample Barcode | Tissue | Histology | Sex | Age | Stage | Therapy Types | Drugs | Outcome |
| TBC1D16 | SNV | Missense_Mutation | novel | c.1170N>C | p.Glu390Asp | p.E390D | Q8TBP0 | protein_coding | deleterious(0.01) | benign(0.408) | TCGA-5L-AAT0-01 | Breast | breast invasive carcinoma | Female | <65 | I/II | Hormone Therapy | tamoxiphen | SD |
| TBC1D16 | SNV | Missense_Mutation | c.1295N>A | p.Gly432Glu | p.G432E | Q8TBP0 | protein_coding | tolerated(0.06) | benign(0.243) | TCGA-AQ-A04J-01 | Breast | breast invasive carcinoma | Female | <65 | I/II | Chemotherapy | cytoxan | SD | |
| TBC1D16 | SNV | Missense_Mutation | c.1739N>A | p.Arg580His | p.R580H | Q8TBP0 | protein_coding | deleterious(0.01) | possibly_damaging(0.875) | TCGA-D8-A1X9-01 | Breast | breast invasive carcinoma | Female | >=65 | I/II | Chemotherapy | adriamycin+cyclophosphamide | SD | |
| TBC1D16 | deletion | Frame_Shift_Del | novel | c.1443delN | p.Trp481CysfsTer33 | p.W481Cfs*33 | Q8TBP0 | protein_coding | TCGA-D8-A27V-01 | Breast | breast invasive carcinoma | Female | <65 | I/II | Hormone Therapy | tamoxiphen | SD | ||
| TBC1D16 | SNV | Missense_Mutation | novel | c.92N>T | p.Ser31Phe | p.S31F | Q8TBP0 | protein_coding | deleterious(0.03) | possibly_damaging(0.58) | TCGA-C5-A905-01 | Cervix | cervical & endocervical cancer | Female | <65 | I/II | Unknown | Unknown | SD |
| TBC1D16 | SNV | Missense_Mutation | novel | c.851N>T | p.Asp284Val | p.D284V | Q8TBP0 | protein_coding | tolerated(0.05) | benign(0.135) | TCGA-DS-A1OB-01 | Cervix | cervical & endocervical cancer | Female | <65 | I/II | Chemotherapy | carboplatin | PD |
| TBC1D16 | SNV | Missense_Mutation | c.1682C>G | p.Thr561Arg | p.T561R | Q8TBP0 | protein_coding | deleterious(0) | probably_damaging(0.995) | TCGA-EX-A1H6-01 | Cervix | cervical & endocervical cancer | Female | <65 | I/II | Unknown | Unknown | SD | |
| TBC1D16 | SNV | Missense_Mutation | c.1708G>C | p.Glu570Gln | p.E570Q | Q8TBP0 | protein_coding | tolerated(0.14) | benign(0.337) | TCGA-EX-A69L-01 | Cervix | cervical & endocervical cancer | Female | <65 | I/II | Unknown | Unknown | SD | |
| TBC1D16 | SNV | Missense_Mutation | rs776201342 | c.589N>A | p.Glu197Lys | p.E197K | Q8TBP0 | protein_coding | tolerated(0.32) | benign(0.121) | TCGA-MY-A5BE-01 | Cervix | cervical & endocervical cancer | Female | <65 | I/II | Unknown | Unknown | SD |
| TBC1D16 | deletion | Frame_Shift_Del | rs769589424 | c.1988_1994delNNNNNNN | p.Thr663ArgfsTer13 | p.T663Rfs*13 | Q8TBP0 | protein_coding | TCGA-C5-A3HL-01 | Cervix | cervical & endocervical cancer | Female | >=65 | I/II | Unknown | Unknown | SD |
| Page: 1 2 3 4 5 6 7 8 |
Top |
Related drugs of malignant transformation related genes |
| Identification of chemicals and drugs interact with genes involved in malignant transfromation |
| (DGIdb 4.0) |
| Entrez ID | Symbol | Category | Interaction Types | Drug Claim Name | Drug Name | PMIDs |
| Page: 1 |

Copyright 2023-Present -The University of Texas Health Science Center at Houston |