
|
|||||
|
 | |
| |
| |
| |
| |
| |
|
Gene: TBC1D15 |
Gene summary for TBC1D15 |
| Gene information | Species | Human | Gene symbol | TBC1D15 | Gene ID | 64786 |
| Gene name | TBC1 domain family member 15 | |
| Gene Alias | RAB7-GAP | |
| Cytomap | 12q21.1 | |
| Gene Type | protein-coding | GO ID | GO:0006810 | UniProtAcc | Q8TC07 |
Top |
Malignant transformation analysis |
| Identification of the aberrant gene expression in precancerous and cancerous lesions by comparing the gene expression of stem-like cells in diseased tissues with normal stem cells |
| Entrez ID | Symbol | Replicates | Species | Organ | Tissue | Adj P-value | Log2FC | Malignancy |
| 64786 | TBC1D15 | LZE2T | Human | Esophagus | ESCC | 4.40e-02 | 2.14e-01 | 0.082 |
| 64786 | TBC1D15 | LZE7T | Human | Esophagus | ESCC | 1.07e-03 | 1.34e-01 | 0.0667 |
| 64786 | TBC1D15 | LZE8T | Human | Esophagus | ESCC | 2.38e-03 | -7.94e-02 | 0.067 |
| 64786 | TBC1D15 | LZE20T | Human | Esophagus | ESCC | 8.60e-03 | -9.29e-02 | 0.0662 |
| 64786 | TBC1D15 | LZE24T | Human | Esophagus | ESCC | 5.41e-08 | 1.04e-01 | 0.0596 |
| 64786 | TBC1D15 | LZE6T | Human | Esophagus | ESCC | 1.86e-02 | -6.16e-02 | 0.0845 |
| 64786 | TBC1D15 | P2T-E | Human | Esophagus | ESCC | 2.80e-21 | 3.17e-01 | 0.1177 |
| 64786 | TBC1D15 | P4T-E | Human | Esophagus | ESCC | 5.30e-21 | 1.74e-01 | 0.1323 |
| 64786 | TBC1D15 | P5T-E | Human | Esophagus | ESCC | 8.88e-04 | 3.94e-02 | 0.1327 |
| 64786 | TBC1D15 | P8T-E | Human | Esophagus | ESCC | 1.87e-20 | 2.81e-01 | 0.0889 |
| 64786 | TBC1D15 | P9T-E | Human | Esophagus | ESCC | 6.16e-08 | -7.90e-02 | 0.1131 |
| 64786 | TBC1D15 | P10T-E | Human | Esophagus | ESCC | 5.81e-22 | 1.16e-01 | 0.116 |
| 64786 | TBC1D15 | P11T-E | Human | Esophagus | ESCC | 1.94e-10 | 1.62e-01 | 0.1426 |
| 64786 | TBC1D15 | P12T-E | Human | Esophagus | ESCC | 5.94e-12 | 1.46e-01 | 0.1122 |
| 64786 | TBC1D15 | P15T-E | Human | Esophagus | ESCC | 3.86e-11 | 9.92e-02 | 0.1149 |
| 64786 | TBC1D15 | P16T-E | Human | Esophagus | ESCC | 7.41e-24 | 1.00e-01 | 0.1153 |
| 64786 | TBC1D15 | P17T-E | Human | Esophagus | ESCC | 3.93e-08 | 1.14e-01 | 0.1278 |
| 64786 | TBC1D15 | P19T-E | Human | Esophagus | ESCC | 1.41e-04 | 2.05e-01 | 0.1662 |
| 64786 | TBC1D15 | P20T-E | Human | Esophagus | ESCC | 8.17e-12 | 3.16e-02 | 0.1124 |
| 64786 | TBC1D15 | P21T-E | Human | Esophagus | ESCC | 9.31e-20 | 1.18e-01 | 0.1617 |
| Page: 1 2 3 4 5 6 |
| Tissue | Expression Dynamics | Abbreviation |
| Esophagus |  | ESCC: Esophageal squamous cell carcinoma |
| HGIN: High-grade intraepithelial neoplasias | ||
| LGIN: Low-grade intraepithelial neoplasias | ||
| Liver | 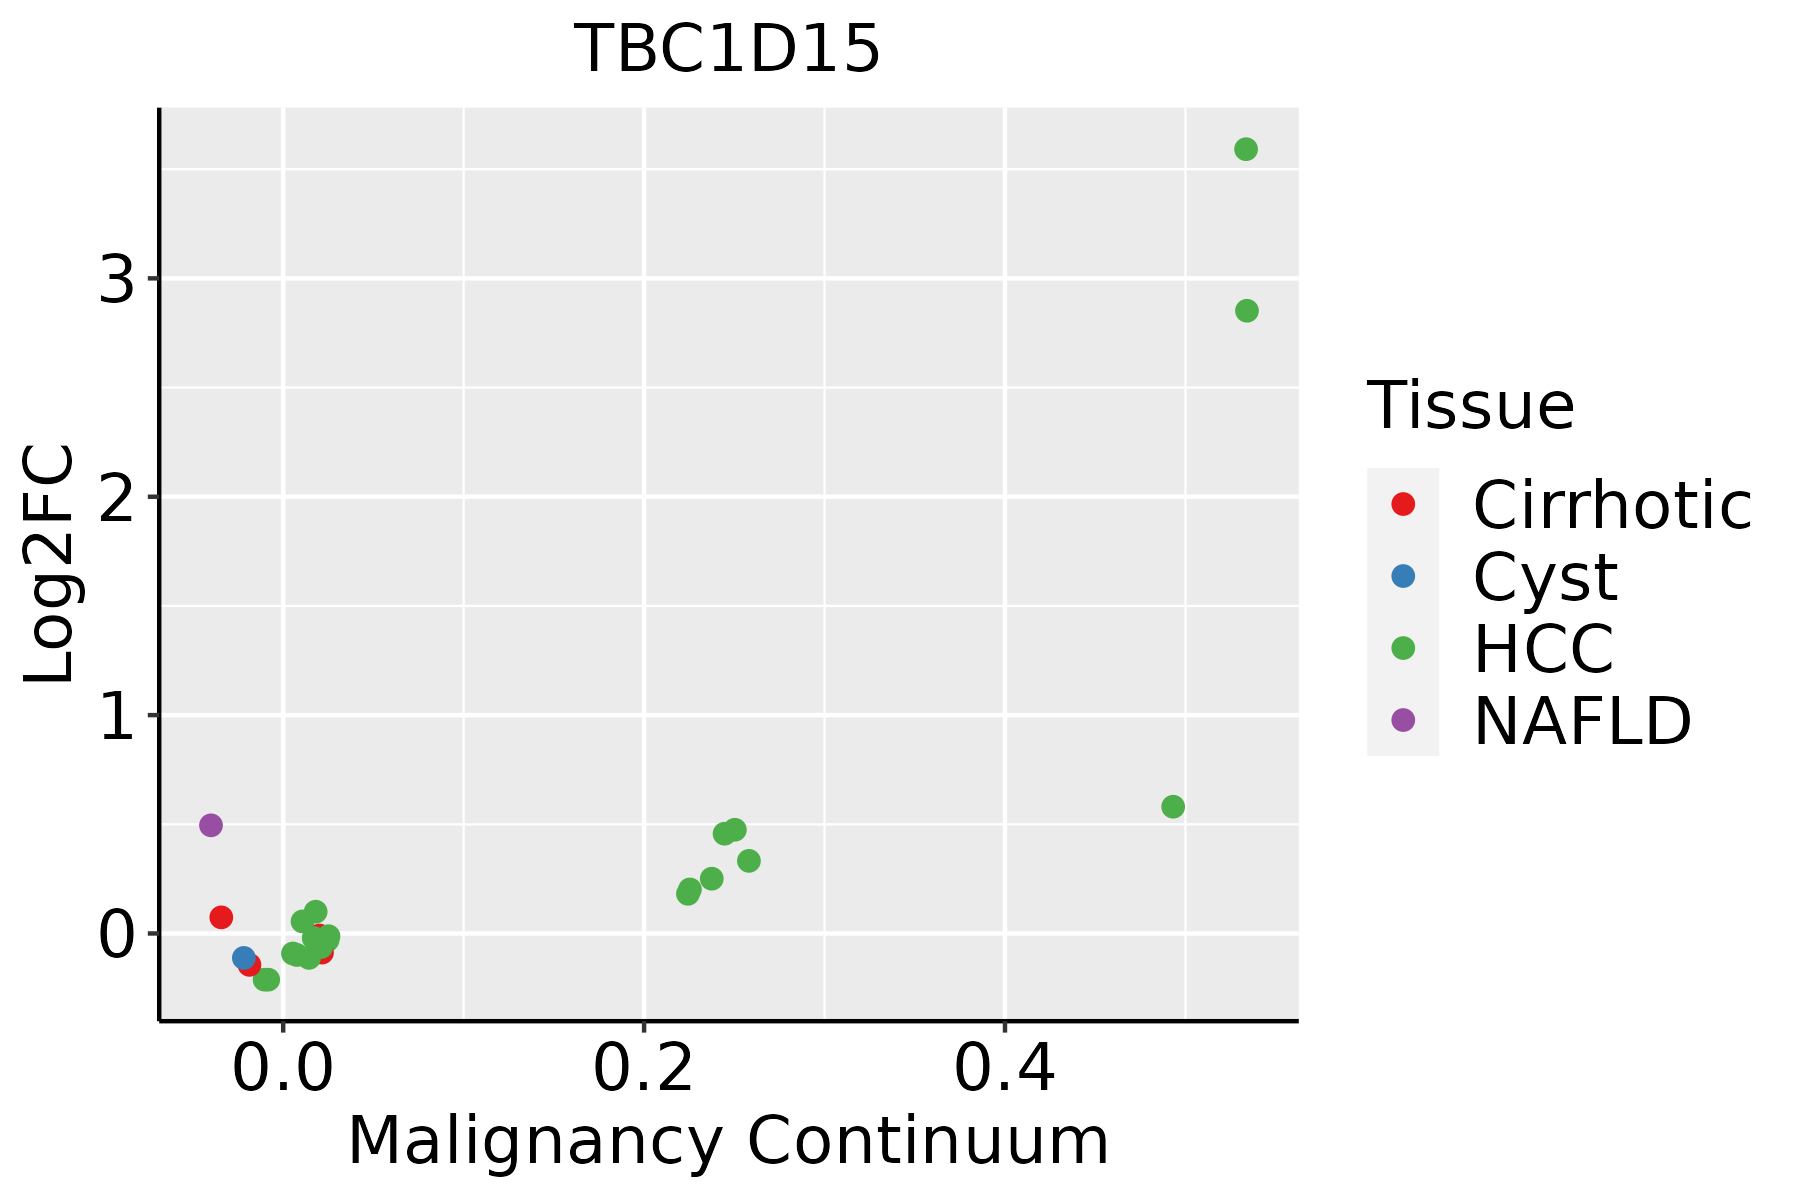 | HCC: Hepatocellular carcinoma |
| NAFLD: Non-alcoholic fatty liver disease | ||
| Oral Cavity | 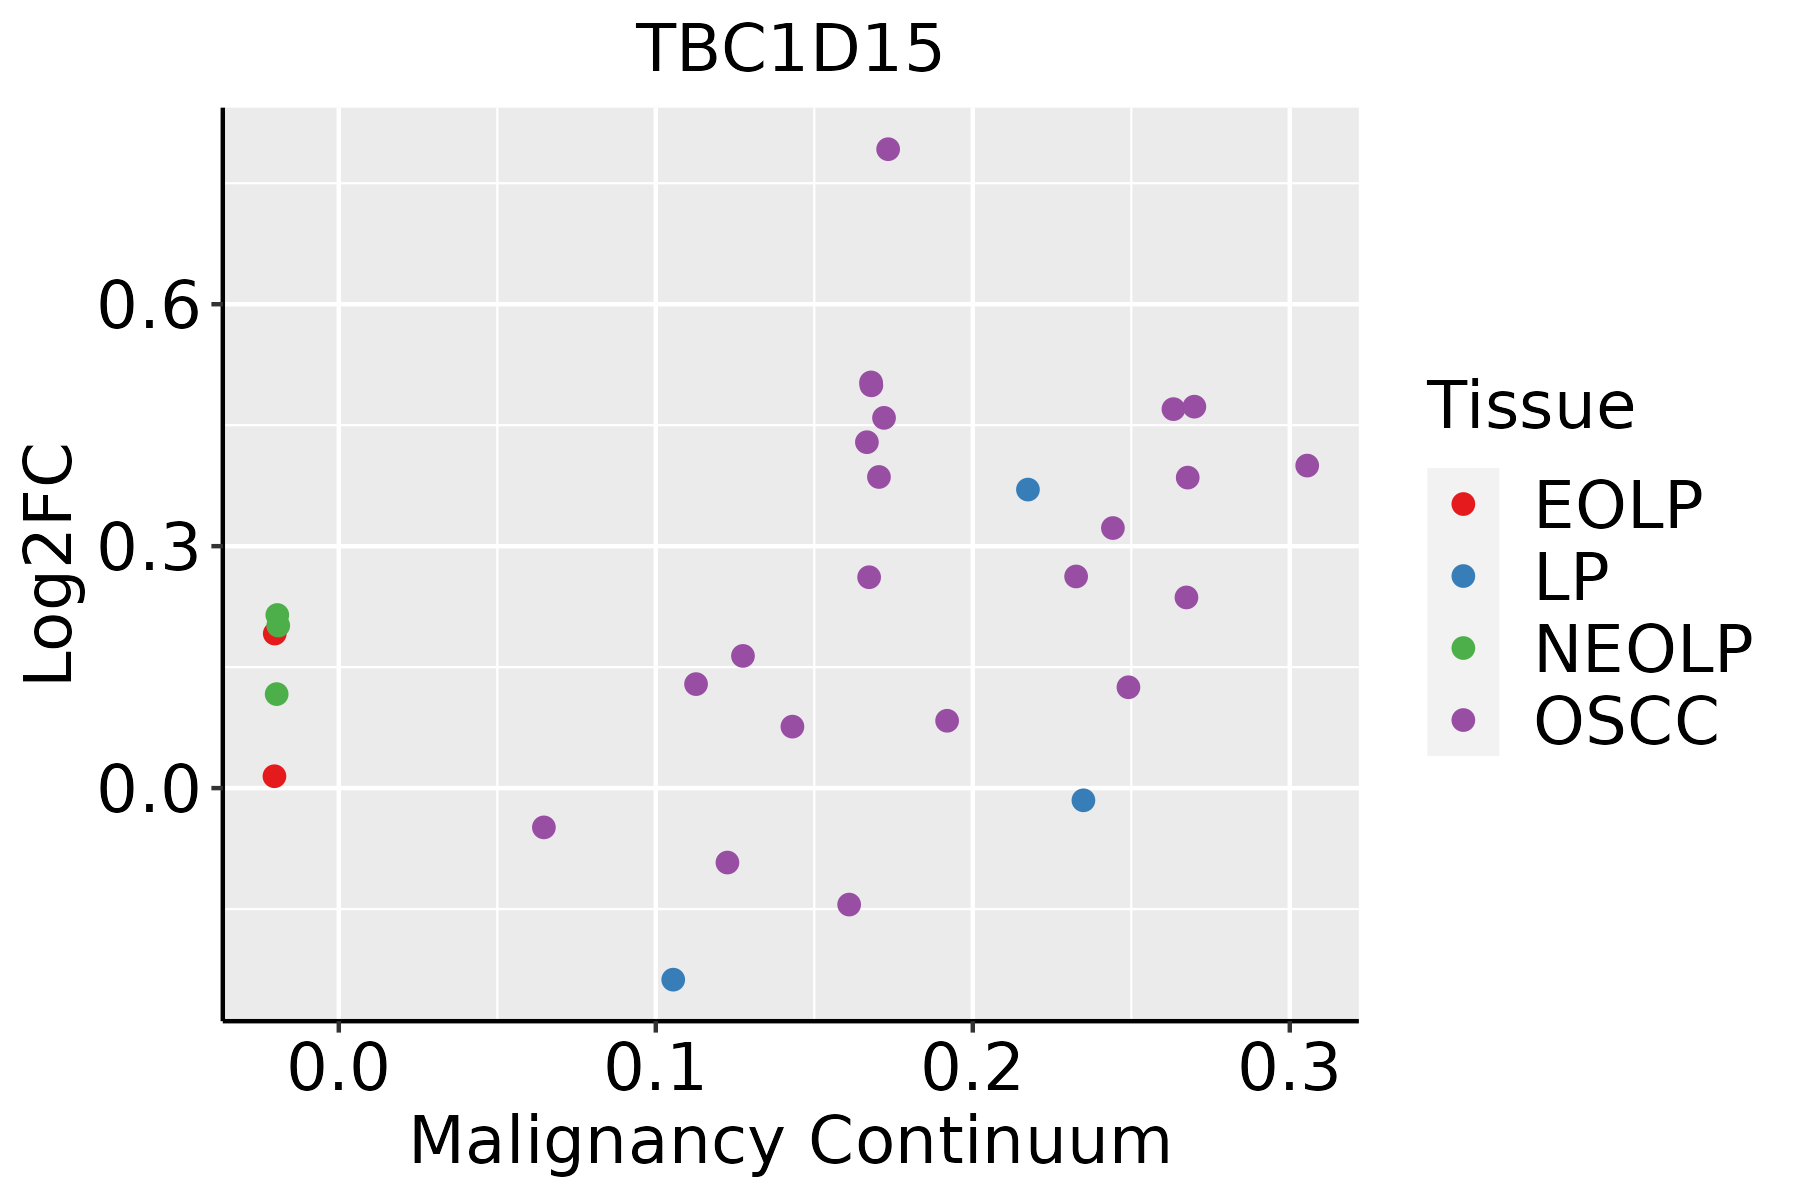 | EOLP: Erosive Oral lichen planus |
| LP: leukoplakia | ||
| NEOLP: Non-erosive oral lichen planus | ||
| OSCC: Oral squamous cell carcinoma | ||
| Thyroid | 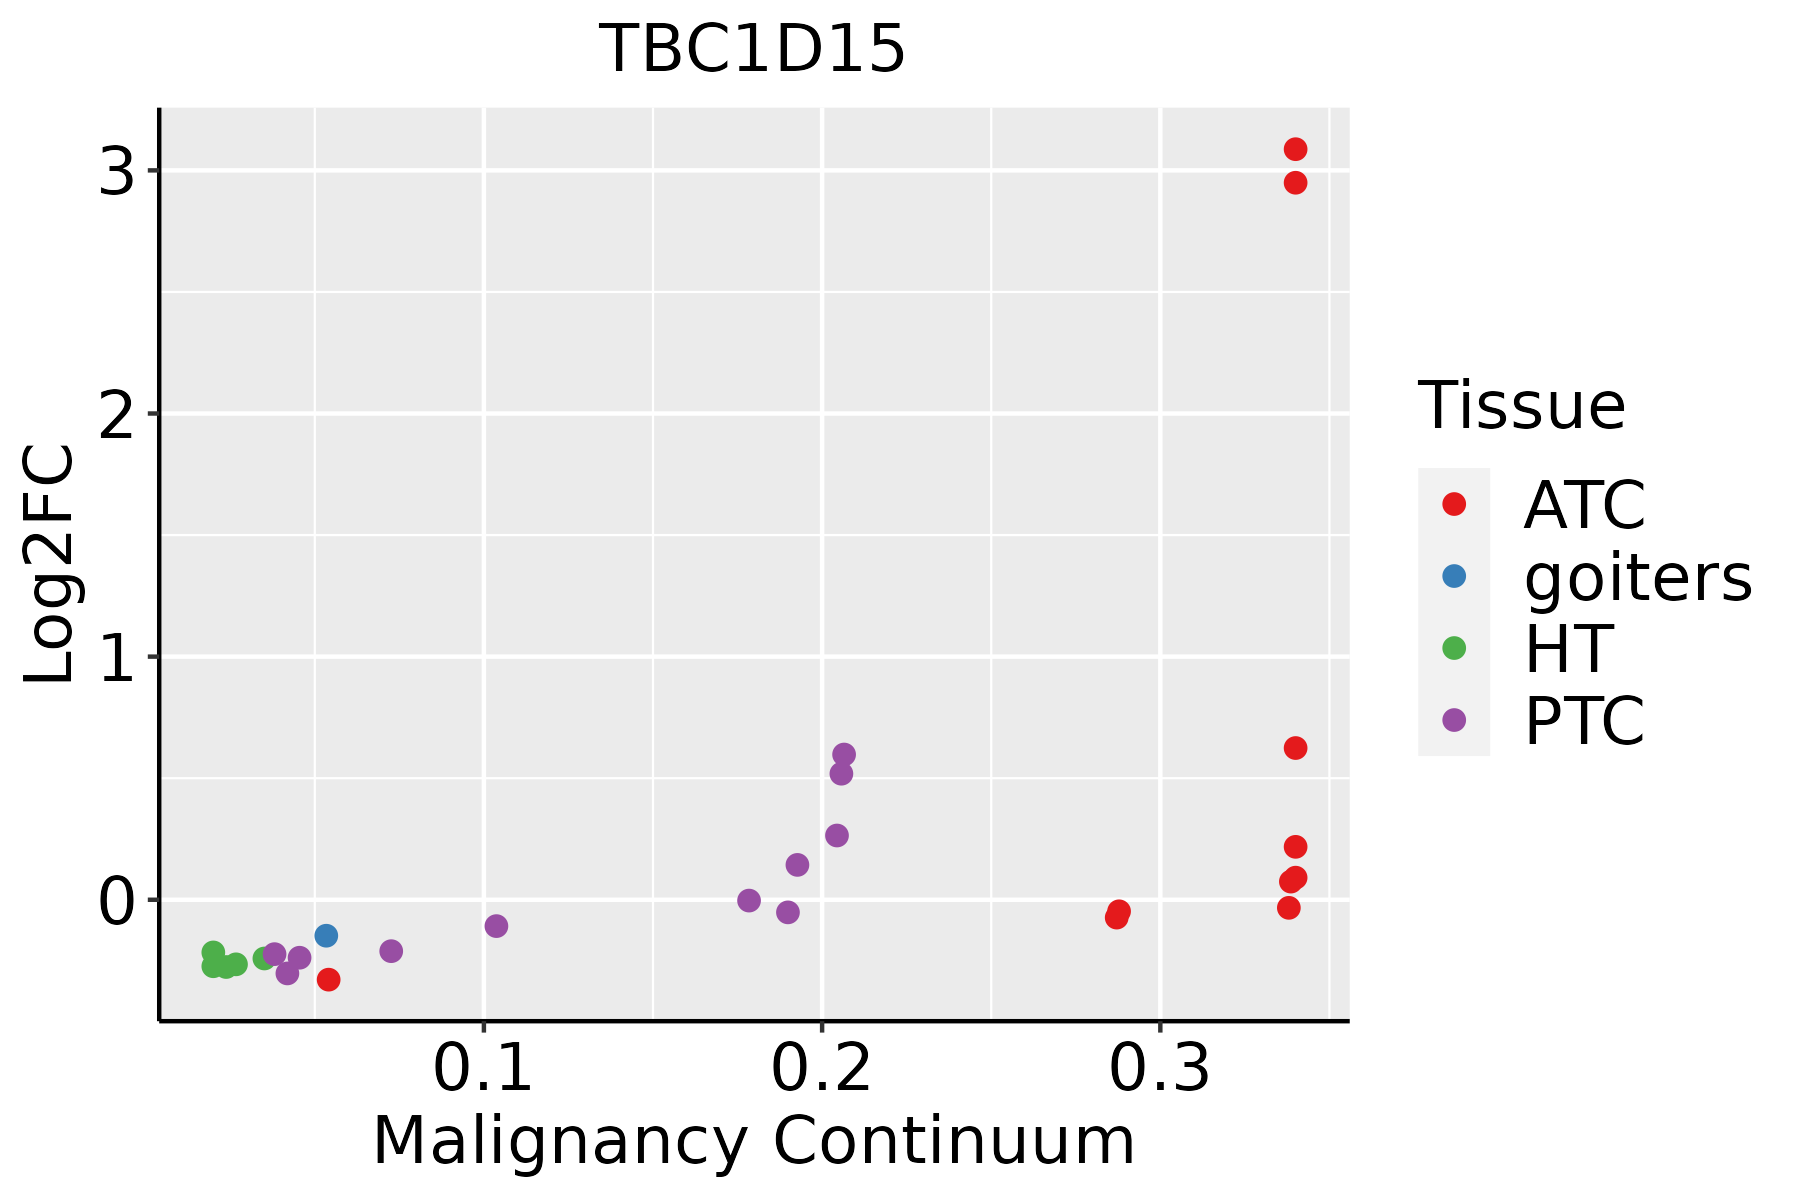 | ATC: Anaplastic thyroid cancer |
| HT: Hashimoto's thyroiditis | ||
| PTC: Papillary thyroid cancer |
| ∗log2FC in expression of this searched gene in stem-like cells from each diseased tissue sample relative to stem-like cells in normal samples in each tissue plotted against the malignancy continuum. Samples are colored based on if they are from different disease stage. |
Top |
Malignant transformation related pathway analysis |
| Find out the enriched GO biological processes and KEGG pathways involved in transition from healthy to precancer to cancer |
| Tissue | Disease Stage | Enriched GO biological Processes |
| Colorectum | AD |  |
| Colorectum | SER |  |
| Colorectum | MSS |  |
| Colorectum | MSI-H |  |
| Colorectum | FAP |  |
| ∗Top 15 enriched GO BP terms are showed in the bar plot of each disease state in each tissue. Each row represents a significant GO biological process which is colored according to the -log10(p.adjust). |
| Page: 1 2 3 4 5 6 7 8 9 |
| GO ID | Tissue | Disease Stage | Description | Gene Ratio | Bg Ratio | pvalue | p.adjust | Count |
| GO:004308715 | Esophagus | ESCC | regulation of GTPase activity | 183/8552 | 348/18723 | 5.34e-03 | 2.00e-02 | 183 |
| GO:00430875 | Liver | NAFLD | regulation of GTPase activity | 62/1882 | 348/18723 | 5.65e-06 | 2.03e-04 | 62 |
| GO:00435474 | Liver | NAFLD | positive regulation of GTPase activity | 45/1882 | 255/18723 | 1.30e-04 | 2.47e-03 | 45 |
| GO:00906301 | Liver | NAFLD | activation of GTPase activity | 22/1882 | 115/18723 | 2.28e-03 | 2.19e-02 | 22 |
| GO:004308710 | Oral cavity | OSCC | regulation of GTPase activity | 165/7305 | 348/18723 | 7.94e-04 | 4.27e-03 | 165 |
| GO:004308722 | Oral cavity | NEOLP | regulation of GTPase activity | 54/2005 | 348/18723 | 3.36e-03 | 2.00e-02 | 54 |
| GO:004308718 | Thyroid | PTC | regulation of GTPase activity | 148/5968 | 348/18723 | 1.63e-05 | 1.71e-04 | 148 |
| GO:004354714 | Thyroid | PTC | positive regulation of GTPase activity | 103/5968 | 255/18723 | 2.38e-03 | 1.25e-02 | 103 |
| GO:004308719 | Thyroid | ATC | regulation of GTPase activity | 153/6293 | 348/18723 | 3.24e-05 | 2.68e-04 | 153 |
| GO:004354715 | Thyroid | ATC | positive regulation of GTPase activity | 106/6293 | 255/18723 | 4.58e-03 | 1.89e-02 | 106 |
| Page: 1 |
| Pathway ID | Tissue | Disease Stage | Description | Gene Ratio | Bg Ratio | pvalue | p.adjust | qvalue | Count |
| hsa04137210 | Esophagus | ESCC | Mitophagy - animal | 54/4205 | 72/8465 | 9.33e-06 | 4.96e-05 | 2.54e-05 | 54 |
| hsa0413738 | Esophagus | ESCC | Mitophagy - animal | 54/4205 | 72/8465 | 9.33e-06 | 4.96e-05 | 2.54e-05 | 54 |
| hsa0413712 | Liver | NAFLD | Mitophagy - animal | 18/1043 | 72/8465 | 2.27e-03 | 2.46e-02 | 1.99e-02 | 18 |
| hsa0413713 | Liver | NAFLD | Mitophagy - animal | 18/1043 | 72/8465 | 2.27e-03 | 2.46e-02 | 1.99e-02 | 18 |
| hsa0413721 | Liver | Cirrhotic | Mitophagy - animal | 39/2530 | 72/8465 | 1.38e-05 | 1.24e-04 | 7.64e-05 | 39 |
| hsa0413731 | Liver | Cirrhotic | Mitophagy - animal | 39/2530 | 72/8465 | 1.38e-05 | 1.24e-04 | 7.64e-05 | 39 |
| hsa0413741 | Liver | HCC | Mitophagy - animal | 53/4020 | 72/8465 | 5.49e-06 | 4.59e-05 | 2.56e-05 | 53 |
| hsa0413751 | Liver | HCC | Mitophagy - animal | 53/4020 | 72/8465 | 5.49e-06 | 4.59e-05 | 2.56e-05 | 53 |
| hsa0413728 | Oral cavity | OSCC | Mitophagy - animal | 58/3704 | 72/8465 | 1.48e-10 | 2.07e-09 | 1.05e-09 | 58 |
| hsa04137112 | Oral cavity | OSCC | Mitophagy - animal | 58/3704 | 72/8465 | 1.48e-10 | 2.07e-09 | 1.05e-09 | 58 |
| Page: 1 |
Top |
Cell-cell communication analysis |
| Identification of potential cell-cell interactions between two cell types and their ligand-receptor pairs for different disease states |
| Ligand | Receptor | LRpair | Pathway | Tissue | Disease Stage |
| Page: 1 |
Top |
Single-cell gene regulatory network inference analysis |
| Find out the significant the regulons (TFs) and the target genes of each regulon across cell types for different disease states |
| TF | Cell Type | Tissue | Disease Stage | Target Gene | RSS | Regulon Activity |
| ∗The dot plots of a searched regulon are shown for all cell subpopulations in each disease state of each tissue based on the regulon specific score inferred using pySCENIC and by calculating the average expression. |
| Page: 1 |
Top |
Somatic mutation of malignant transformation related genes |
| Annotation of somatic variants for genes involved in malignant transformation |
| Hugo Symbol | Variant Class | Variant Classification | dbSNP RS | HGVSc | HGVSp | HGVSp Short | SWISSPROT | BIOTYPE | SIFT | PolyPhen | Tumor Sample Barcode | Tissue | Histology | Sex | Age | Stage | Therapy Types | Drugs | Outcome |
| TBC1D15 | SNV | Missense_Mutation | c.1387N>G | p.Leu463Val | p.L463V | Q8TC07 | protein_coding | tolerated(0.37) | benign(0.001) | TCGA-AR-A0TX-01 | Breast | breast invasive carcinoma | Female | <65 | I/II | Unknown | Unknown | SD | |
| TBC1D15 | SNV | Missense_Mutation | c.749T>A | p.Phe250Tyr | p.F250Y | Q8TC07 | protein_coding | deleterious(0.01) | benign(0.007) | TCGA-C8-A274-01 | Breast | breast invasive carcinoma | Female | <65 | I/II | Hormone Therapy | tamoxiphen | SD | |
| TBC1D15 | SNV | Missense_Mutation | c.232C>G | p.Gln78Glu | p.Q78E | Q8TC07 | protein_coding | tolerated(0.16) | benign(0.022) | TCGA-D8-A1JA-01 | Breast | breast invasive carcinoma | Female | <65 | III/IV | Chemotherapy | adriamycin | PD | |
| TBC1D15 | SNV | Missense_Mutation | c.1270N>C | p.Phe424Leu | p.F424L | Q8TC07 | protein_coding | deleterious(0.02) | probably_damaging(0.96) | TCGA-D8-A1XK-01 | Breast | breast invasive carcinoma | Female | <65 | I/II | Chemotherapy | doxorubicine+cyclophosphamide | SD | |
| TBC1D15 | SNV | Missense_Mutation | novel | c.1272N>G | p.Phe424Leu | p.F424L | Q8TC07 | protein_coding | deleterious(0.02) | probably_damaging(0.96) | TCGA-UL-AAZ6-01 | Breast | breast invasive carcinoma | Female | >=65 | I/II | Chemotherapy | herceptin | SD |
| TBC1D15 | deletion | Frame_Shift_Del | c.1319delT | p.Leu440Ter | p.L440* | Q8TC07 | protein_coding | TCGA-EW-A1IZ-01 | Breast | breast invasive carcinoma | Female | <65 | III/IV | Chemotherapy | taxotere | SD | |||
| TBC1D15 | SNV | Missense_Mutation | c.182N>G | p.Ser61Cys | p.S61C | Q8TC07 | protein_coding | deleterious(0.01) | probably_damaging(0.998) | TCGA-C5-A1BQ-01 | Cervix | cervical & endocervical cancer | Female | >=65 | III/IV | Chemotherapy | cisplatin | CR | |
| TBC1D15 | SNV | Missense_Mutation | c.439N>C | p.Trp147Arg | p.W147R | Q8TC07 | protein_coding | tolerated(0.25) | probably_damaging(0.999) | TCGA-AA-3966-01 | Colorectum | colon adenocarcinoma | Female | >=65 | I/II | Unknown | Unknown | SD | |
| TBC1D15 | SNV | Missense_Mutation | c.677N>T | p.Arg226Ile | p.R226I | Q8TC07 | protein_coding | tolerated_low_confidence(0.24) | possibly_damaging(0.466) | TCGA-AA-3977-01 | Colorectum | colon adenocarcinoma | Male | >=65 | I/II | Unknown | Unknown | SD | |
| TBC1D15 | SNV | Missense_Mutation | c.1199N>T | p.Arg400Ile | p.R400I | Q8TC07 | protein_coding | deleterious(0) | possibly_damaging(0.603) | TCGA-AA-3977-01 | Colorectum | colon adenocarcinoma | Male | >=65 | I/II | Unknown | Unknown | SD |
| Page: 1 2 3 4 5 6 7 8 |
Top |
Related drugs of malignant transformation related genes |
| Identification of chemicals and drugs interact with genes involved in malignant transfromation |
| (DGIdb 4.0) |
| Entrez ID | Symbol | Category | Interaction Types | Drug Claim Name | Drug Name | PMIDs |
| Page: 1 |

Copyright 2023-Present -The University of Texas Health Science Center at Houston |