| Tissue | Expression Dynamics | Abbreviation |
| Colorectum (GSE201348) |  | FAP: Familial adenomatous polyposis |
| CRC: Colorectal cancer |
| Colorectum (HTA11) | 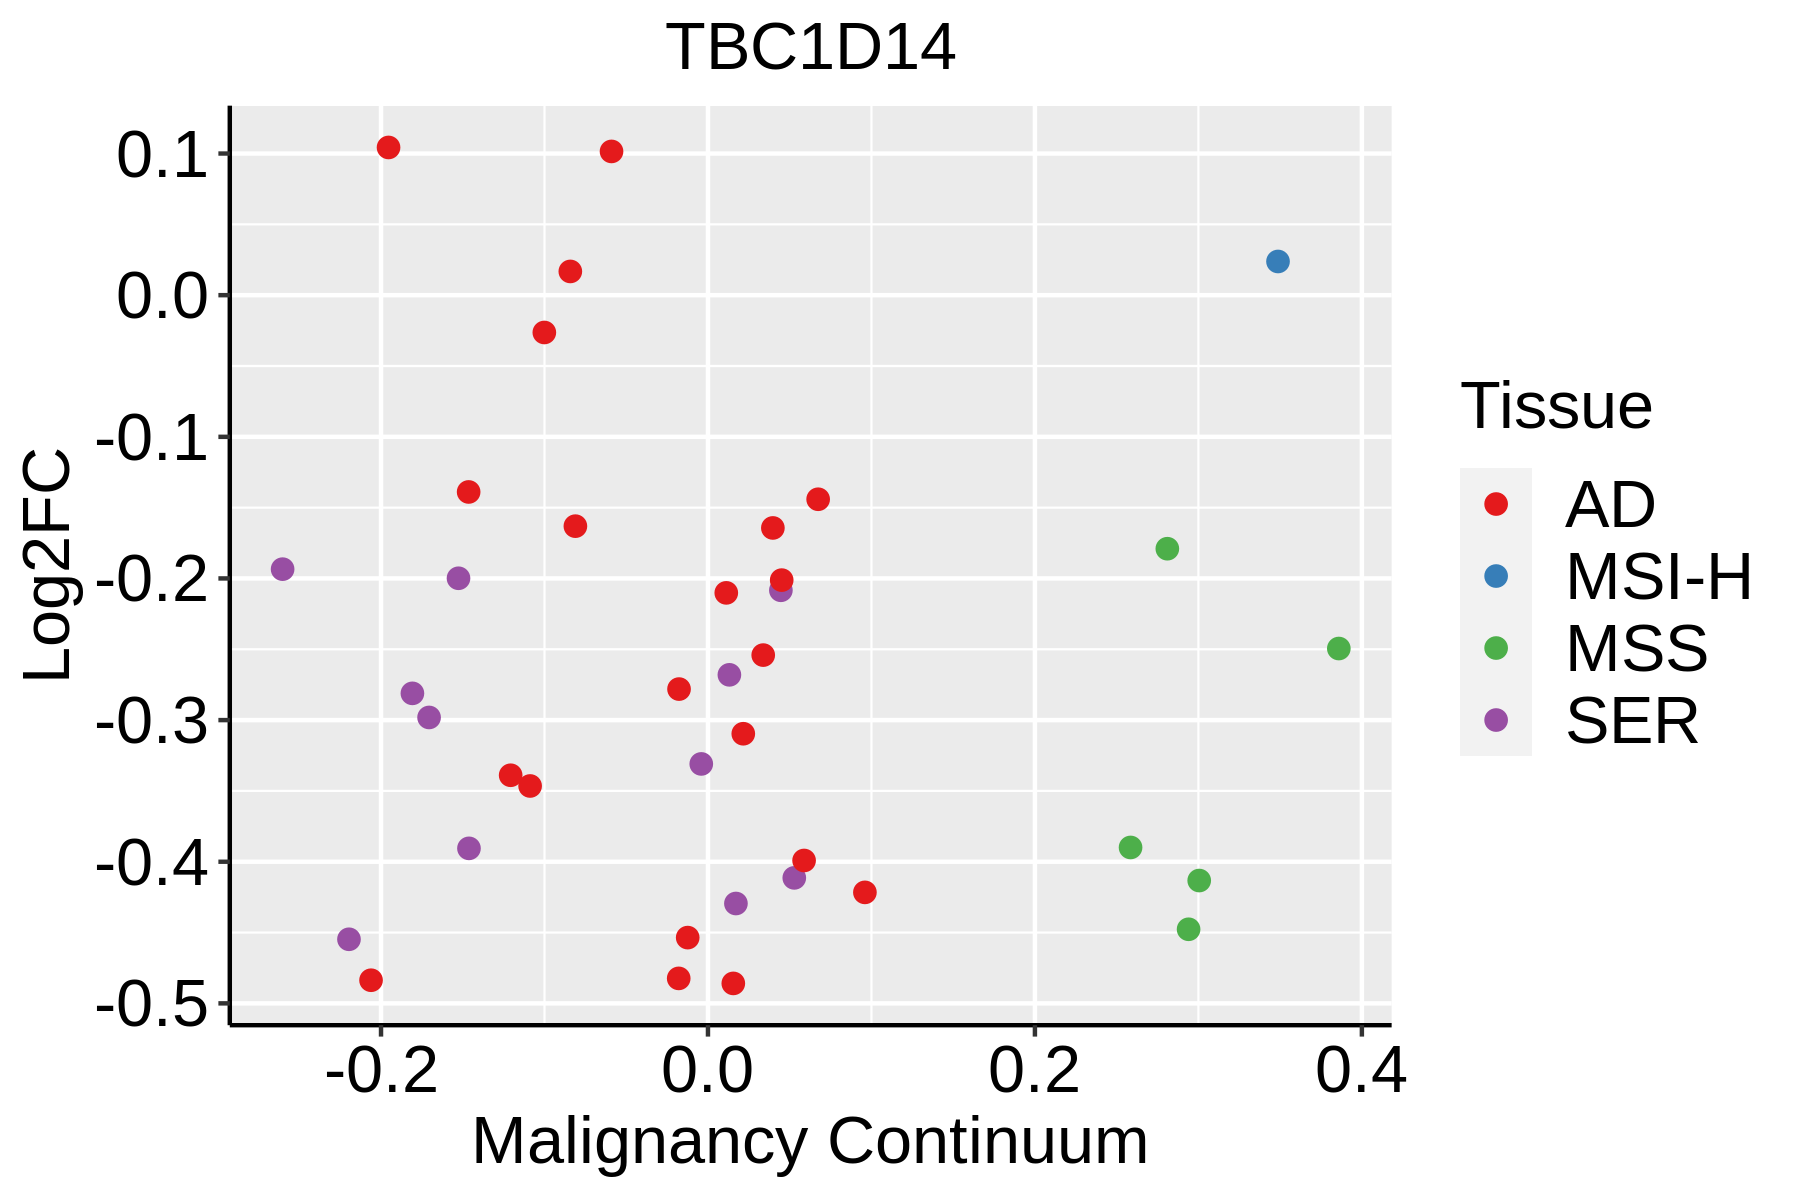 | AD: Adenomas |
| SER: Sessile serrated lesions |
| MSI-H: Microsatellite-high colorectal cancer |
| MSS: Microsatellite stable colorectal cancer |
| Esophagus | 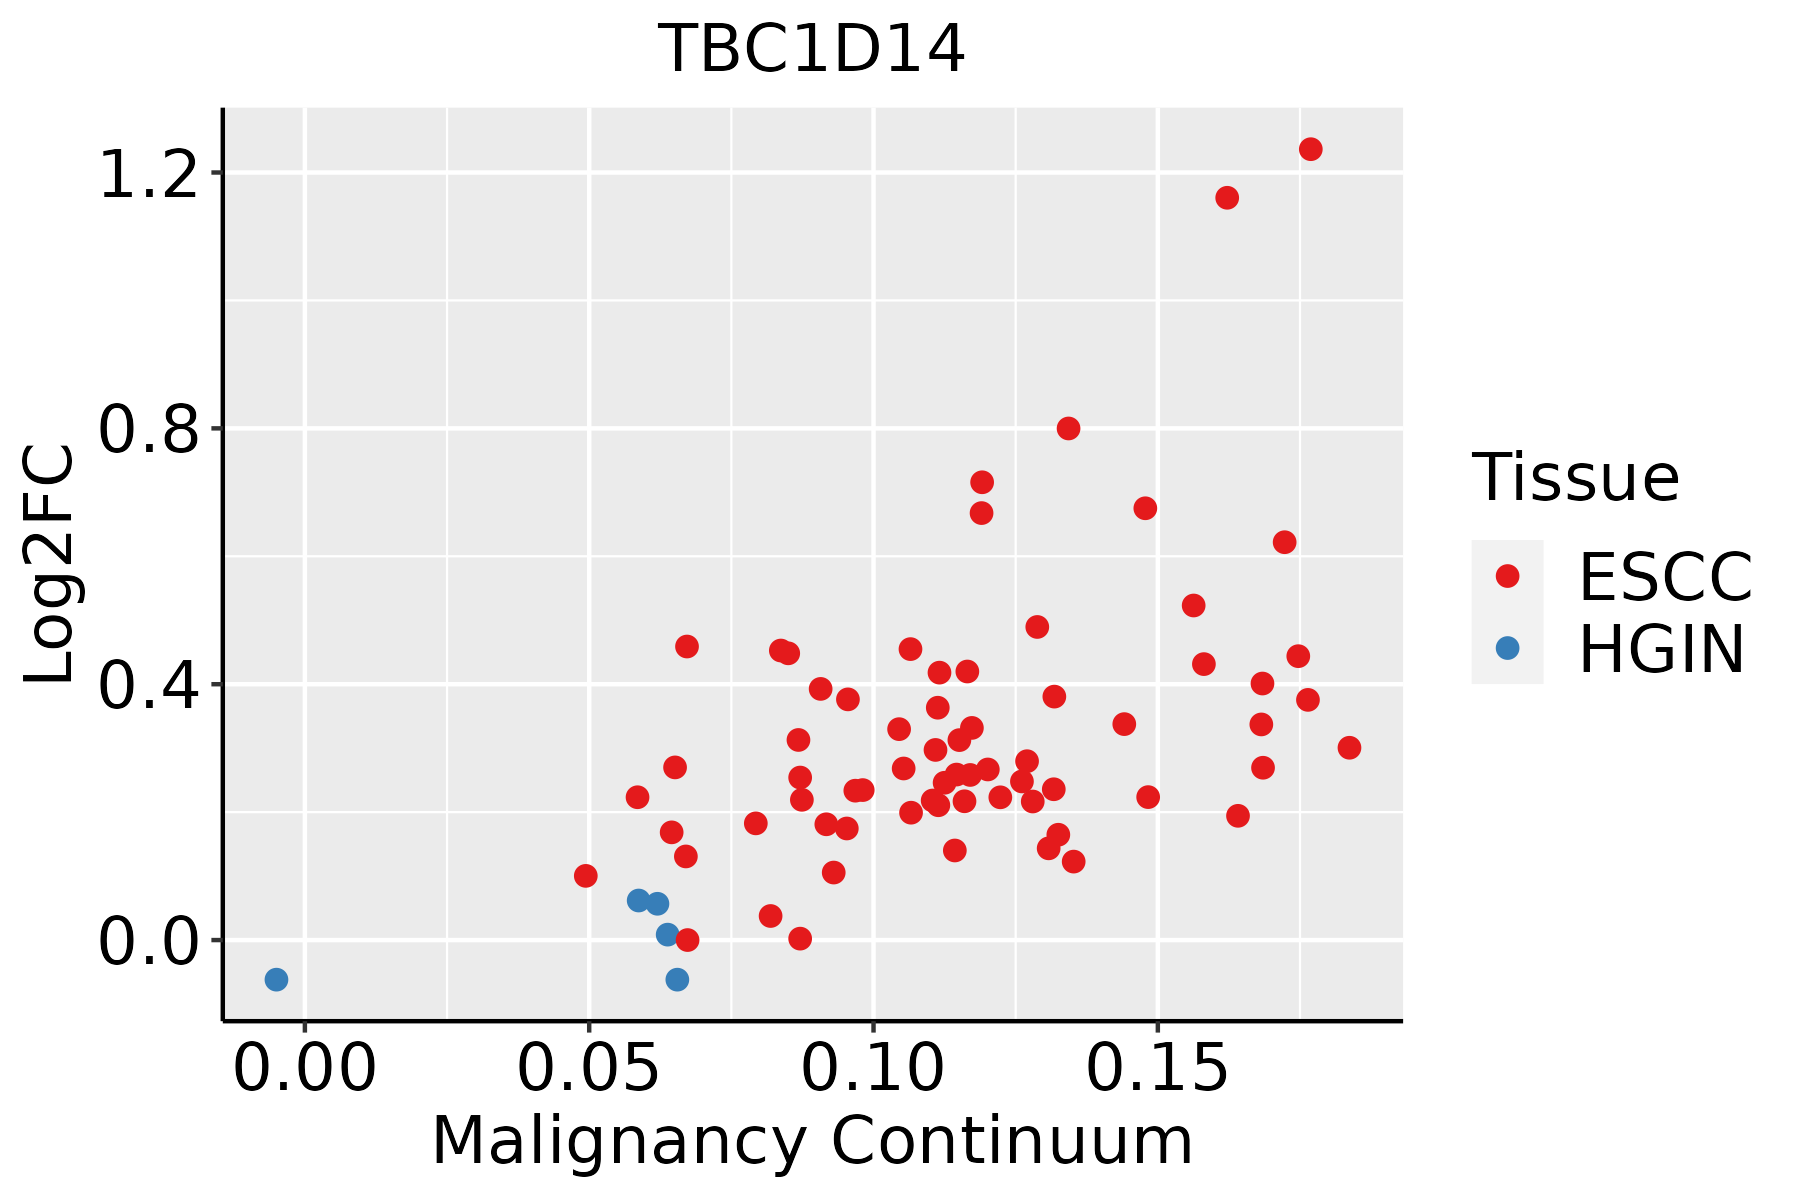 | ESCC: Esophageal squamous cell carcinoma |
| HGIN: High-grade intraepithelial neoplasias |
| LGIN: Low-grade intraepithelial neoplasias |
| Liver |  | HCC: Hepatocellular carcinoma |
| NAFLD: Non-alcoholic fatty liver disease |
| Oral Cavity | 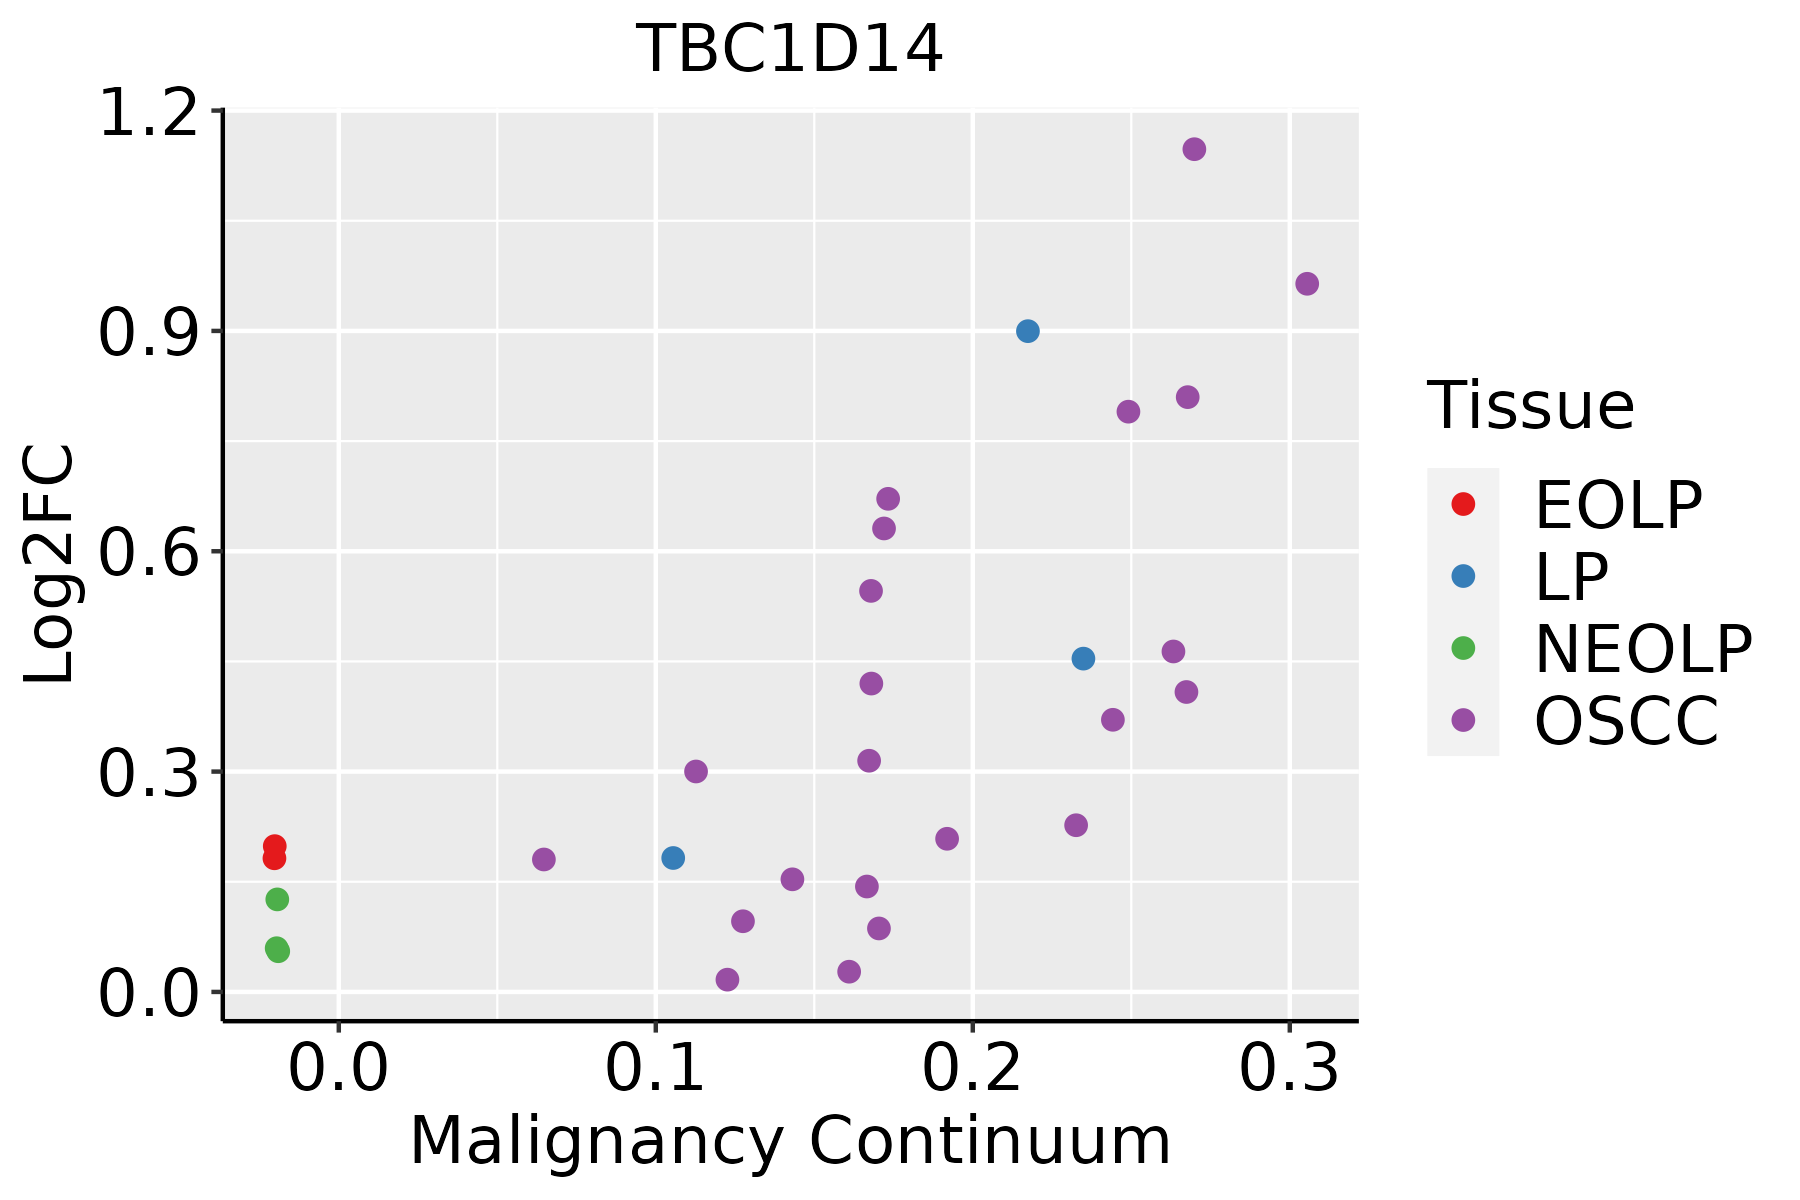 | EOLP: Erosive Oral lichen planus |
| LP: leukoplakia |
| NEOLP: Non-erosive oral lichen planus |
| OSCC: Oral squamous cell carcinoma |
| Skin | 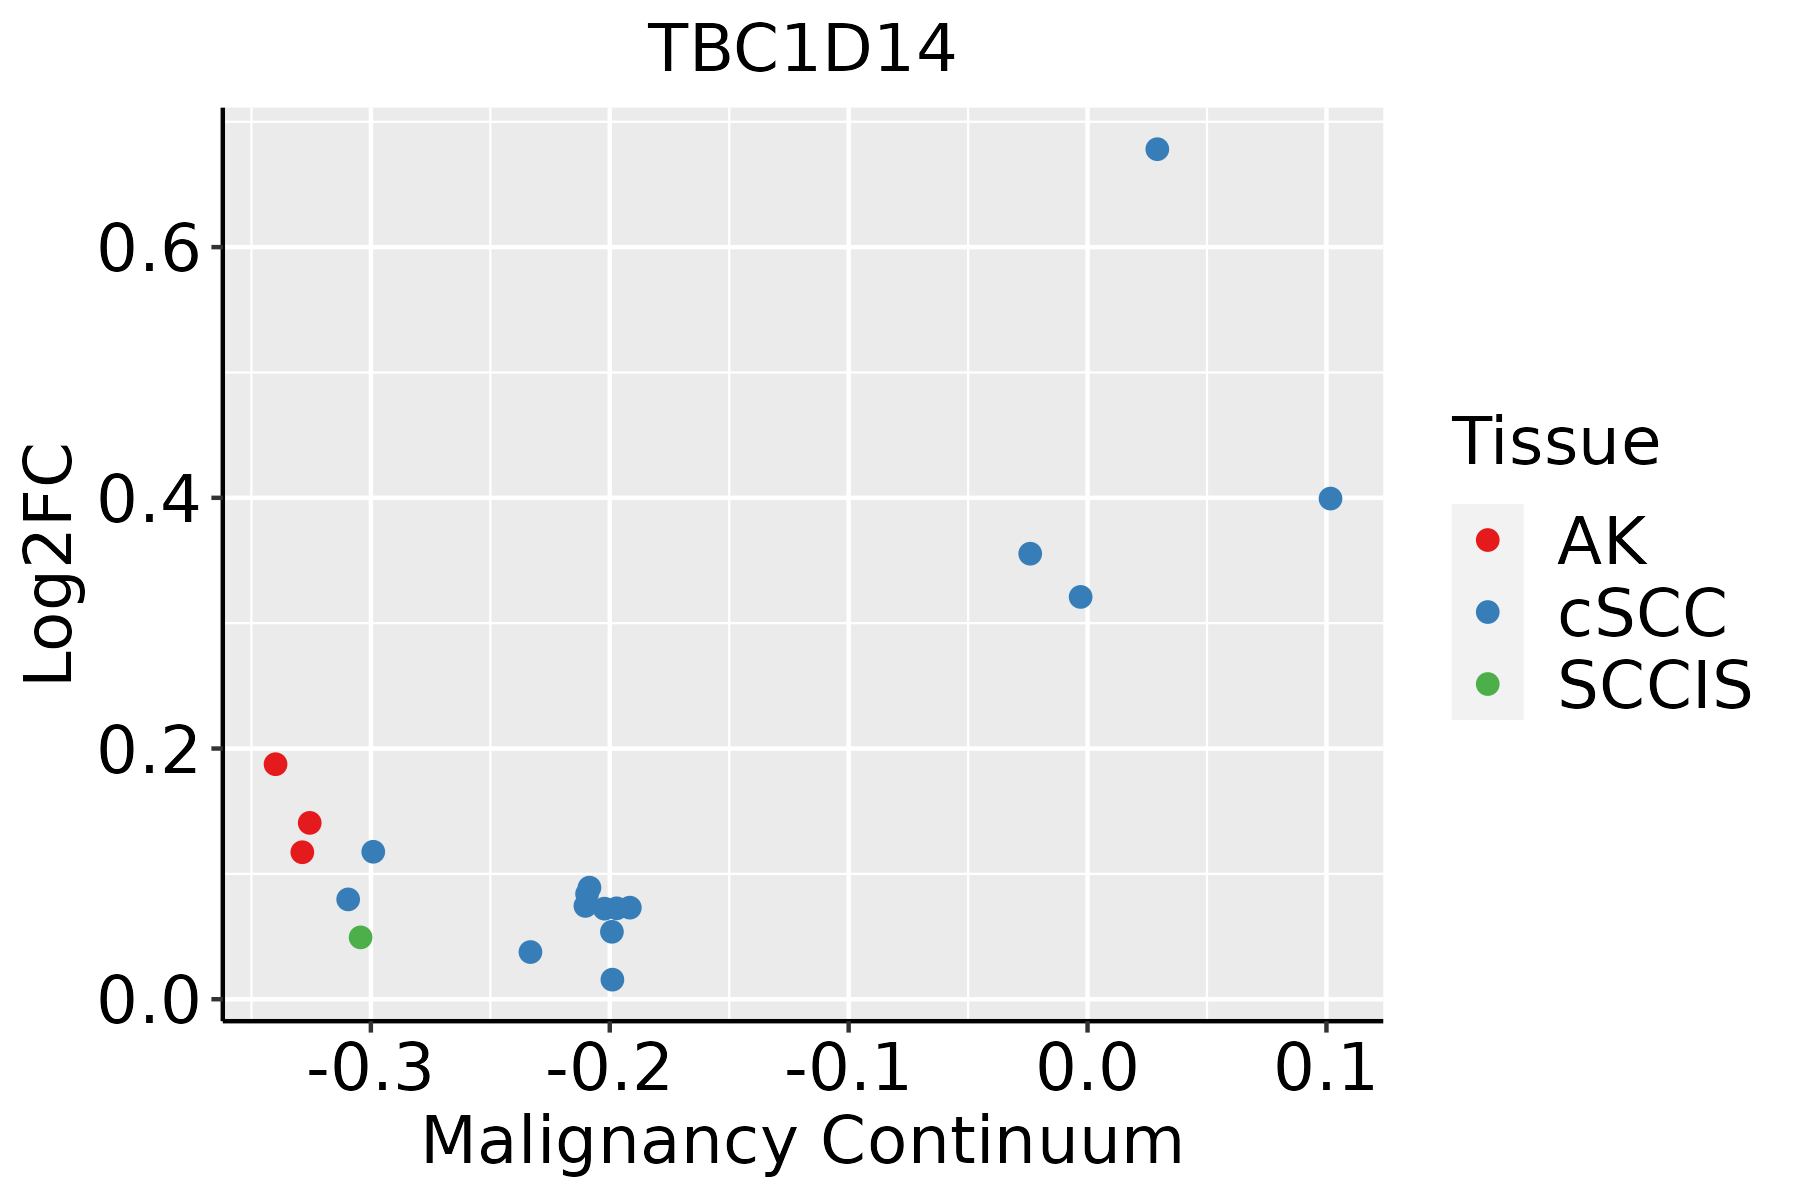 | AK: Actinic keratosis |
| cSCC: Cutaneous squamous cell carcinoma |
| SCCIS:squamous cell carcinoma in situ |
| GO ID | Tissue | Disease Stage | Description | Gene Ratio | Bg Ratio | pvalue | p.adjust | Count |
| GO:0009895 | Colorectum | AD | negative regulation of catabolic process | 124/3918 | 320/18723 | 1.66e-13 | 3.35e-11 | 124 |
| GO:0031330 | Colorectum | AD | negative regulation of cellular catabolic process | 104/3918 | 262/18723 | 2.66e-12 | 3.96e-10 | 104 |
| GO:0048193 | Colorectum | AD | Golgi vesicle transport | 109/3918 | 296/18723 | 1.80e-10 | 1.68e-08 | 109 |
| GO:0016197 | Colorectum | AD | endosomal transport | 90/3918 | 230/18723 | 1.88e-10 | 1.73e-08 | 90 |
| GO:0010506 | Colorectum | AD | regulation of autophagy | 111/3918 | 317/18723 | 3.57e-09 | 2.35e-07 | 111 |
| GO:0016482 | Colorectum | AD | cytosolic transport | 68/3918 | 168/18723 | 6.00e-09 | 3.72e-07 | 68 |
| GO:0016236 | Colorectum | AD | macroautophagy | 103/3918 | 291/18723 | 6.76e-09 | 4.15e-07 | 103 |
| GO:0043087 | Colorectum | AD | regulation of GTPase activity | 110/3918 | 348/18723 | 1.64e-06 | 5.03e-05 | 110 |
| GO:0042147 | Colorectum | AD | retrograde transport, endosome to Golgi | 37/3918 | 91/18723 | 1.46e-05 | 3.14e-04 | 37 |
| GO:0010507 | Colorectum | AD | negative regulation of autophagy | 31/3918 | 85/18723 | 6.91e-04 | 7.05e-03 | 31 |
| GO:0043547 | Colorectum | AD | positive regulation of GTPase activity | 75/3918 | 255/18723 | 7.95e-04 | 7.91e-03 | 75 |
| GO:0007033 | Colorectum | AD | vacuole organization | 53/3918 | 180/18723 | 4.18e-03 | 2.89e-02 | 53 |
| GO:00313302 | Colorectum | MSS | negative regulation of cellular catabolic process | 96/3467 | 262/18723 | 2.67e-12 | 4.63e-10 | 96 |
| GO:00098952 | Colorectum | MSS | negative regulation of catabolic process | 110/3467 | 320/18723 | 7.88e-12 | 1.20e-09 | 110 |
| GO:00481932 | Colorectum | MSS | Golgi vesicle transport | 101/3467 | 296/18723 | 9.09e-11 | 9.77e-09 | 101 |
| GO:00161972 | Colorectum | MSS | endosomal transport | 79/3467 | 230/18723 | 7.04e-09 | 4.39e-07 | 79 |
| GO:00162362 | Colorectum | MSS | macroautophagy | 93/3467 | 291/18723 | 2.08e-08 | 1.17e-06 | 93 |
| GO:00164822 | Colorectum | MSS | cytosolic transport | 59/3467 | 168/18723 | 2.29e-07 | 9.79e-06 | 59 |
| GO:00105062 | Colorectum | MSS | regulation of autophagy | 95/3467 | 317/18723 | 4.36e-07 | 1.71e-05 | 95 |
| GO:00430872 | Colorectum | MSS | regulation of GTPase activity | 101/3467 | 348/18723 | 1.00e-06 | 3.46e-05 | 101 |
| Hugo Symbol | Variant Class | Variant Classification | dbSNP RS | HGVSc | HGVSp | HGVSp Short | SWISSPROT | BIOTYPE | SIFT | PolyPhen | Tumor Sample Barcode | Tissue | Histology | Sex | Age | Stage | Therapy Types | Drugs | Outcome |
| TBC1D14 | SNV | Missense_Mutation | rs778562700 | c.116G>A | p.Arg39Gln | p.R39Q | Q9P2M4 | protein_coding | tolerated_low_confidence(0.24) | probably_damaging(0.978) | TCGA-AN-A046-01 | Breast | breast invasive carcinoma | Female | >=65 | I/II | Unknown | Unknown | SD |
| TBC1D14 | SNV | Missense_Mutation | | c.1348G>A | p.Glu450Lys | p.E450K | Q9P2M4 | protein_coding | tolerated(0.08) | possibly_damaging(0.455) | TCGA-AN-A046-01 | Breast | breast invasive carcinoma | Female | >=65 | I/II | Unknown | Unknown | SD |
| TBC1D14 | insertion | In_Frame_Ins | novel | c.944_945insTAAAATTTACAGTGTCCAGAAGAGAGAAAACATGCCTGTTAC | p.Ile315_Leu316insLysIleTyrSerValGlnLysArgGluAsnMetProValThr | p.I315_L316insKIYSVQKRENMPVT | Q9P2M4 | protein_coding | | | TCGA-A8-A09X-01 | Breast | breast invasive carcinoma | Female | <65 | III/IV | Unknown | Unknown | SD |
| TBC1D14 | insertion | Frame_Shift_Ins | novel | c.665_666insCTTG | p.Glu222AspfsTer4 | p.E222Dfs*4 | Q9P2M4 | protein_coding | | | TCGA-AN-A0FN-01 | Breast | breast invasive carcinoma | Female | <65 | I/II | Unknown | Unknown | SD |
| TBC1D14 | insertion | Frame_Shift_Ins | novel | c.666_667insACTCCTGGGCTCAAGTGGTCCTCCT | p.Ala223ThrfsTer10 | p.A223Tfs*10 | Q9P2M4 | protein_coding | | | TCGA-AN-A0FN-01 | Breast | breast invasive carcinoma | Female | <65 | I/II | Unknown | Unknown | SD |
| TBC1D14 | insertion | Frame_Shift_Ins | novel | c.683_684insGGGAACAGAGCGTGCGCAAATCCTCCACGTTTCCC | p.Leu229GlyfsTer13 | p.L229Gfs*13 | Q9P2M4 | protein_coding | | | TCGA-BH-A0HY-01 | Breast | breast invasive carcinoma | Female | <65 | I/II | Hormone Therapy | taxotere | CR |
| TBC1D14 | SNV | Missense_Mutation | rs780237415 | c.866N>A | p.Arg289Lys | p.R289K | Q9P2M4 | protein_coding | tolerated(0.23) | benign(0.015) | TCGA-C5-A1MH-01 | Cervix | cervical & endocervical cancer | Female | >=65 | III/IV | Chemotherapy | cisplatin | PD |
| TBC1D14 | SNV | Missense_Mutation | rs770100466 | c.1954N>A | p.Glu652Lys | p.E652K | Q9P2M4 | protein_coding | deleterious(0.02) | benign(0.07) | TCGA-DS-A7WH-01 | Cervix | cervical & endocervical cancer | Female | <65 | I/II | Chemotherapy | cisplatin | CR |
| TBC1D14 | SNV | Missense_Mutation | | c.493N>A | p.Glu165Lys | p.E165K | Q9P2M4 | protein_coding | deleterious_low_confidence(0) | benign(0.411) | TCGA-IR-A3LK-01 | Cervix | cervical & endocervical cancer | Female | >=65 | I/II | Chemotherapy | cisplatin | PD |
| TBC1D14 | SNV | Missense_Mutation | | c.937N>A | p.Ala313Thr | p.A313T | Q9P2M4 | protein_coding | deleterious(0) | possibly_damaging(0.781) | TCGA-A6-6780-01 | Colorectum | colon adenocarcinoma | Male | >=65 | I/II | Unknown | Unknown | SD |


