
|
|||||
|
 | |
| |
| |
| |
| |
| |
|
Gene: TBC1D10B |
Gene summary for TBC1D10B |
| Gene information | Species | Human | Gene symbol | TBC1D10B | Gene ID | 26000 |
| Gene name | TBC1 domain family member 10B | |
| Gene Alias | EPI64B | |
| Cytomap | 16p11.2 | |
| Gene Type | protein-coding | GO ID | GO:0006810 | UniProtAcc | Q4KMP7 |
Top |
Malignant transformation analysis |
| Identification of the aberrant gene expression in precancerous and cancerous lesions by comparing the gene expression of stem-like cells in diseased tissues with normal stem cells |
| Entrez ID | Symbol | Replicates | Species | Organ | Tissue | Adj P-value | Log2FC | Malignancy |
| 26000 | TBC1D10B | C04 | Human | Oral cavity | OSCC | 7.16e-18 | 6.22e-01 | 0.2633 |
| 26000 | TBC1D10B | C21 | Human | Oral cavity | OSCC | 9.43e-24 | 5.27e-01 | 0.2678 |
| 26000 | TBC1D10B | C30 | Human | Oral cavity | OSCC | 5.78e-38 | 1.15e+00 | 0.3055 |
| 26000 | TBC1D10B | C38 | Human | Oral cavity | OSCC | 9.35e-07 | 5.28e-01 | 0.172 |
| 26000 | TBC1D10B | C43 | Human | Oral cavity | OSCC | 4.15e-06 | 1.60e-01 | 0.1704 |
| 26000 | TBC1D10B | C46 | Human | Oral cavity | OSCC | 1.73e-14 | 2.31e-01 | 0.1673 |
| 26000 | TBC1D10B | C51 | Human | Oral cavity | OSCC | 5.94e-13 | 4.48e-01 | 0.2674 |
| 26000 | TBC1D10B | C57 | Human | Oral cavity | OSCC | 8.02e-11 | 2.29e-01 | 0.1679 |
| 26000 | TBC1D10B | C06 | Human | Oral cavity | OSCC | 5.31e-08 | 5.88e-01 | 0.2699 |
| 26000 | TBC1D10B | C07 | Human | Oral cavity | OSCC | 2.01e-05 | 3.75e-01 | 0.2491 |
| 26000 | TBC1D10B | C08 | Human | Oral cavity | OSCC | 8.16e-13 | 2.52e-01 | 0.1919 |
| 26000 | TBC1D10B | LN22 | Human | Oral cavity | OSCC | 1.09e-03 | 3.29e-01 | 0.1733 |
| 26000 | TBC1D10B | LN46 | Human | Oral cavity | OSCC | 8.19e-11 | 2.68e-01 | 0.1666 |
| 26000 | TBC1D10B | LP15 | Human | Oral cavity | LP | 9.93e-03 | 3.22e-01 | 0.2174 |
| 26000 | TBC1D10B | SYSMH1 | Human | Oral cavity | OSCC | 4.71e-05 | 1.49e-01 | 0.1127 |
| 26000 | TBC1D10B | SYSMH2 | Human | Oral cavity | OSCC | 8.13e-12 | 2.67e-01 | 0.2326 |
| 26000 | TBC1D10B | SYSMH3 | Human | Oral cavity | OSCC | 5.83e-18 | 3.78e-01 | 0.2442 |
| 26000 | TBC1D10B | SYSMH5 | Human | Oral cavity | OSCC | 1.10e-08 | 2.73e-01 | 0.0647 |
| 26000 | TBC1D10B | SYSMH6 | Human | Oral cavity | OSCC | 2.32e-04 | 9.99e-02 | 0.1275 |
| Page: 1 |
| Tissue | Expression Dynamics | Abbreviation |
| Oral Cavity | 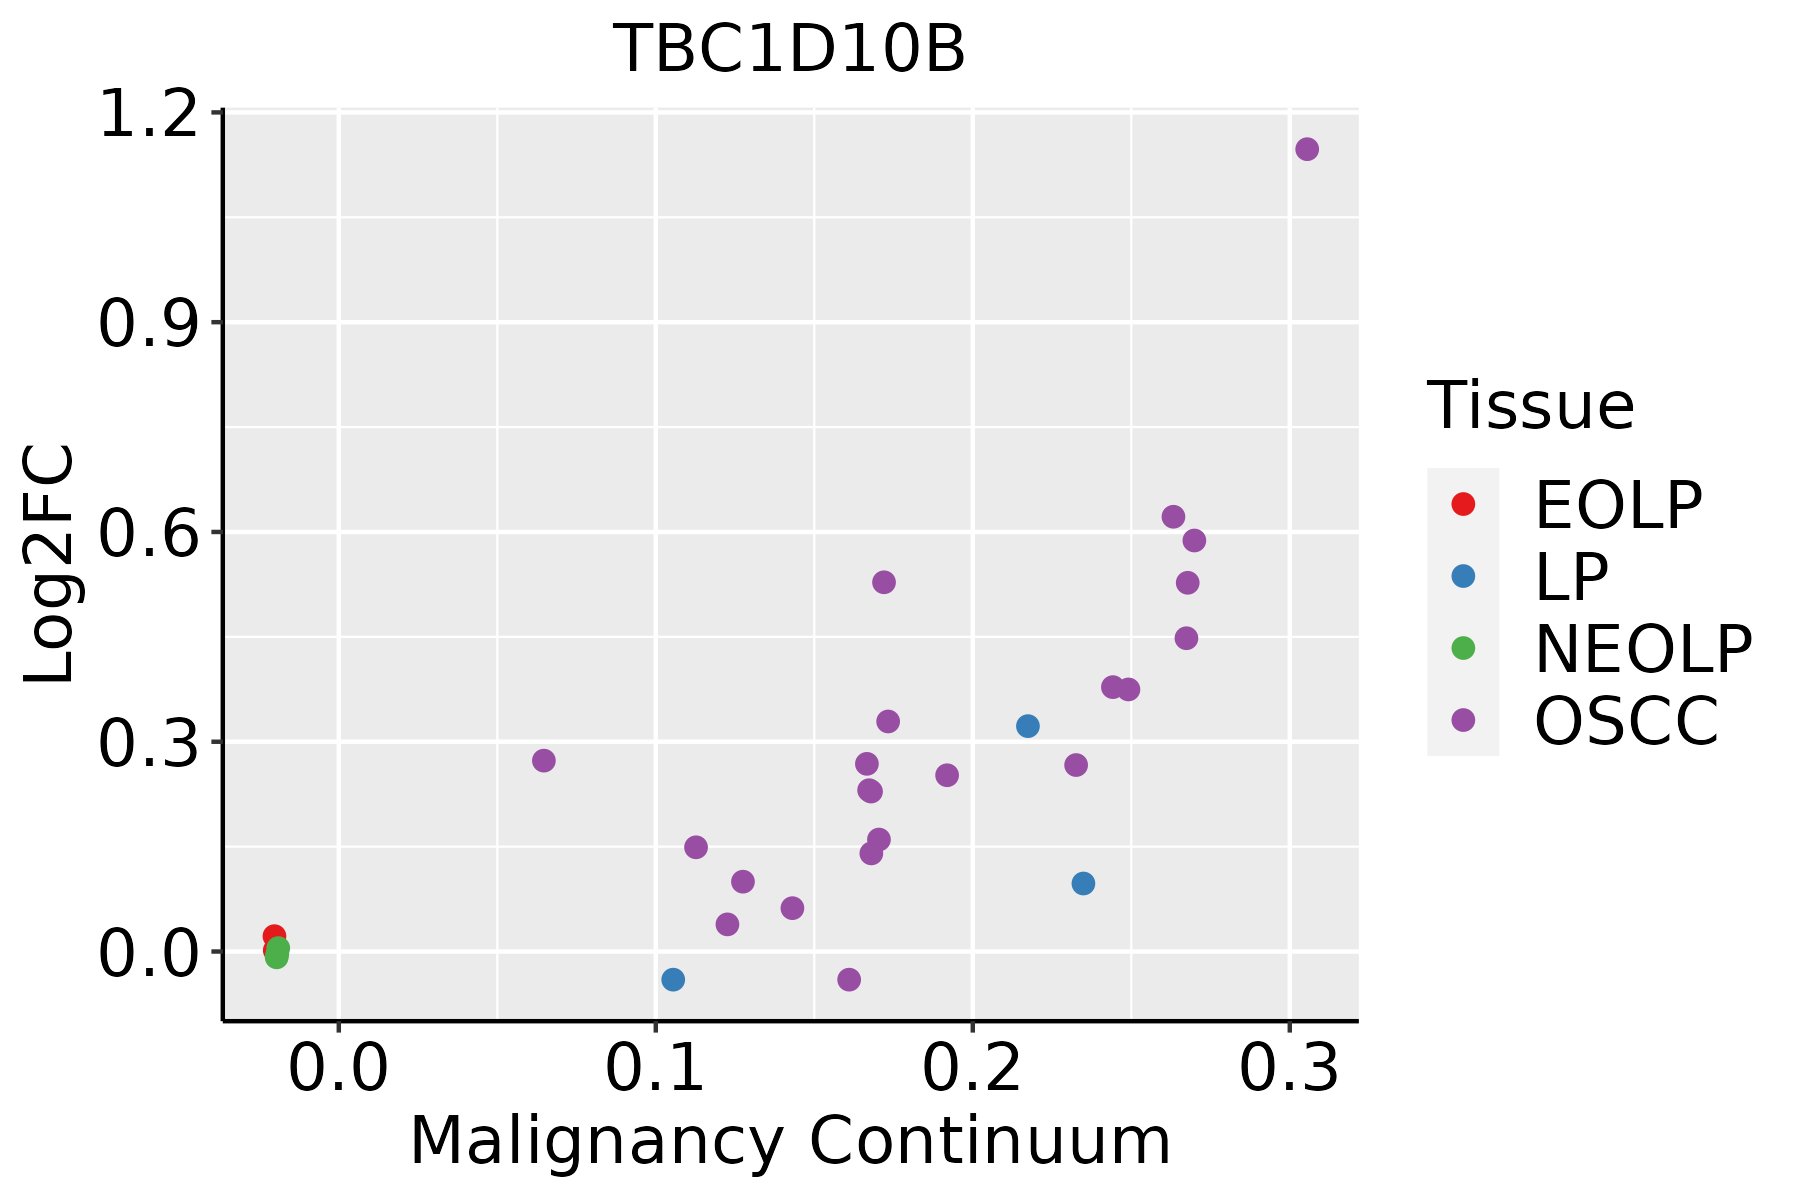 | EOLP: Erosive Oral lichen planus |
| LP: leukoplakia | ||
| NEOLP: Non-erosive oral lichen planus | ||
| OSCC: Oral squamous cell carcinoma |
| ∗log2FC in expression of this searched gene in stem-like cells from each diseased tissue sample relative to stem-like cells in normal samples in each tissue plotted against the malignancy continuum. Samples are colored based on if they are from different disease stage. |
Top |
Malignant transformation related pathway analysis |
| Find out the enriched GO biological processes and KEGG pathways involved in transition from healthy to precancer to cancer |
| Tissue | Disease Stage | Enriched GO biological Processes |
| Colorectum | AD |  |
| Colorectum | SER |  |
| Colorectum | MSS |  |
| Colorectum | MSI-H |  |
| Colorectum | FAP |  |
| ∗Top 15 enriched GO BP terms are showed in the bar plot of each disease state in each tissue. Each row represents a significant GO biological process which is colored according to the -log10(p.adjust). |
| Page: 1 2 3 4 5 6 7 8 9 |
| GO ID | Tissue | Disease Stage | Description | Gene Ratio | Bg Ratio | pvalue | p.adjust | Count |
| GO:00161979 | Oral cavity | OSCC | endosomal transport | 141/7305 | 230/18723 | 5.40e-12 | 2.06e-10 | 141 |
| GO:00164829 | Oral cavity | OSCC | cytosolic transport | 106/7305 | 168/18723 | 2.08e-10 | 5.90e-09 | 106 |
| GO:00421476 | Oral cavity | OSCC | retrograde transport, endosome to Golgi | 55/7305 | 91/18723 | 2.79e-05 | 2.59e-04 | 55 |
| GO:004308710 | Oral cavity | OSCC | regulation of GTPase activity | 165/7305 | 348/18723 | 7.94e-04 | 4.27e-03 | 165 |
| GO:001619714 | Oral cavity | LP | endosomal transport | 98/4623 | 230/18723 | 1.65e-09 | 7.50e-08 | 98 |
| GO:001648214 | Oral cavity | LP | cytosolic transport | 69/4623 | 168/18723 | 2.03e-06 | 4.65e-05 | 69 |
| GO:004214713 | Oral cavity | LP | retrograde transport, endosome to Golgi | 36/4623 | 91/18723 | 1.20e-03 | 9.67e-03 | 36 |
| Page: 1 |
| Pathway ID | Tissue | Disease Stage | Description | Gene Ratio | Bg Ratio | pvalue | p.adjust | qvalue | Count |
| Page: 1 |
Top |
Cell-cell communication analysis |
| Identification of potential cell-cell interactions between two cell types and their ligand-receptor pairs for different disease states |
| Ligand | Receptor | LRpair | Pathway | Tissue | Disease Stage |
| Page: 1 |
Top |
Single-cell gene regulatory network inference analysis |
| Find out the significant the regulons (TFs) and the target genes of each regulon across cell types for different disease states |
| TF | Cell Type | Tissue | Disease Stage | Target Gene | RSS | Regulon Activity |
| ∗The dot plots of a searched regulon are shown for all cell subpopulations in each disease state of each tissue based on the regulon specific score inferred using pySCENIC and by calculating the average expression. |
| Page: 1 |
Top |
Somatic mutation of malignant transformation related genes |
| Annotation of somatic variants for genes involved in malignant transformation |
| Hugo Symbol | Variant Class | Variant Classification | dbSNP RS | HGVSc | HGVSp | HGVSp Short | SWISSPROT | BIOTYPE | SIFT | PolyPhen | Tumor Sample Barcode | Tissue | Histology | Sex | Age | Stage | Therapy Types | Drugs | Outcome |
| TBC1D10B | SNV | Missense_Mutation | rs779953424 | c.1926N>G | p.Ile642Met | p.I642M | Q4KMP7 | protein_coding | deleterious_low_confidence(0.01) | probably_damaging(0.947) | TCGA-D8-A1J9-01 | Breast | breast invasive carcinoma | Female | <65 | I/II | Unknown | Unknown | SD |
| TBC1D10B | SNV | Missense_Mutation | novel | c.961A>T | p.Ser321Cys | p.S321C | Q4KMP7 | protein_coding | deleterious(0.01) | possibly_damaging(0.827) | TCGA-EW-A423-01 | Breast | breast invasive carcinoma | Female | >=65 | I/II | Hormone Therapy | anastrozole | SD |
| TBC1D10B | SNV | Missense_Mutation | c.1311N>G | p.Ile437Met | p.I437M | Q4KMP7 | protein_coding | deleterious(0.02) | probably_damaging(0.954) | TCGA-DG-A2KM-01 | Cervix | cervical & endocervical cancer | Female | <65 | I/II | Chemotherapy | cisplatin | SD | |
| TBC1D10B | SNV | Missense_Mutation | c.383N>G | p.Ala128Gly | p.A128G | Q4KMP7 | protein_coding | tolerated_low_confidence(0.11) | benign(0.003) | TCGA-IR-A3LK-01 | Cervix | cervical & endocervical cancer | Female | >=65 | I/II | Chemotherapy | cisplatin | PD | |
| TBC1D10B | SNV | Missense_Mutation | novel | c.778N>G | p.Arg260Gly | p.R260G | Q4KMP7 | protein_coding | deleterious_low_confidence(0.03) | possibly_damaging(0.744) | TCGA-Q1-A5R2-01 | Cervix | cervical & endocervical cancer | Female | <65 | I/II | Chemotherapy | cisplatin | PR |
| TBC1D10B | SNV | Missense_Mutation | novel | c.1345G>A | p.Ala449Thr | p.A449T | Q4KMP7 | protein_coding | deleterious(0) | probably_damaging(0.967) | TCGA-VS-A94Z-01 | Cervix | cervical & endocervical cancer | Female | <65 | I/II | Chemotherapy | cisplatin | CR |
| TBC1D10B | SNV | Missense_Mutation | rs770016893 | c.979G>A | p.Val327Met | p.V327M | Q4KMP7 | protein_coding | deleterious(0) | possibly_damaging(0.873) | TCGA-5M-AAT6-01 | Colorectum | colon adenocarcinoma | Female | <65 | III/IV | Unknown | Unknown | PD |
| TBC1D10B | SNV | Missense_Mutation | novel | c.1039N>C | p.Ser347Pro | p.S347P | Q4KMP7 | protein_coding | deleterious(0.04) | benign(0.333) | TCGA-A6-5665-01 | Colorectum | colon adenocarcinoma | Female | >=65 | I/II | Unknown | Unknown | PD |
| TBC1D10B | SNV | Missense_Mutation | c.1046N>A | p.Arg349Gln | p.R349Q | Q4KMP7 | protein_coding | deleterious(0.05) | benign(0.072) | TCGA-A6-6141-01 | Colorectum | colon adenocarcinoma | Male | <65 | I/II | Chemotherapy | 5-fu | SD | |
| TBC1D10B | SNV | Missense_Mutation | rs571905839 | c.2178N>T | p.Lys726Asn | p.K726N | Q4KMP7 | protein_coding | deleterious_low_confidence(0.04) | possibly_damaging(0.527) | TCGA-A6-6653-01 | Colorectum | colon adenocarcinoma | Male | >=65 | I/II | Unknown | Unknown | SD |
| Page: 1 2 3 4 5 |
Top |
Related drugs of malignant transformation related genes |
| Identification of chemicals and drugs interact with genes involved in malignant transfromation |
| (DGIdb 4.0) |
| Entrez ID | Symbol | Category | Interaction Types | Drug Claim Name | Drug Name | PMIDs |
| Page: 1 |

Copyright 2023-Present -The University of Texas Health Science Center at Houston |