
|
|||||
|
 | |
| |
| |
| |
| |
| |
|
Gene: TBC1D10A |
Gene summary for TBC1D10A |
| Gene information | Species | Human | Gene symbol | TBC1D10A | Gene ID | 83874 |
| Gene name | TBC1 domain family member 10A | |
| Gene Alias | EPI64 | |
| Cytomap | 22q12.2 | |
| Gene Type | protein-coding | GO ID | GO:0006508 | UniProtAcc | A7E244 |
Top |
Malignant transformation analysis |
| Identification of the aberrant gene expression in precancerous and cancerous lesions by comparing the gene expression of stem-like cells in diseased tissues with normal stem cells |
| Entrez ID | Symbol | Replicates | Species | Organ | Tissue | Adj P-value | Log2FC | Malignancy |
| 83874 | TBC1D10A | LZE4T | Human | Esophagus | ESCC | 3.59e-05 | 1.42e-01 | 0.0811 |
| 83874 | TBC1D10A | LZE7T | Human | Esophagus | ESCC | 1.22e-05 | 2.77e-01 | 0.0667 |
| 83874 | TBC1D10A | LZE8T | Human | Esophagus | ESCC | 5.46e-10 | 2.67e-01 | 0.067 |
| 83874 | TBC1D10A | LZE24T | Human | Esophagus | ESCC | 6.38e-14 | 3.36e-01 | 0.0596 |
| 83874 | TBC1D10A | LZE21T | Human | Esophagus | ESCC | 1.23e-02 | 2.75e-01 | 0.0655 |
| 83874 | TBC1D10A | P1T-E | Human | Esophagus | ESCC | 3.32e-07 | 2.75e-01 | 0.0875 |
| 83874 | TBC1D10A | P2T-E | Human | Esophagus | ESCC | 1.53e-24 | 4.10e-01 | 0.1177 |
| 83874 | TBC1D10A | P4T-E | Human | Esophagus | ESCC | 4.11e-10 | 2.79e-01 | 0.1323 |
| 83874 | TBC1D10A | P5T-E | Human | Esophagus | ESCC | 9.22e-05 | 9.10e-02 | 0.1327 |
| 83874 | TBC1D10A | P8T-E | Human | Esophagus | ESCC | 1.88e-21 | 3.74e-01 | 0.0889 |
| 83874 | TBC1D10A | P9T-E | Human | Esophagus | ESCC | 4.65e-07 | 1.88e-01 | 0.1131 |
| 83874 | TBC1D10A | P10T-E | Human | Esophagus | ESCC | 2.58e-23 | 3.51e-01 | 0.116 |
| 83874 | TBC1D10A | P11T-E | Human | Esophagus | ESCC | 7.81e-16 | 7.46e-01 | 0.1426 |
| 83874 | TBC1D10A | P12T-E | Human | Esophagus | ESCC | 4.71e-15 | 2.91e-01 | 0.1122 |
| 83874 | TBC1D10A | P15T-E | Human | Esophagus | ESCC | 6.40e-18 | 3.95e-01 | 0.1149 |
| 83874 | TBC1D10A | P16T-E | Human | Esophagus | ESCC | 1.11e-14 | 2.56e-01 | 0.1153 |
| 83874 | TBC1D10A | P17T-E | Human | Esophagus | ESCC | 2.07e-04 | 4.06e-01 | 0.1278 |
| 83874 | TBC1D10A | P19T-E | Human | Esophagus | ESCC | 4.69e-03 | 2.85e-01 | 0.1662 |
| 83874 | TBC1D10A | P20T-E | Human | Esophagus | ESCC | 6.56e-27 | 7.11e-01 | 0.1124 |
| 83874 | TBC1D10A | P21T-E | Human | Esophagus | ESCC | 9.40e-20 | 4.49e-01 | 0.1617 |
| Page: 1 2 3 4 |
| Tissue | Expression Dynamics | Abbreviation |
| Esophagus |  | ESCC: Esophageal squamous cell carcinoma |
| HGIN: High-grade intraepithelial neoplasias | ||
| LGIN: Low-grade intraepithelial neoplasias | ||
| Oral Cavity | 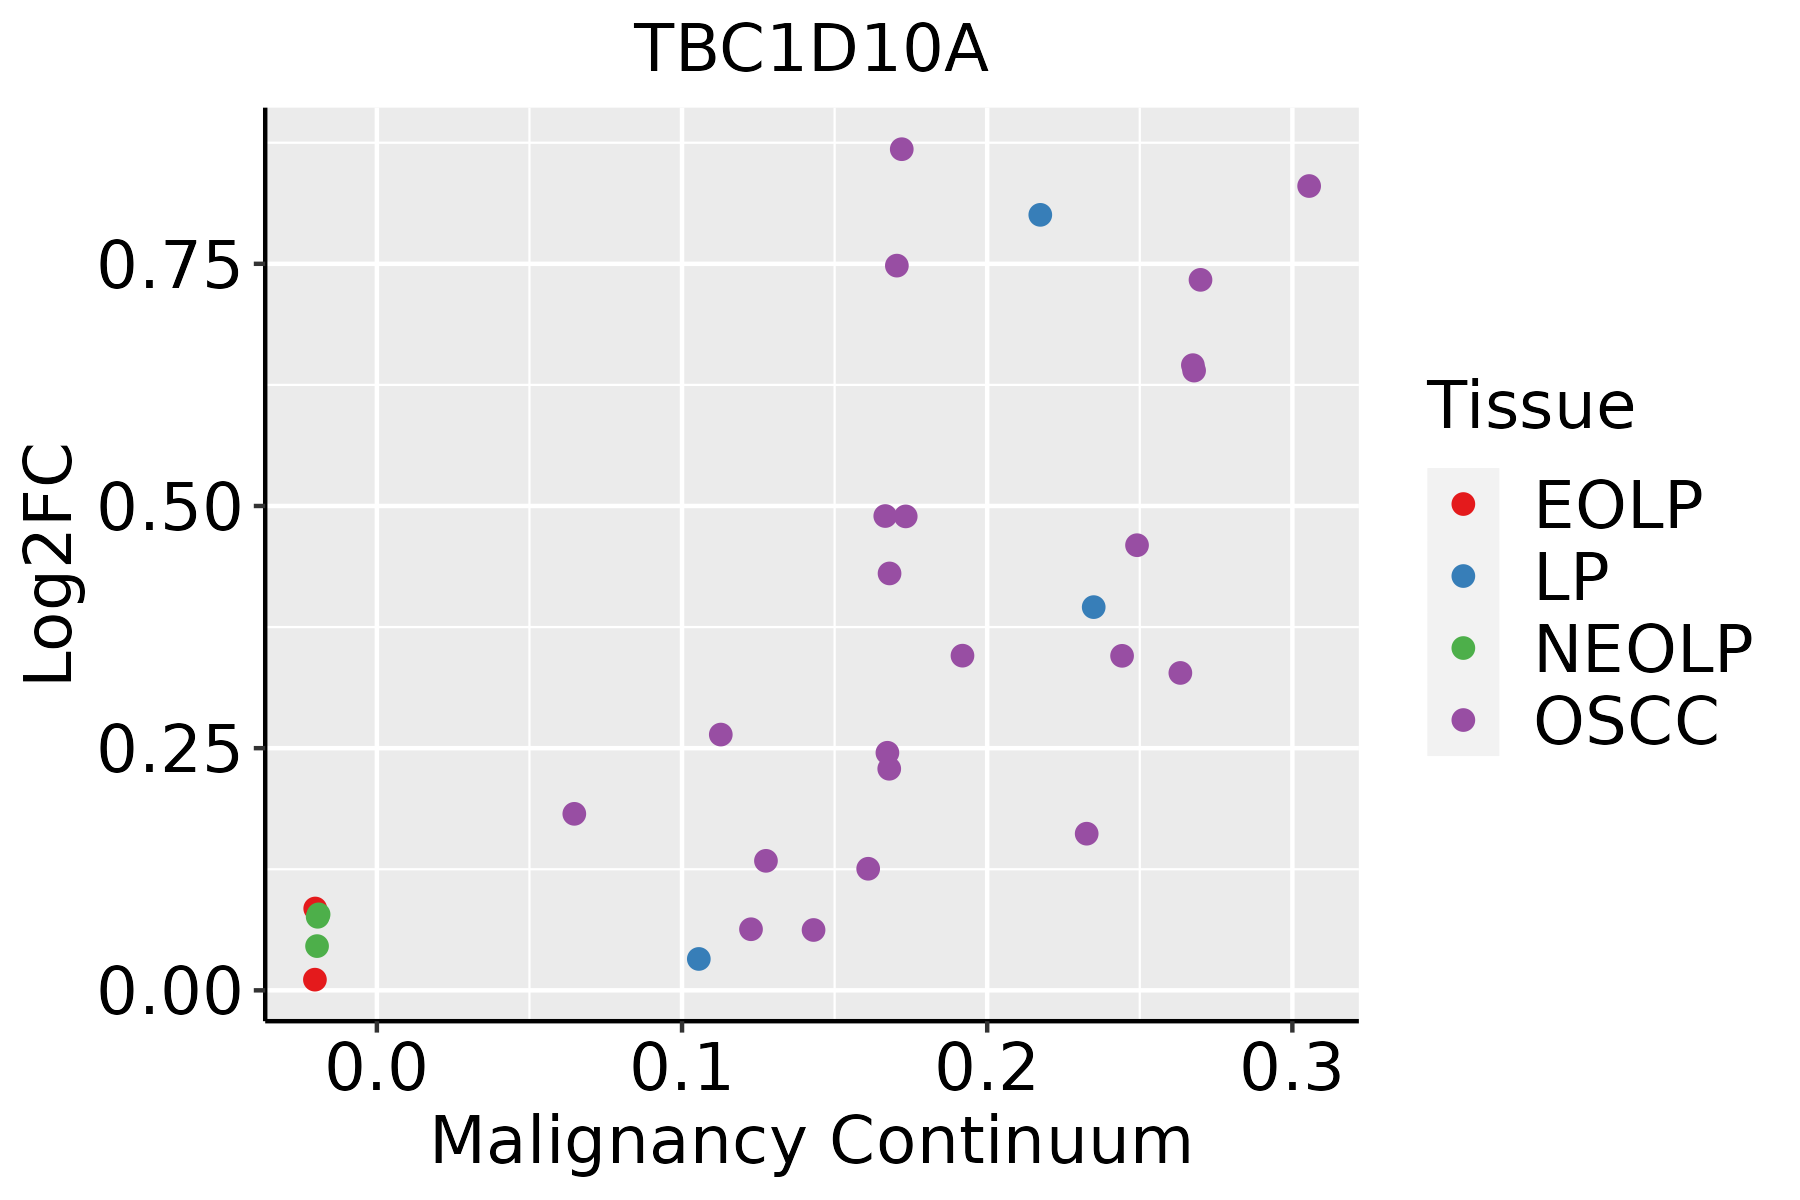 | EOLP: Erosive Oral lichen planus |
| LP: leukoplakia | ||
| NEOLP: Non-erosive oral lichen planus | ||
| OSCC: Oral squamous cell carcinoma |
| ∗log2FC in expression of this searched gene in stem-like cells from each diseased tissue sample relative to stem-like cells in normal samples in each tissue plotted against the malignancy continuum. Samples are colored based on if they are from different disease stage. |
Top |
Malignant transformation related pathway analysis |
| Find out the enriched GO biological processes and KEGG pathways involved in transition from healthy to precancer to cancer |
| Tissue | Disease Stage | Enriched GO biological Processes |
| Colorectum | AD |  |
| Colorectum | SER |  |
| Colorectum | MSS |  |
| Colorectum | MSI-H |  |
| Colorectum | FAP |  |
| ∗Top 15 enriched GO BP terms are showed in the bar plot of each disease state in each tissue. Each row represents a significant GO biological process which is colored according to the -log10(p.adjust). |
| Page: 1 2 3 4 5 6 7 8 9 |
| GO ID | Tissue | Disease Stage | Description | Gene Ratio | Bg Ratio | pvalue | p.adjust | Count |
| GO:0045862111 | Esophagus | ESCC | positive regulation of proteolysis | 256/8552 | 372/18723 | 7.88e-20 | 9.43e-18 | 256 |
| GO:001619715 | Esophagus | ESCC | endosomal transport | 168/8552 | 230/18723 | 2.28e-17 | 1.93e-15 | 168 |
| GO:001648210 | Esophagus | ESCC | cytosolic transport | 124/8552 | 168/18723 | 9.69e-14 | 4.69e-12 | 124 |
| GO:2000116111 | Esophagus | ESCC | regulation of cysteine-type endopeptidase activity | 158/8552 | 235/18723 | 1.67e-11 | 5.90e-10 | 158 |
| GO:005160418 | Esophagus | ESCC | protein maturation | 189/8552 | 294/18723 | 7.64e-11 | 2.39e-09 | 189 |
| GO:0010952111 | Esophagus | ESCC | positive regulation of peptidase activity | 133/8552 | 197/18723 | 4.31e-10 | 1.14e-08 | 133 |
| GO:0052547111 | Esophagus | ESCC | regulation of peptidase activity | 275/8552 | 461/18723 | 7.54e-10 | 1.88e-08 | 275 |
| GO:0052548111 | Esophagus | ESCC | regulation of endopeptidase activity | 253/8552 | 432/18723 | 3.68e-08 | 6.78e-07 | 253 |
| GO:0010950111 | Esophagus | ESCC | positive regulation of endopeptidase activity | 116/8552 | 179/18723 | 1.77e-07 | 2.79e-06 | 116 |
| GO:00421477 | Esophagus | ESCC | retrograde transport, endosome to Golgi | 63/8552 | 91/18723 | 4.58e-06 | 4.87e-05 | 63 |
| GO:2001056110 | Esophagus | ESCC | positive regulation of cysteine-type endopeptidase activity | 94/8552 | 148/18723 | 8.87e-06 | 8.59e-05 | 94 |
| GO:001648514 | Esophagus | ESCC | protein processing | 134/8552 | 225/18723 | 1.81e-05 | 1.60e-04 | 134 |
| GO:004308715 | Esophagus | ESCC | regulation of GTPase activity | 183/8552 | 348/18723 | 5.34e-03 | 2.00e-02 | 183 |
| GO:004586220 | Oral cavity | OSCC | positive regulation of proteolysis | 236/7305 | 372/18723 | 6.53e-22 | 1.38e-19 | 236 |
| GO:200011620 | Oral cavity | OSCC | regulation of cysteine-type endopeptidase activity | 152/7305 | 235/18723 | 1.14e-15 | 8.13e-14 | 152 |
| GO:005254720 | Oral cavity | OSCC | regulation of peptidase activity | 255/7305 | 461/18723 | 5.78e-13 | 2.75e-11 | 255 |
| GO:00161979 | Oral cavity | OSCC | endosomal transport | 141/7305 | 230/18723 | 5.40e-12 | 2.06e-10 | 141 |
| GO:001095220 | Oral cavity | OSCC | positive regulation of peptidase activity | 123/7305 | 197/18723 | 2.12e-11 | 7.21e-10 | 123 |
| GO:005160410 | Oral cavity | OSCC | protein maturation | 170/7305 | 294/18723 | 3.97e-11 | 1.28e-09 | 170 |
| GO:005254820 | Oral cavity | OSCC | regulation of endopeptidase activity | 235/7305 | 432/18723 | 4.35e-11 | 1.40e-09 | 235 |
| Page: 1 2 3 |
| Pathway ID | Tissue | Disease Stage | Description | Gene Ratio | Bg Ratio | pvalue | p.adjust | qvalue | Count |
| Page: 1 |
Top |
Cell-cell communication analysis |
| Identification of potential cell-cell interactions between two cell types and their ligand-receptor pairs for different disease states |
| Ligand | Receptor | LRpair | Pathway | Tissue | Disease Stage |
| Page: 1 |
Top |
Single-cell gene regulatory network inference analysis |
| Find out the significant the regulons (TFs) and the target genes of each regulon across cell types for different disease states |
| TF | Cell Type | Tissue | Disease Stage | Target Gene | RSS | Regulon Activity |
| ∗The dot plots of a searched regulon are shown for all cell subpopulations in each disease state of each tissue based on the regulon specific score inferred using pySCENIC and by calculating the average expression. |
| Page: 1 |
Top |
Somatic mutation of malignant transformation related genes |
| Annotation of somatic variants for genes involved in malignant transformation |
| Hugo Symbol | Variant Class | Variant Classification | dbSNP RS | HGVSc | HGVSp | HGVSp Short | SWISSPROT | BIOTYPE | SIFT | PolyPhen | Tumor Sample Barcode | Tissue | Histology | Sex | Age | Stage | Therapy Types | Drugs | Outcome |
| TBC1D10A | SNV | Missense_Mutation | rs375338376 | c.1109G>A | p.Arg370His | p.R370H | Q9BXI6 | protein_coding | deleterious(0.03) | benign(0.071) | TCGA-AN-A0AK-01 | Breast | breast invasive carcinoma | Female | >=65 | I/II | Unknown | Unknown | SD |
| TBC1D10A | SNV | Missense_Mutation | rs138242222 | c.158G>A | p.Arg53His | p.R53H | Q9BXI6 | protein_coding | deleterious(0.03) | benign(0.001) | TCGA-BH-A18P-01 | Breast | breast invasive carcinoma | Female | <65 | I/II | Unknown | Unknown | PD |
| TBC1D10A | SNV | Missense_Mutation | rs765679285 | c.325N>C | p.Lys109Gln | p.K109Q | Q9BXI6 | protein_coding | tolerated(0.25) | benign(0.118) | TCGA-C8-A26X-01 | Breast | breast invasive carcinoma | Female | <65 | I/II | Chemotherapy | 5-fluorouracil | CR |
| TBC1D10A | SNV | Missense_Mutation | rs749302364 | c.236A>G | p.Glu79Gly | p.E79G | Q9BXI6 | protein_coding | tolerated(0.31) | benign(0.009) | TCGA-D8-A1XF-01 | Breast | breast invasive carcinoma | Female | <65 | I/II | Chemotherapy | adriamycin+cyclophosphamide | SD |
| TBC1D10A | insertion | Nonsense_Mutation | novel | c.1516_1517insAGTCCCTGGTCAGCCCCCATTCTTAAC | p.Thr506delinsLysSerLeuValSerProHisSerTerPro | p.T506delinsKSLVSPHS*P | Q9BXI6 | protein_coding | TCGA-BH-A0HF-01 | Breast | breast invasive carcinoma | Female | >=65 | I/II | Hormone Therapy | arimidex | SD | ||
| TBC1D10A | deletion | Frame_Shift_Del | c.960delC | p.His320GlnfsTer44 | p.H320Qfs*44 | Q9BXI6 | protein_coding | TCGA-LL-A6FR-01 | Breast | breast invasive carcinoma | Female | <65 | I/II | Chemotherapy | adriamycin | SD | |||
| TBC1D10A | SNV | Missense_Mutation | rs368312026 | c.1096N>T | p.Arg366Cys | p.R366C | Q9BXI6 | protein_coding | deleterious(0) | possibly_damaging(0.462) | TCGA-2W-A8YY-01 | Cervix | cervical & endocervical cancer | Female | <65 | I/II | Chemotherapy | cisplatin | CR |
| TBC1D10A | SNV | Missense_Mutation | rs201955996 | c.1166N>A | p.Arg389His | p.R389H | Q9BXI6 | protein_coding | tolerated(0.05) | benign(0.001) | TCGA-BI-A0VR-01 | Cervix | cervical & endocervical cancer | Female | <65 | III/IV | Unknown | Unknown | SD |
| TBC1D10A | SNV | Missense_Mutation | novel | c.1531G>A | p.Glu511Lys | p.E511K | Q9BXI6 | protein_coding | deleterious_low_confidence(0.02) | possibly_damaging(0.696) | TCGA-C5-A8XH-01 | Cervix | cervical & endocervical cancer | Female | <65 | I/II | Unknown | Unknown | SD |
| TBC1D10A | SNV | Missense_Mutation | novel | c.502N>A | p.Gln168Lys | p.Q168K | Q9BXI6 | protein_coding | deleterious(0) | probably_damaging(0.965) | TCGA-C5-A905-01 | Cervix | cervical & endocervical cancer | Female | <65 | I/II | Unknown | Unknown | SD |
| Page: 1 2 3 4 5 6 7 |
Top |
Related drugs of malignant transformation related genes |
| Identification of chemicals and drugs interact with genes involved in malignant transfromation |
| (DGIdb 4.0) |
| Entrez ID | Symbol | Category | Interaction Types | Drug Claim Name | Drug Name | PMIDs |
| Page: 1 |

Copyright 2023-Present -The University of Texas Health Science Center at Houston |