
|
|||||
|
 | |
| |
| |
| |
| |
| |
|
Gene: TAX1BP3 |
Gene summary for TAX1BP3 |
| Gene information | Species | Human | Gene symbol | TAX1BP3 | Gene ID | 30851 |
| Gene name | Tax1 binding protein 3 | |
| Gene Alias | TIP-1 | |
| Cytomap | 17p13.2 | |
| Gene Type | protein-coding | GO ID | GO:0007154 | UniProtAcc | A0A087X282 |
Top |
Malignant transformation analysis |
| Identification of the aberrant gene expression in precancerous and cancerous lesions by comparing the gene expression of stem-like cells in diseased tissues with normal stem cells |
| Entrez ID | Symbol | Replicates | Species | Organ | Tissue | Adj P-value | Log2FC | Malignancy |
| 30851 | TAX1BP3 | HTA11_3410_2000001011 | Human | Colorectum | AD | 1.42e-24 | 4.18e-01 | 0.0155 |
| 30851 | TAX1BP3 | HTA11_2487_2000001011 | Human | Colorectum | SER | 7.87e-35 | 1.13e+00 | -0.1808 |
| 30851 | TAX1BP3 | HTA11_1938_2000001011 | Human | Colorectum | AD | 5.23e-25 | 8.05e-01 | -0.0811 |
| 30851 | TAX1BP3 | HTA11_78_2000001011 | Human | Colorectum | AD | 4.44e-14 | 4.25e-01 | -0.1088 |
| 30851 | TAX1BP3 | HTA11_347_2000001011 | Human | Colorectum | AD | 1.04e-34 | 6.86e-01 | -0.1954 |
| 30851 | TAX1BP3 | HTA11_411_2000001011 | Human | Colorectum | SER | 7.44e-20 | 1.74e+00 | -0.2602 |
| 30851 | TAX1BP3 | HTA11_2112_2000001011 | Human | Colorectum | SER | 7.84e-09 | 1.17e+00 | -0.2196 |
| 30851 | TAX1BP3 | HTA11_3361_2000001011 | Human | Colorectum | AD | 5.07e-22 | 7.09e-01 | -0.1207 |
| 30851 | TAX1BP3 | HTA11_83_2000001011 | Human | Colorectum | SER | 2.86e-13 | 7.38e-01 | -0.1526 |
| 30851 | TAX1BP3 | HTA11_696_2000001011 | Human | Colorectum | AD | 5.86e-26 | 7.66e-01 | -0.1464 |
| 30851 | TAX1BP3 | HTA11_866_2000001011 | Human | Colorectum | AD | 1.40e-11 | 4.07e-01 | -0.1001 |
| 30851 | TAX1BP3 | HTA11_1391_2000001011 | Human | Colorectum | AD | 8.63e-40 | 9.68e-01 | -0.059 |
| 30851 | TAX1BP3 | HTA11_2992_2000001011 | Human | Colorectum | SER | 1.72e-24 | 1.43e+00 | -0.1706 |
| 30851 | TAX1BP3 | HTA11_5212_2000001011 | Human | Colorectum | AD | 5.78e-20 | 1.20e+00 | -0.2061 |
| 30851 | TAX1BP3 | HTA11_5216_2000001011 | Human | Colorectum | SER | 3.19e-14 | 7.96e-01 | -0.1462 |
| 30851 | TAX1BP3 | HTA11_546_2000001011 | Human | Colorectum | AD | 1.06e-07 | 4.02e-01 | -0.0842 |
| 30851 | TAX1BP3 | HTA11_7862_2000001011 | Human | Colorectum | AD | 1.83e-11 | 3.89e-01 | -0.0179 |
| 30851 | TAX1BP3 | HTA11_866_3004761011 | Human | Colorectum | AD | 4.42e-22 | 5.37e-01 | 0.096 |
| 30851 | TAX1BP3 | HTA11_8622_2000001021 | Human | Colorectum | SER | 5.07e-06 | 3.61e-01 | 0.0528 |
| 30851 | TAX1BP3 | HTA11_7663_2000001011 | Human | Colorectum | SER | 2.12e-06 | 4.86e-01 | 0.0131 |
| Page: 1 2 3 4 5 6 7 8 9 10 11 |
| Tissue | Expression Dynamics | Abbreviation |
| Colorectum (GSE201348) |  | FAP: Familial adenomatous polyposis |
| CRC: Colorectal cancer | ||
| Colorectum (HTA11) |  | AD: Adenomas |
| SER: Sessile serrated lesions | ||
| MSI-H: Microsatellite-high colorectal cancer | ||
| MSS: Microsatellite stable colorectal cancer | ||
| Endometrium | 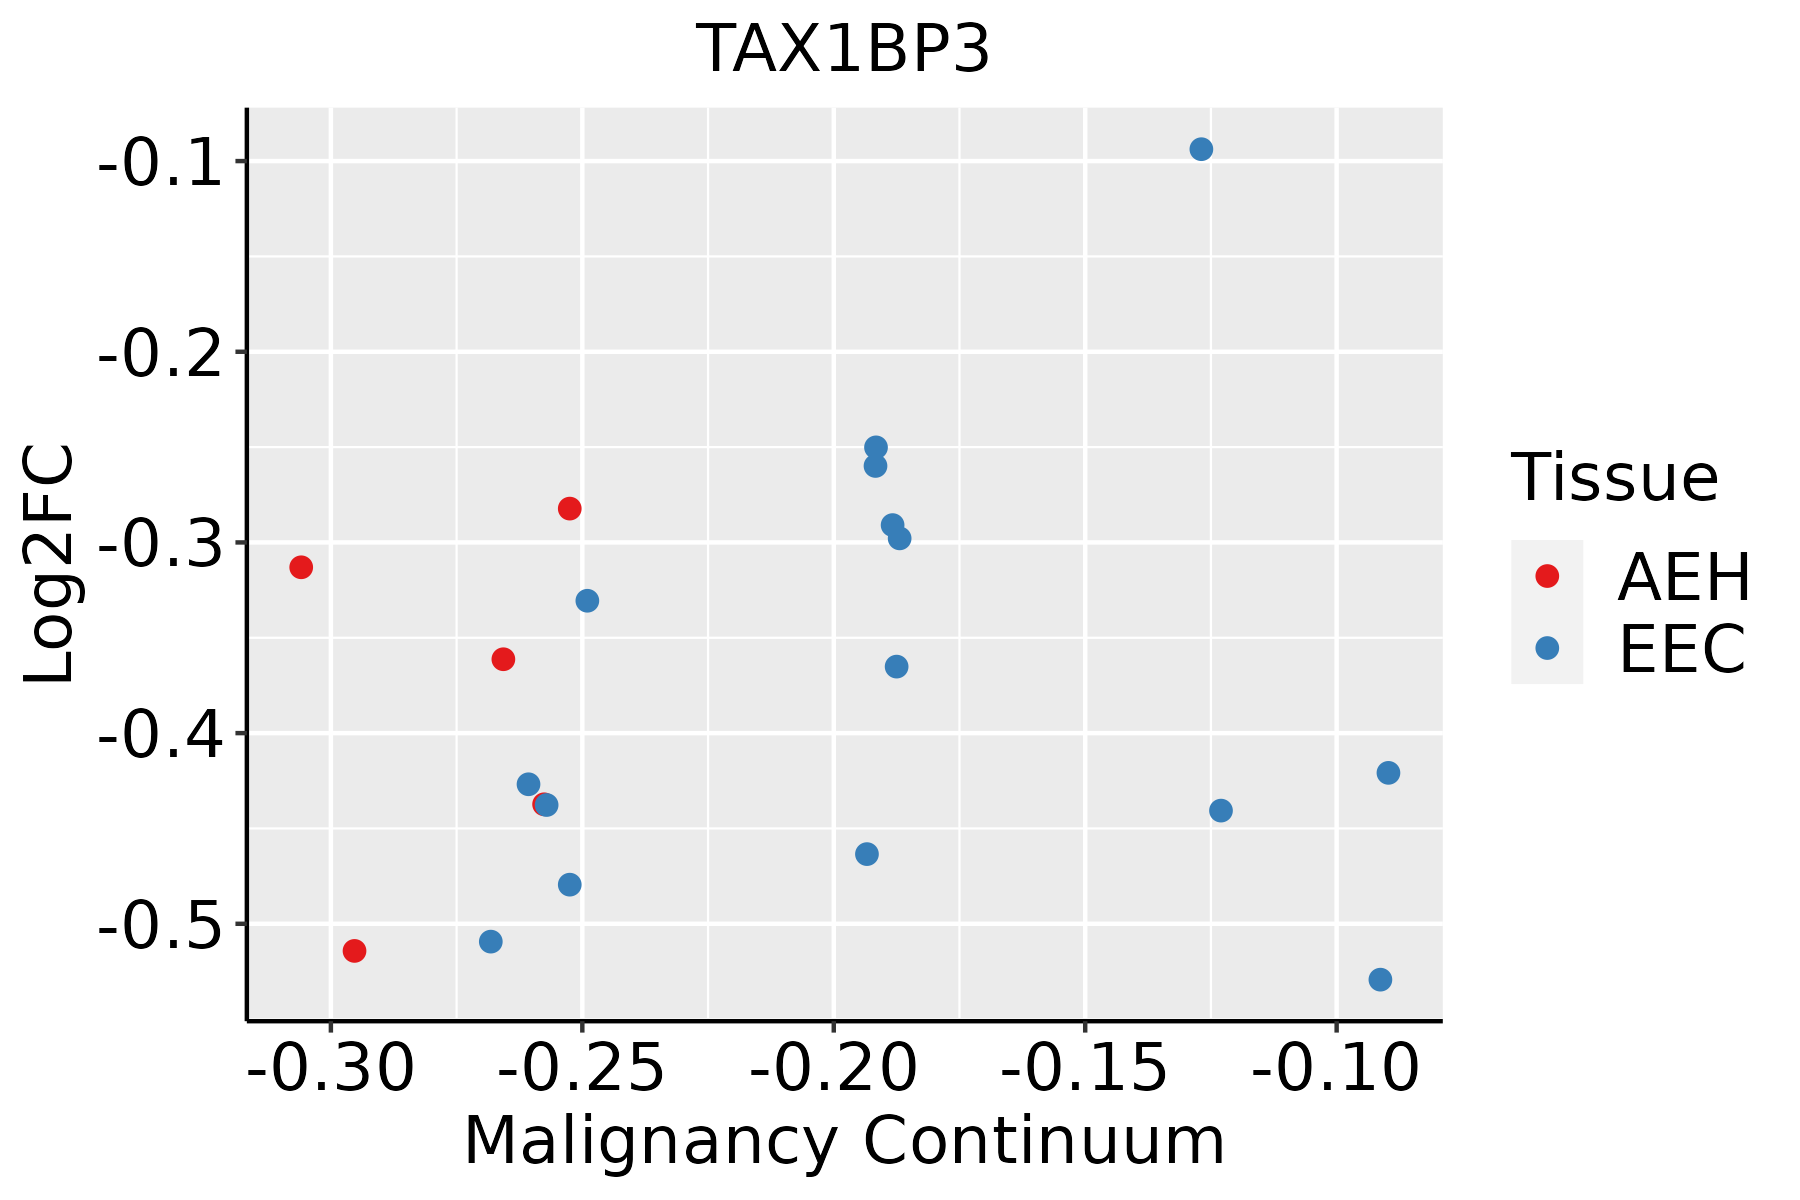 | AEH: Atypical endometrial hyperplasia |
| EEC: Endometrioid Cancer | ||
| Esophagus |  | ESCC: Esophageal squamous cell carcinoma |
| HGIN: High-grade intraepithelial neoplasias | ||
| LGIN: Low-grade intraepithelial neoplasias | ||
| GC |  | CAG: Chronic atrophic gastritis |
| CAG with IM: Chronic atrophic gastritis with intestinal metaplasia | ||
| CSG: Chronic superficial gastritis | ||
| GC: Gastric cancer | ||
| SIM: Severe intestinal metaplasia | ||
| WIM: Wild intestinal metaplasia | ||
| Oral Cavity |  | EOLP: Erosive Oral lichen planus |
| LP: leukoplakia | ||
| NEOLP: Non-erosive oral lichen planus | ||
| OSCC: Oral squamous cell carcinoma | ||
| Prostate |  | BPH: Benign Prostatic Hyperplasia |
| Skin |  | AK: Actinic keratosis |
| cSCC: Cutaneous squamous cell carcinoma | ||
| SCCIS:squamous cell carcinoma in situ | ||
| Thyroid | 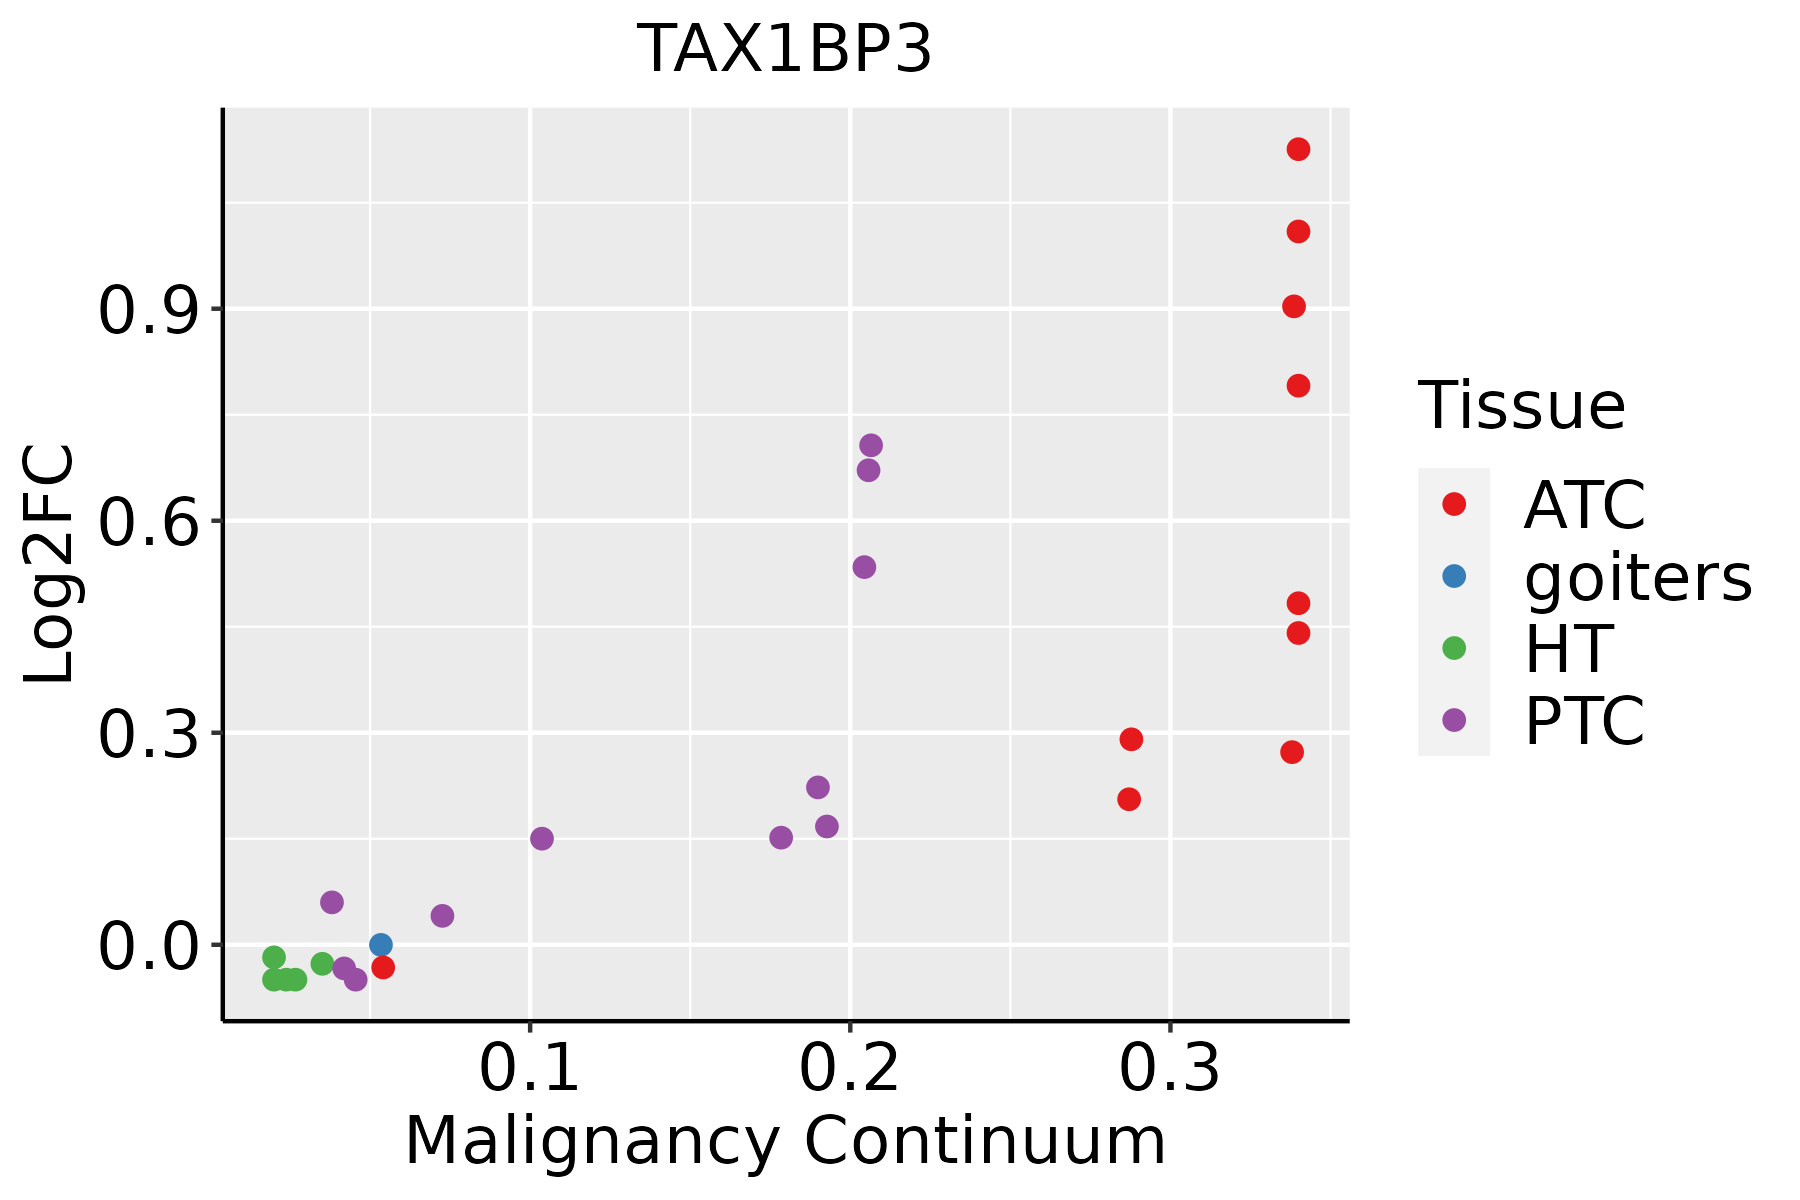 | ATC: Anaplastic thyroid cancer |
| HT: Hashimoto's thyroiditis | ||
| PTC: Papillary thyroid cancer |
| ∗log2FC in expression of this searched gene in stem-like cells from each diseased tissue sample relative to stem-like cells in normal samples in each tissue plotted against the malignancy continuum. Samples are colored based on if they are from different disease stage. |
Top |
Malignant transformation related pathway analysis |
| Find out the enriched GO biological processes and KEGG pathways involved in transition from healthy to precancer to cancer |
| Tissue | Disease Stage | Enriched GO biological Processes |
| Colorectum | AD |  |
| Colorectum | SER |  |
| Colorectum | MSS |  |
| Colorectum | MSI-H |  |
| Colorectum | FAP |  |
| ∗Top 15 enriched GO BP terms are showed in the bar plot of each disease state in each tissue. Each row represents a significant GO biological process which is colored according to the -log10(p.adjust). |
| Page: 1 2 3 4 5 6 7 8 9 |
| GO ID | Tissue | Disease Stage | Description | Gene Ratio | Bg Ratio | pvalue | p.adjust | Count |
| GO:0043087 | Colorectum | AD | regulation of GTPase activity | 110/3918 | 348/18723 | 1.64e-06 | 5.03e-05 | 110 |
| GO:0030111 | Colorectum | AD | regulation of Wnt signaling pathway | 102/3918 | 328/18723 | 8.51e-06 | 2.03e-04 | 102 |
| GO:0007265 | Colorectum | AD | Ras protein signal transduction | 104/3918 | 337/18723 | 1.01e-05 | 2.35e-04 | 104 |
| GO:0016055 | Colorectum | AD | Wnt signaling pathway | 130/3918 | 444/18723 | 1.60e-05 | 3.37e-04 | 130 |
| GO:0198738 | Colorectum | AD | cell-cell signaling by wnt | 130/3918 | 446/18723 | 2.02e-05 | 4.10e-04 | 130 |
| GO:0043547 | Colorectum | AD | positive regulation of GTPase activity | 75/3918 | 255/18723 | 7.95e-04 | 7.91e-03 | 75 |
| GO:1903828 | Colorectum | AD | negative regulation of cellular protein localization | 39/3918 | 117/18723 | 1.18e-03 | 1.06e-02 | 39 |
| GO:0034394 | Colorectum | AD | protein localization to cell surface | 24/3918 | 68/18723 | 4.33e-03 | 2.97e-02 | 24 |
| GO:0007266 | Colorectum | AD | Rho protein signal transduction | 42/3918 | 137/18723 | 4.64e-03 | 3.16e-02 | 42 |
| GO:2000009 | Colorectum | AD | negative regulation of protein localization to cell surface | 7/3918 | 12/18723 | 5.09e-03 | 3.38e-02 | 7 |
| GO:00160551 | Colorectum | SER | Wnt signaling pathway | 97/2897 | 444/18723 | 2.02e-04 | 3.68e-03 | 97 |
| GO:01987381 | Colorectum | SER | cell-cell signaling by wnt | 97/2897 | 446/18723 | 2.39e-04 | 4.11e-03 | 97 |
| GO:00301111 | Colorectum | SER | regulation of Wnt signaling pathway | 75/2897 | 328/18723 | 2.47e-04 | 4.20e-03 | 75 |
| GO:00430871 | Colorectum | SER | regulation of GTPase activity | 77/2897 | 348/18723 | 5.90e-04 | 8.07e-03 | 77 |
| GO:19038281 | Colorectum | SER | negative regulation of cellular protein localization | 30/2897 | 117/18723 | 2.96e-03 | 2.62e-02 | 30 |
| GO:20000091 | Colorectum | SER | negative regulation of protein localization to cell surface | 6/2897 | 12/18723 | 5.42e-03 | 4.03e-02 | 6 |
| GO:00301112 | Colorectum | MSS | regulation of Wnt signaling pathway | 98/3467 | 328/18723 | 3.37e-07 | 1.36e-05 | 98 |
| GO:00160552 | Colorectum | MSS | Wnt signaling pathway | 124/3467 | 444/18723 | 6.06e-07 | 2.26e-05 | 124 |
| GO:01987382 | Colorectum | MSS | cell-cell signaling by wnt | 124/3467 | 446/18723 | 7.83e-07 | 2.77e-05 | 124 |
| GO:00430872 | Colorectum | MSS | regulation of GTPase activity | 101/3467 | 348/18723 | 1.00e-06 | 3.46e-05 | 101 |
| Page: 1 2 3 4 5 6 |
| Pathway ID | Tissue | Disease Stage | Description | Gene Ratio | Bg Ratio | pvalue | p.adjust | qvalue | Count |
| Page: 1 |
Top |
Cell-cell communication analysis |
| Identification of potential cell-cell interactions between two cell types and their ligand-receptor pairs for different disease states |
| Ligand | Receptor | LRpair | Pathway | Tissue | Disease Stage |
| Page: 1 |
Top |
Single-cell gene regulatory network inference analysis |
| Find out the significant the regulons (TFs) and the target genes of each regulon across cell types for different disease states |
| TF | Cell Type | Tissue | Disease Stage | Target Gene | RSS | Regulon Activity |
| ∗The dot plots of a searched regulon are shown for all cell subpopulations in each disease state of each tissue based on the regulon specific score inferred using pySCENIC and by calculating the average expression. |
| Page: 1 |
Top |
Somatic mutation of malignant transformation related genes |
| Annotation of somatic variants for genes involved in malignant transformation |
| Hugo Symbol | Variant Class | Variant Classification | dbSNP RS | HGVSc | HGVSp | HGVSp Short | SWISSPROT | BIOTYPE | SIFT | PolyPhen | Tumor Sample Barcode | Tissue | Histology | Sex | Age | Stage | Therapy Types | Drugs | Outcome |
| TAX1BP3 | SNV | Missense_Mutation | rs747198869 | c.332G>A | p.Arg111Gln | p.R111Q | O14907 | protein_coding | deleterious(0.04) | probably_damaging(0.999) | TCGA-AJ-A8CW-01 | Endometrium | uterine corpus endometrioid carcinoma | Female | <65 | I/II | Unknown | Unknown | SD |
| TAX1BP3 | SNV | Missense_Mutation | rs757649179 | c.281N>A | p.Arg94His | p.R94H | O14907 | protein_coding | deleterious(0.03) | probably_damaging(0.91) | TCGA-AP-A1DV-01 | Endometrium | uterine corpus endometrioid carcinoma | Female | <65 | I/II | Unknown | Unknown | SD |
| TAX1BP3 | SNV | Missense_Mutation | novel | c.109A>C | p.Ile37Leu | p.I37L | O14907 | protein_coding | tolerated(0.07) | probably_damaging(0.992) | TCGA-AX-A06F-01 | Endometrium | uterine corpus endometrioid carcinoma | Female | <65 | III/IV | Chemotherapy | carboplatin | SD |
| TAX1BP3 | SNV | Missense_Mutation | rs117575113 | c.65N>A | p.Arg22His | p.R22H | O14907 | protein_coding | tolerated(0.36) | benign(0) | TCGA-AX-A1C9-01 | Endometrium | uterine corpus endometrioid carcinoma | Female | >=65 | I/II | Unknown | Unknown | SD |
| TAX1BP3 | SNV | Missense_Mutation | rs757649179 | c.281G>A | p.Arg94His | p.R94H | O14907 | protein_coding | deleterious(0.03) | probably_damaging(0.91) | TCGA-B5-A3FC-01 | Endometrium | uterine corpus endometrioid carcinoma | Female | <65 | I/II | Unknown | Unknown | SD |
| TAX1BP3 | SNV | Missense_Mutation | novel | c.178N>A | p.Val60Met | p.V60M | O14907 | protein_coding | deleterious(0) | probably_damaging(0.968) | TCGA-BG-A222-01 | Endometrium | uterine corpus endometrioid carcinoma | Female | <65 | I/II | Unknown | Unknown | SD |
| TAX1BP3 | SNV | Missense_Mutation | novel | c.193C>A | p.Pro65Thr | p.P65T | O14907 | protein_coding | deleterious(0) | probably_damaging(0.996) | TCGA-05-4396-01 | Lung | lung adenocarcinoma | Male | >=65 | III/IV | Unknown | Unknown | SD |
| TAX1BP3 | SNV | Missense_Mutation | c.139N>C | p.Ser47Pro | p.S47P | O14907 | protein_coding | tolerated(0.12) | benign(0.007) | TCGA-49-AARN-01 | Lung | lung adenocarcinoma | Female | <65 | I/II | Unknown | Unknown | SD | |
| TAX1BP3 | SNV | Missense_Mutation | rs754753363 | c.107G>C | p.Gly36Ala | p.G36A | O14907 | protein_coding | deleterious(0.02) | probably_damaging(0.999) | TCGA-KU-A66S-01 | Oral cavity | head & neck squamous cell carcinoma | Female | >=65 | III/IV | Unknown | Unknown | PD |
| TAX1BP3 | SNV | Missense_Mutation | c.244N>A | p.Gly82Ser | p.G82S | O14907 | protein_coding | deleterious(0) | probably_damaging(0.981) | TCGA-BR-8361-01 | Stomach | stomach adenocarcinoma | Female | >=65 | III/IV | Unknown | Unknown | SD |
| Page: 1 2 |
Top |
Related drugs of malignant transformation related genes |
| Identification of chemicals and drugs interact with genes involved in malignant transfromation |
| (DGIdb 4.0) |
| Entrez ID | Symbol | Category | Interaction Types | Drug Claim Name | Drug Name | PMIDs |
| Page: 1 |

Copyright 2023-Present -The University of Texas Health Science Center at Houston |