
|
|||||
|
 | |
| |
| |
| |
| |
| |
|
Gene: TATDN3 |
Gene summary for TATDN3 |
| Gene information | Species | Human | Gene symbol | TATDN3 | Gene ID | 128387 |
| Gene name | TatD DNase domain containing 3 | |
| Gene Alias | TATDN3 | |
| Cytomap | 1q32.3 | |
| Gene Type | protein-coding | GO ID | GO:0006139 | UniProtAcc | Q17R31 |
Top |
Malignant transformation analysis |
| Identification of the aberrant gene expression in precancerous and cancerous lesions by comparing the gene expression of stem-like cells in diseased tissues with normal stem cells |
| Entrez ID | Symbol | Replicates | Species | Organ | Tissue | Adj P-value | Log2FC | Malignancy |
| 128387 | TATDN3 | LZE22T | Human | Esophagus | ESCC | 2.31e-02 | 2.49e-01 | 0.068 |
| 128387 | TATDN3 | LZE24T | Human | Esophagus | ESCC | 7.49e-09 | 1.81e-01 | 0.0596 |
| 128387 | TATDN3 | P1T-E | Human | Esophagus | ESCC | 2.17e-03 | 2.82e-01 | 0.0875 |
| 128387 | TATDN3 | P2T-E | Human | Esophagus | ESCC | 5.45e-21 | 2.76e-01 | 0.1177 |
| 128387 | TATDN3 | P4T-E | Human | Esophagus | ESCC | 7.45e-08 | 2.04e-01 | 0.1323 |
| 128387 | TATDN3 | P5T-E | Human | Esophagus | ESCC | 1.11e-14 | 2.09e-01 | 0.1327 |
| 128387 | TATDN3 | P8T-E | Human | Esophagus | ESCC | 5.08e-08 | 6.37e-02 | 0.0889 |
| 128387 | TATDN3 | P9T-E | Human | Esophagus | ESCC | 2.56e-07 | 1.18e-01 | 0.1131 |
| 128387 | TATDN3 | P10T-E | Human | Esophagus | ESCC | 3.19e-04 | 1.16e-01 | 0.116 |
| 128387 | TATDN3 | P11T-E | Human | Esophagus | ESCC | 1.81e-10 | 2.63e-01 | 0.1426 |
| 128387 | TATDN3 | P12T-E | Human | Esophagus | ESCC | 6.43e-16 | 1.78e-01 | 0.1122 |
| 128387 | TATDN3 | P15T-E | Human | Esophagus | ESCC | 8.79e-15 | 2.90e-01 | 0.1149 |
| 128387 | TATDN3 | P16T-E | Human | Esophagus | ESCC | 2.50e-17 | 3.44e-01 | 0.1153 |
| 128387 | TATDN3 | P17T-E | Human | Esophagus | ESCC | 1.06e-03 | 1.59e-01 | 0.1278 |
| 128387 | TATDN3 | P19T-E | Human | Esophagus | ESCC | 5.06e-04 | 4.04e-01 | 0.1662 |
| 128387 | TATDN3 | P20T-E | Human | Esophagus | ESCC | 5.73e-14 | 2.01e-01 | 0.1124 |
| 128387 | TATDN3 | P21T-E | Human | Esophagus | ESCC | 2.48e-16 | 2.75e-01 | 0.1617 |
| 128387 | TATDN3 | P22T-E | Human | Esophagus | ESCC | 1.27e-14 | 2.26e-01 | 0.1236 |
| 128387 | TATDN3 | P23T-E | Human | Esophagus | ESCC | 1.91e-14 | 3.44e-01 | 0.108 |
| 128387 | TATDN3 | P24T-E | Human | Esophagus | ESCC | 5.03e-08 | 1.99e-01 | 0.1287 |
| Page: 1 2 3 4 |
| Tissue | Expression Dynamics | Abbreviation |
| Esophagus | 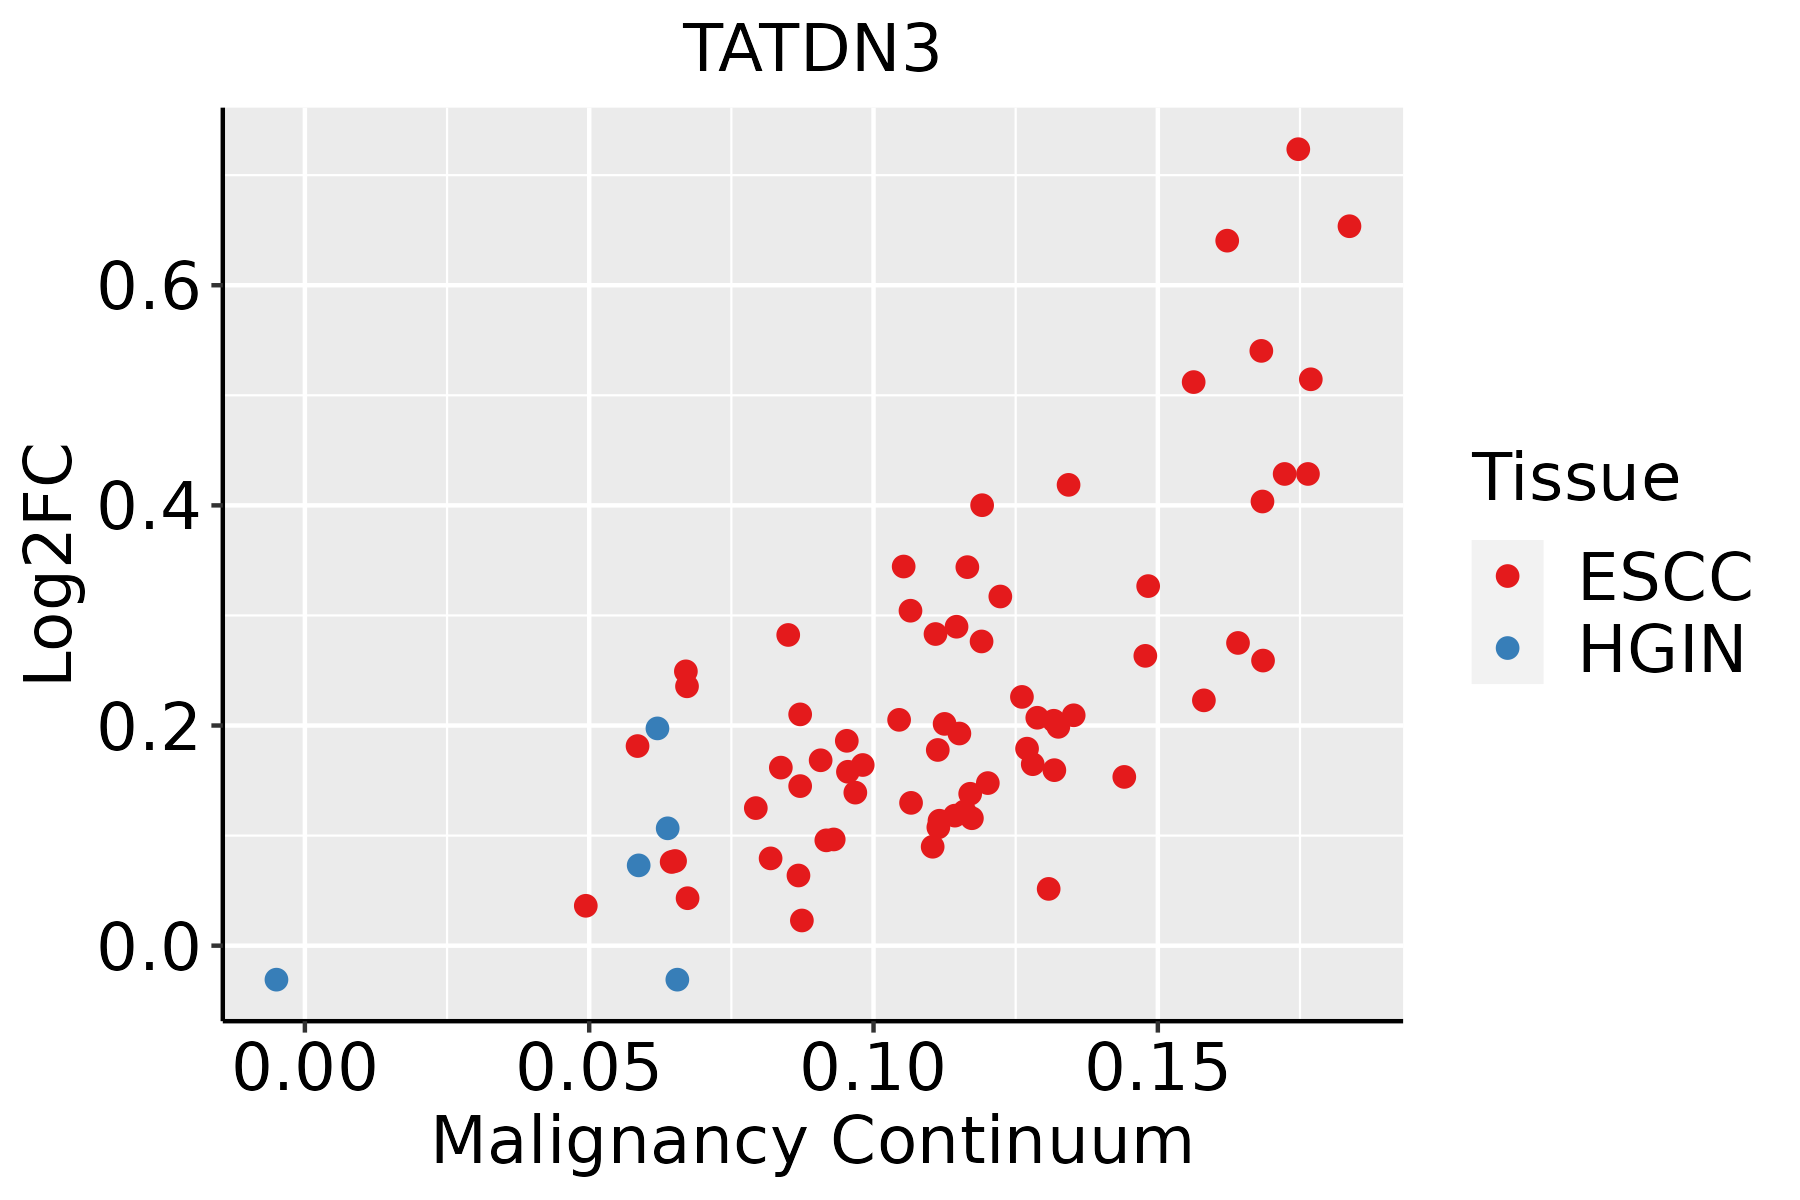 | ESCC: Esophageal squamous cell carcinoma |
| HGIN: High-grade intraepithelial neoplasias | ||
| LGIN: Low-grade intraepithelial neoplasias | ||
| Liver | 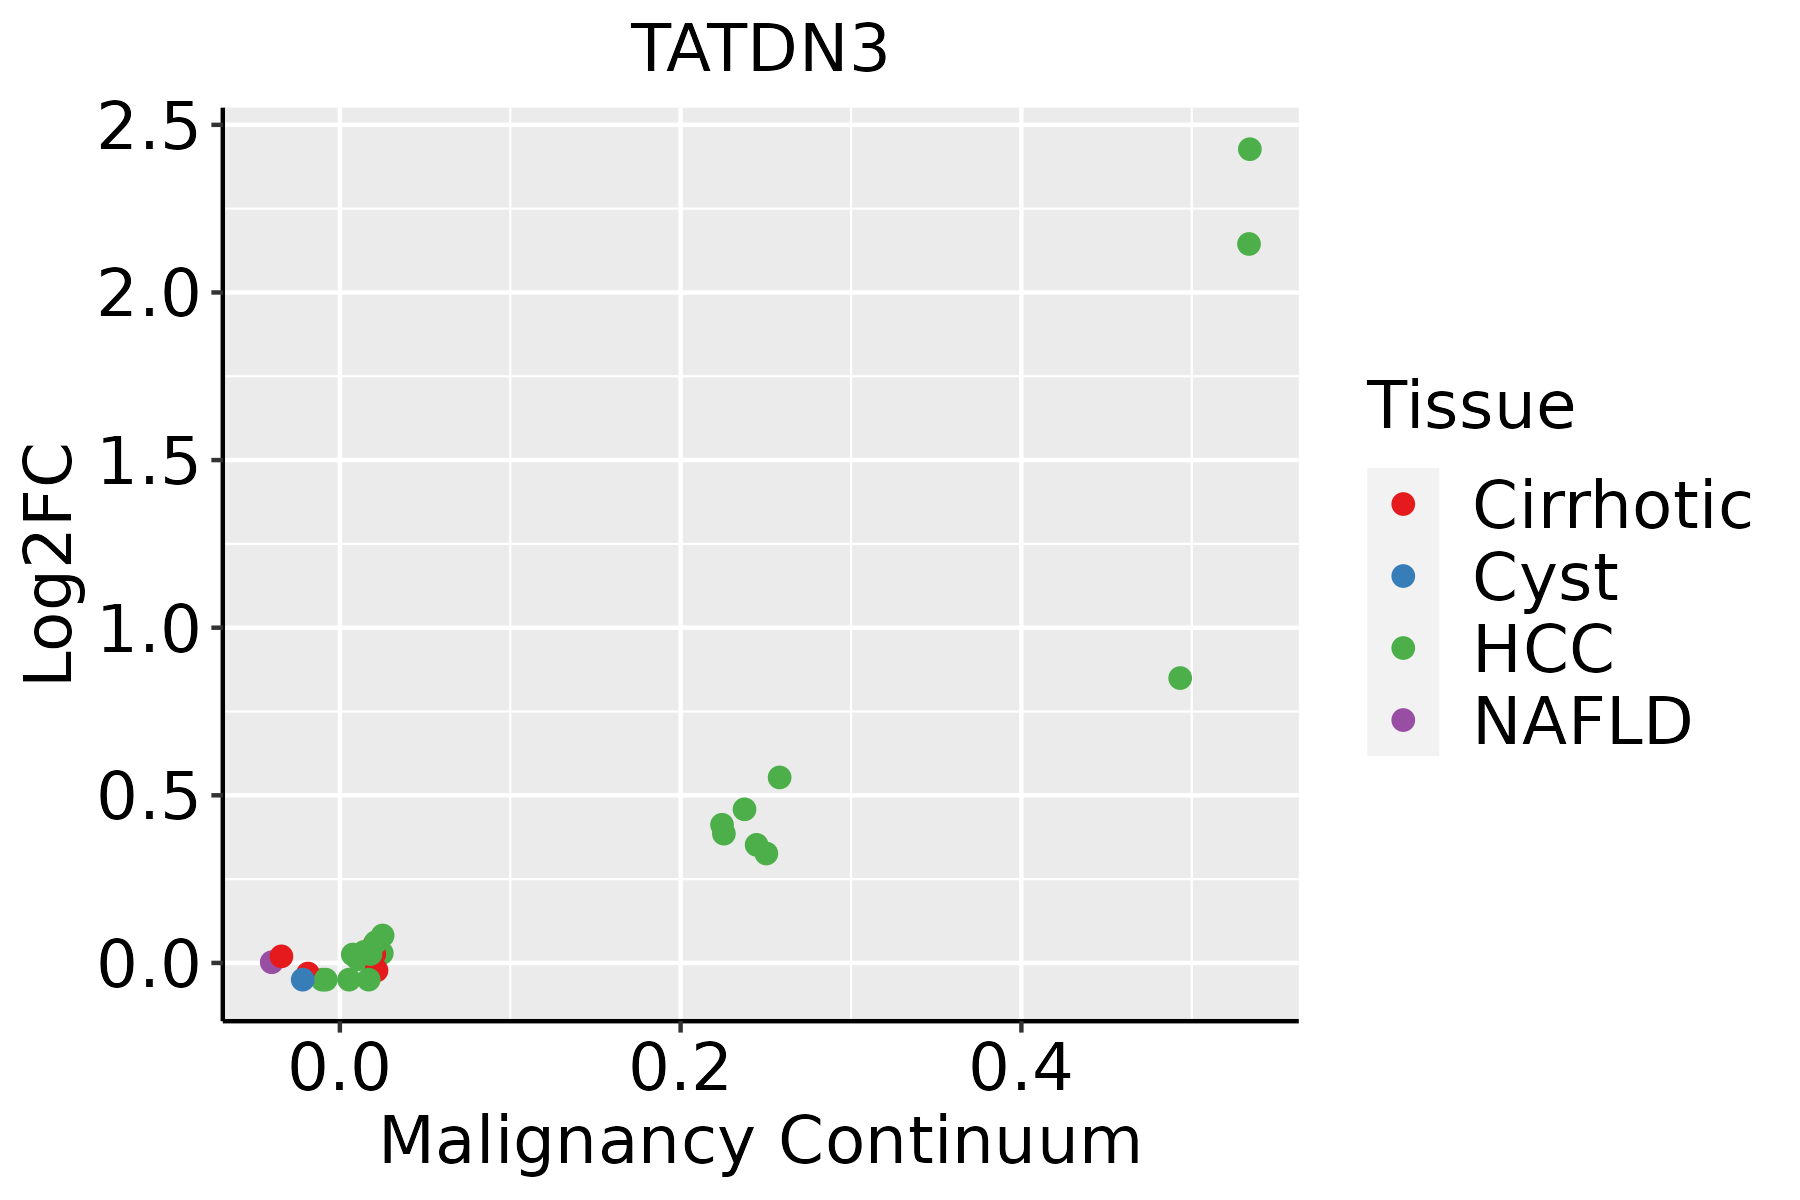 | HCC: Hepatocellular carcinoma |
| NAFLD: Non-alcoholic fatty liver disease | ||
| Oral Cavity |  | EOLP: Erosive Oral lichen planus |
| LP: leukoplakia | ||
| NEOLP: Non-erosive oral lichen planus | ||
| OSCC: Oral squamous cell carcinoma |
| ∗log2FC in expression of this searched gene in stem-like cells from each diseased tissue sample relative to stem-like cells in normal samples in each tissue plotted against the malignancy continuum. Samples are colored based on if they are from different disease stage. |
Top |
Malignant transformation related pathway analysis |
| Find out the enriched GO biological processes and KEGG pathways involved in transition from healthy to precancer to cancer |
| Tissue | Disease Stage | Enriched GO biological Processes |
| Colorectum | AD |  |
| Colorectum | SER |  |
| Colorectum | MSS |  |
| Colorectum | MSI-H |  |
| Colorectum | FAP |  |
| ∗Top 15 enriched GO BP terms are showed in the bar plot of each disease state in each tissue. Each row represents a significant GO biological process which is colored according to the -log10(p.adjust). |
| Page: 1 2 3 4 5 6 7 8 9 |
| GO ID | Tissue | Disease Stage | Description | Gene Ratio | Bg Ratio | pvalue | p.adjust | Count |
| GO:00903053 | Esophagus | ESCC | nucleic acid phosphodiester bond hydrolysis | 163/8552 | 261/18723 | 3.07e-08 | 5.73e-07 | 163 |
| GO:0090305 | Liver | HCC | nucleic acid phosphodiester bond hydrolysis | 152/7958 | 261/18723 | 1.90e-07 | 3.46e-06 | 152 |
| GO:00903052 | Oral cavity | OSCC | nucleic acid phosphodiester bond hydrolysis | 142/7305 | 261/18723 | 2.90e-07 | 4.43e-06 | 142 |
| Page: 1 |
| Pathway ID | Tissue | Disease Stage | Description | Gene Ratio | Bg Ratio | pvalue | p.adjust | qvalue | Count |
| Page: 1 |
Top |
Cell-cell communication analysis |
| Identification of potential cell-cell interactions between two cell types and their ligand-receptor pairs for different disease states |
| Ligand | Receptor | LRpair | Pathway | Tissue | Disease Stage |
| Page: 1 |
Top |
Single-cell gene regulatory network inference analysis |
| Find out the significant the regulons (TFs) and the target genes of each regulon across cell types for different disease states |
| TF | Cell Type | Tissue | Disease Stage | Target Gene | RSS | Regulon Activity |
| ∗The dot plots of a searched regulon are shown for all cell subpopulations in each disease state of each tissue based on the regulon specific score inferred using pySCENIC and by calculating the average expression. |
| Page: 1 |
Top |
Somatic mutation of malignant transformation related genes |
| Annotation of somatic variants for genes involved in malignant transformation |
| Hugo Symbol | Variant Class | Variant Classification | dbSNP RS | HGVSc | HGVSp | HGVSp Short | SWISSPROT | BIOTYPE | SIFT | PolyPhen | Tumor Sample Barcode | Tissue | Histology | Sex | Age | Stage | Therapy Types | Drugs | Outcome |
| TATDN3 | SNV | Missense_Mutation | rs761487531 | c.426N>C | p.Leu142Phe | p.L142F | Q17R31 | protein_coding | deleterious(0) | probably_damaging(0.988) | TCGA-A7-A6VY-01 | Breast | breast invasive carcinoma | Female | <65 | I/II | Chemotherapy | cyclophosphamide | CR |
| TATDN3 | SNV | Missense_Mutation | c.185N>G | p.Phe62Cys | p.F62C | Q17R31 | protein_coding | deleterious(0.02) | probably_damaging(0.96) | TCGA-AO-A0J2-01 | Breast | breast invasive carcinoma | Female | <65 | I/II | Chemotherapy | cyclophosphamide | SD | |
| TATDN3 | SNV | Missense_Mutation | novel | c.610C>G | p.Leu204Val | p.L204V | Q17R31 | protein_coding | tolerated_low_confidence(0.38) | benign(0.003) | TCGA-D8-A1J9-01 | Breast | breast invasive carcinoma | Female | <65 | I/II | Unknown | Unknown | SD |
| TATDN3 | SNV | Missense_Mutation | c.73G>A | p.Asp25Asn | p.D25N | Q17R31 | protein_coding | tolerated(0.15) | possibly_damaging(0.528) | TCGA-D8-A1XQ-01 | Breast | breast invasive carcinoma | Female | >=65 | I/II | Unknown | Unknown | SD | |
| TATDN3 | SNV | Missense_Mutation | novel | c.610N>G | p.Leu204Val | p.L204V | Q17R31 | protein_coding | tolerated_low_confidence(0.38) | benign(0.003) | TCGA-EK-A2H0-01 | Cervix | cervical & endocervical cancer | Female | <65 | I/II | Chemotherapy | cisplatin | CR |
| TATDN3 | SNV | Missense_Mutation | novel | c.610N>G | p.Leu204Val | p.L204V | Q17R31 | protein_coding | tolerated_low_confidence(0.38) | benign(0.003) | TCGA-ZJ-A8QQ-01 | Cervix | cervical & endocervical cancer | Female | <65 | I/II | Chemotherapy | cisplatin | SD |
| TATDN3 | SNV | Missense_Mutation | novel | c.288G>T | p.Glu96Asp | p.E96D | Q17R31 | protein_coding | tolerated(0.13) | benign(0.005) | TCGA-AA-A00N-01 | Colorectum | colon adenocarcinoma | Male | >=65 | I/II | Unknown | Unknown | PD |
| TATDN3 | SNV | Missense_Mutation | c.803C>T | p.Ala268Val | p.A268V | Q17R31 | protein_coding | deleterious(0.02) | probably_damaging(0.972) | TCGA-AA-A00N-01 | Colorectum | colon adenocarcinoma | Male | >=65 | I/II | Unknown | Unknown | PD | |
| TATDN3 | SNV | Missense_Mutation | novel | c.205N>T | p.Val69Phe | p.V69F | Q17R31 | protein_coding | deleterious(0) | possibly_damaging(0.577) | TCGA-D5-6536-01 | Colorectum | colon adenocarcinoma | Male | >=65 | I/II | Chemotherapy | 5-fu | SD |
| TATDN3 | SNV | Missense_Mutation | c.10N>A | p.Ala4Thr | p.A4T | Q17R31 | protein_coding | tolerated_low_confidence(0.31) | benign(0.053) | TCGA-G4-6302-01 | Colorectum | colon adenocarcinoma | Female | >=65 | I/II | Unknown | Unknown | SD |
| Page: 1 2 3 4 |
Top |
Related drugs of malignant transformation related genes |
| Identification of chemicals and drugs interact with genes involved in malignant transfromation |
| (DGIdb 4.0) |
| Entrez ID | Symbol | Category | Interaction Types | Drug Claim Name | Drug Name | PMIDs |
| Page: 1 |

Copyright 2023-Present -The University of Texas Health Science Center at Houston |