
|
|||||
|
 | |
| |
| |
| |
| |
| |
|
Gene: TASP1 |
Gene summary for TASP1 |
| Gene information | Species | Human | Gene symbol | TASP1 | Gene ID | 55617 |
| Gene name | taspase 1 | |
| Gene Alias | C20orf13 | |
| Cytomap | 20p12.1 | |
| Gene Type | protein-coding | GO ID | GO:0006139 | UniProtAcc | Q9H6P5 |
Top |
Malignant transformation analysis |
| Identification of the aberrant gene expression in precancerous and cancerous lesions by comparing the gene expression of stem-like cells in diseased tissues with normal stem cells |
| Entrez ID | Symbol | Replicates | Species | Organ | Tissue | Adj P-value | Log2FC | Malignancy |
| 55617 | TASP1 | CCI_2 | Human | Cervix | CC | 2.70e-12 | 1.05e+00 | 0.5249 |
| 55617 | TASP1 | CCI_3 | Human | Cervix | CC | 7.56e-14 | 8.79e-01 | 0.516 |
| 55617 | TASP1 | sample1 | Human | Cervix | CC | 1.53e-02 | 3.27e-01 | 0.0959 |
| 55617 | TASP1 | T1 | Human | Cervix | CC | 5.78e-09 | 3.66e-01 | 0.0918 |
| 55617 | TASP1 | HTA11_3410_2000001011 | Human | Colorectum | AD | 4.39e-22 | -6.90e-01 | 0.0155 |
| 55617 | TASP1 | HTA11_2487_2000001011 | Human | Colorectum | SER | 2.63e-03 | -5.14e-01 | -0.1808 |
| 55617 | TASP1 | HTA11_2951_2000001011 | Human | Colorectum | AD | 1.49e-02 | -6.88e-01 | 0.0216 |
| 55617 | TASP1 | HTA11_1938_2000001011 | Human | Colorectum | AD | 2.84e-05 | -4.98e-01 | -0.0811 |
| 55617 | TASP1 | HTA11_2112_2000001011 | Human | Colorectum | SER | 1.62e-03 | -8.24e-01 | -0.2196 |
| 55617 | TASP1 | HTA11_3361_2000001011 | Human | Colorectum | AD | 3.61e-07 | -6.59e-01 | -0.1207 |
| 55617 | TASP1 | HTA11_83_2000001011 | Human | Colorectum | SER | 8.70e-06 | -4.37e-01 | -0.1526 |
| 55617 | TASP1 | HTA11_696_2000001011 | Human | Colorectum | AD | 1.47e-13 | -5.14e-01 | -0.1464 |
| 55617 | TASP1 | HTA11_866_2000001011 | Human | Colorectum | AD | 4.62e-09 | -4.25e-01 | -0.1001 |
| 55617 | TASP1 | HTA11_2992_2000001011 | Human | Colorectum | SER | 8.10e-03 | -7.05e-01 | -0.1706 |
| 55617 | TASP1 | HTA11_5212_2000001011 | Human | Colorectum | AD | 5.69e-05 | -7.31e-01 | -0.2061 |
| 55617 | TASP1 | HTA11_5216_2000001011 | Human | Colorectum | SER | 6.80e-04 | -7.17e-01 | -0.1462 |
| 55617 | TASP1 | HTA11_866_3004761011 | Human | Colorectum | AD | 4.27e-03 | -4.23e-01 | 0.096 |
| 55617 | TASP1 | HTA11_4255_2000001011 | Human | Colorectum | SER | 4.38e-03 | -3.61e-01 | 0.0446 |
| 55617 | TASP1 | HTA11_9408_2000001011 | Human | Colorectum | AD | 1.43e-02 | -8.08e-01 | 0.0451 |
| 55617 | TASP1 | HTA11_8622_2000001021 | Human | Colorectum | SER | 3.71e-03 | -6.61e-01 | 0.0528 |
| Page: 1 2 3 4 5 6 7 8 |
| Tissue | Expression Dynamics | Abbreviation |
| Cervix |  | CC: Cervix cancer |
| HSIL_HPV: HPV-infected high-grade squamous intraepithelial lesions | ||
| N_HPV: HPV-infected normal cervix | ||
| Colorectum (GSE201348) | 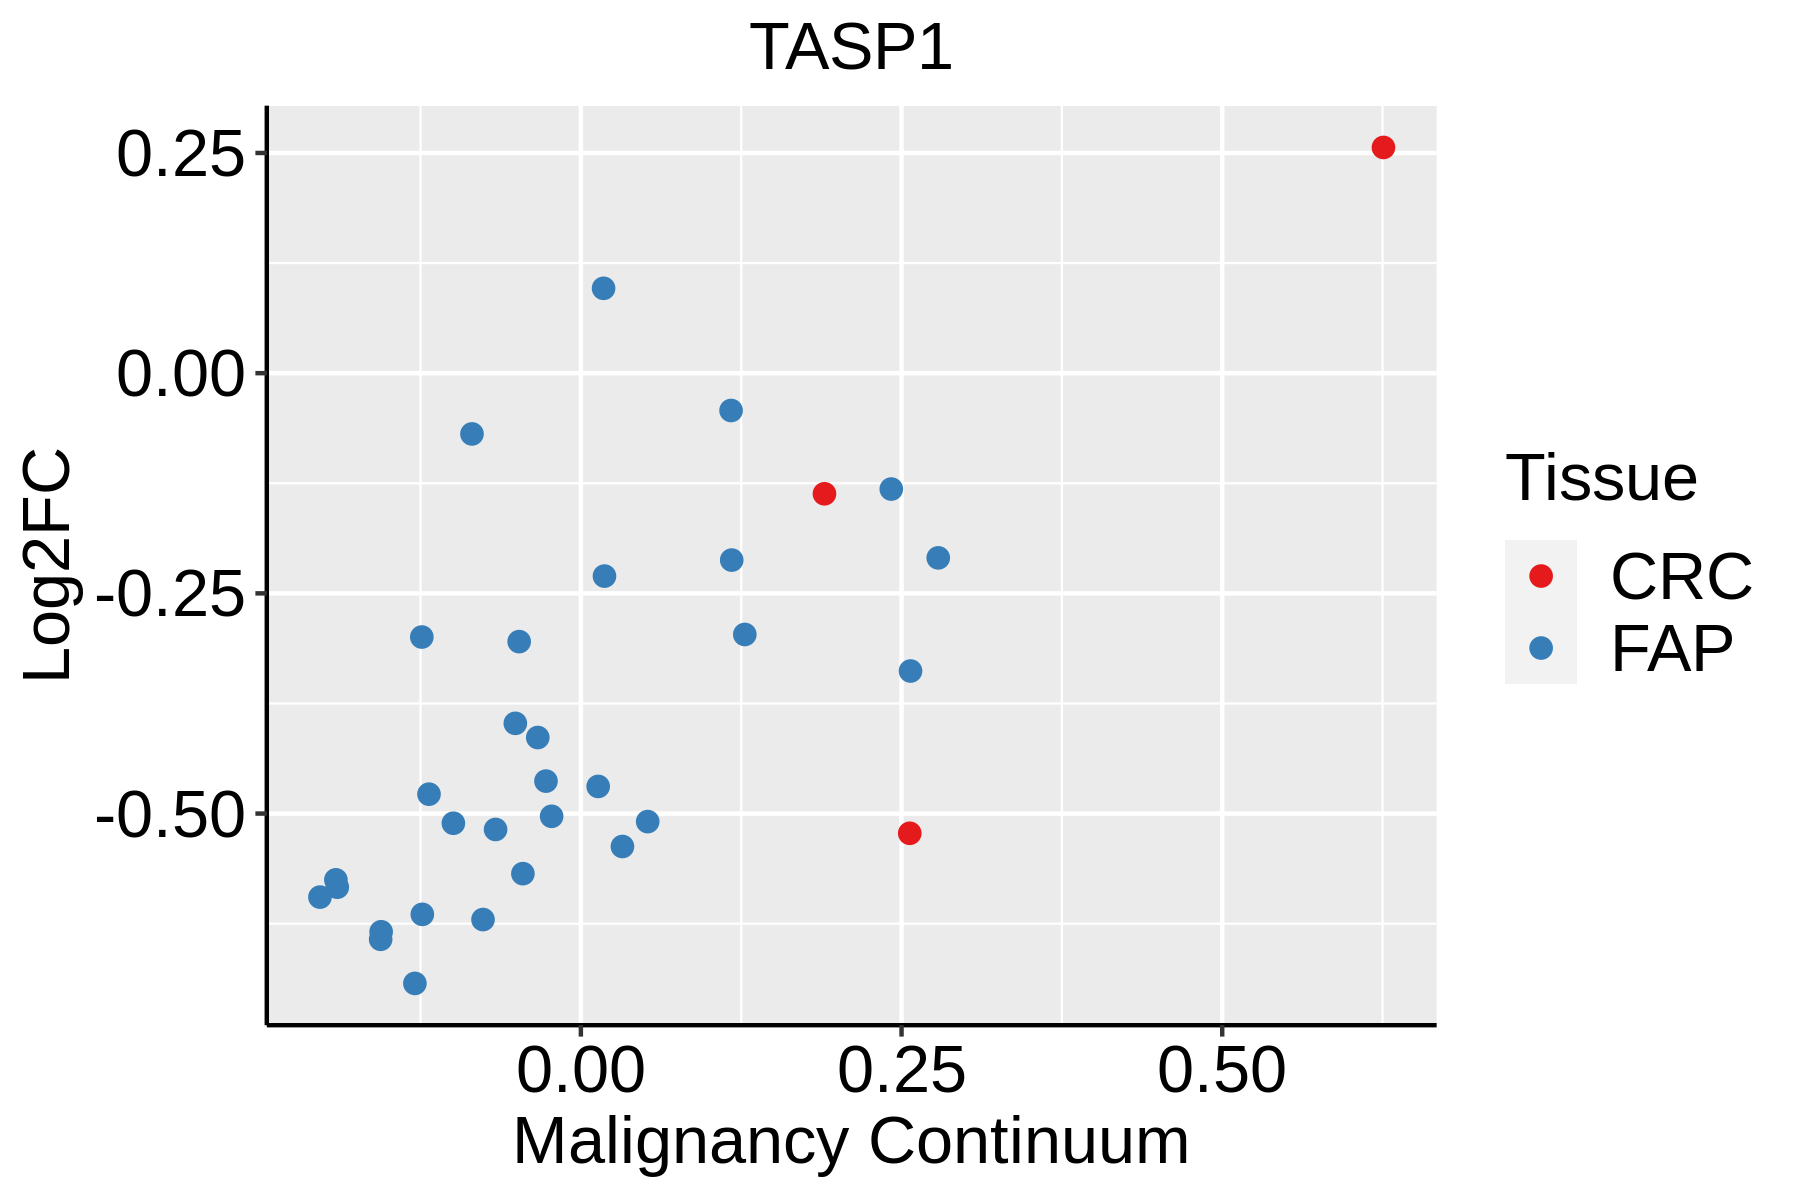 | FAP: Familial adenomatous polyposis |
| CRC: Colorectal cancer | ||
| Colorectum (HTA11) |  | AD: Adenomas |
| SER: Sessile serrated lesions | ||
| MSI-H: Microsatellite-high colorectal cancer | ||
| MSS: Microsatellite stable colorectal cancer | ||
| Esophagus | 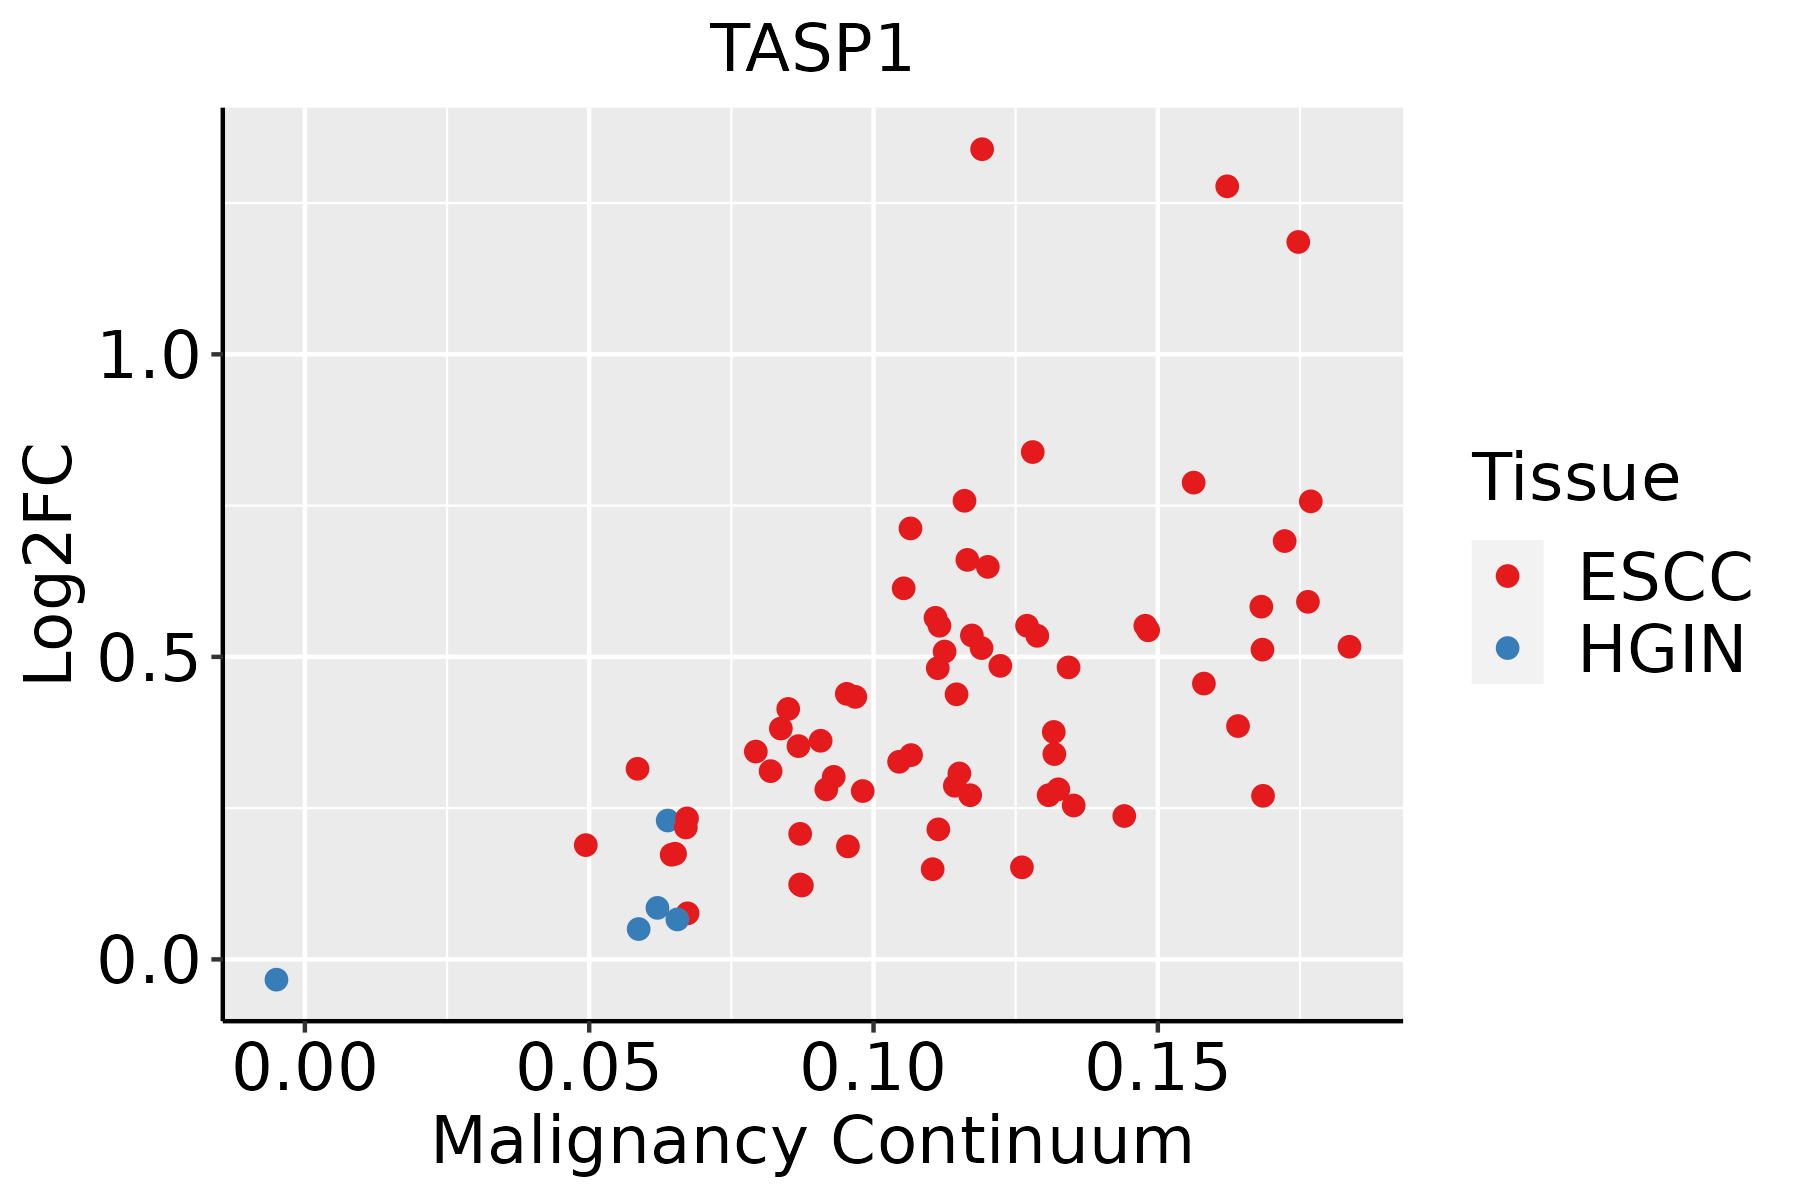 | ESCC: Esophageal squamous cell carcinoma |
| HGIN: High-grade intraepithelial neoplasias | ||
| LGIN: Low-grade intraepithelial neoplasias | ||
| Lung | 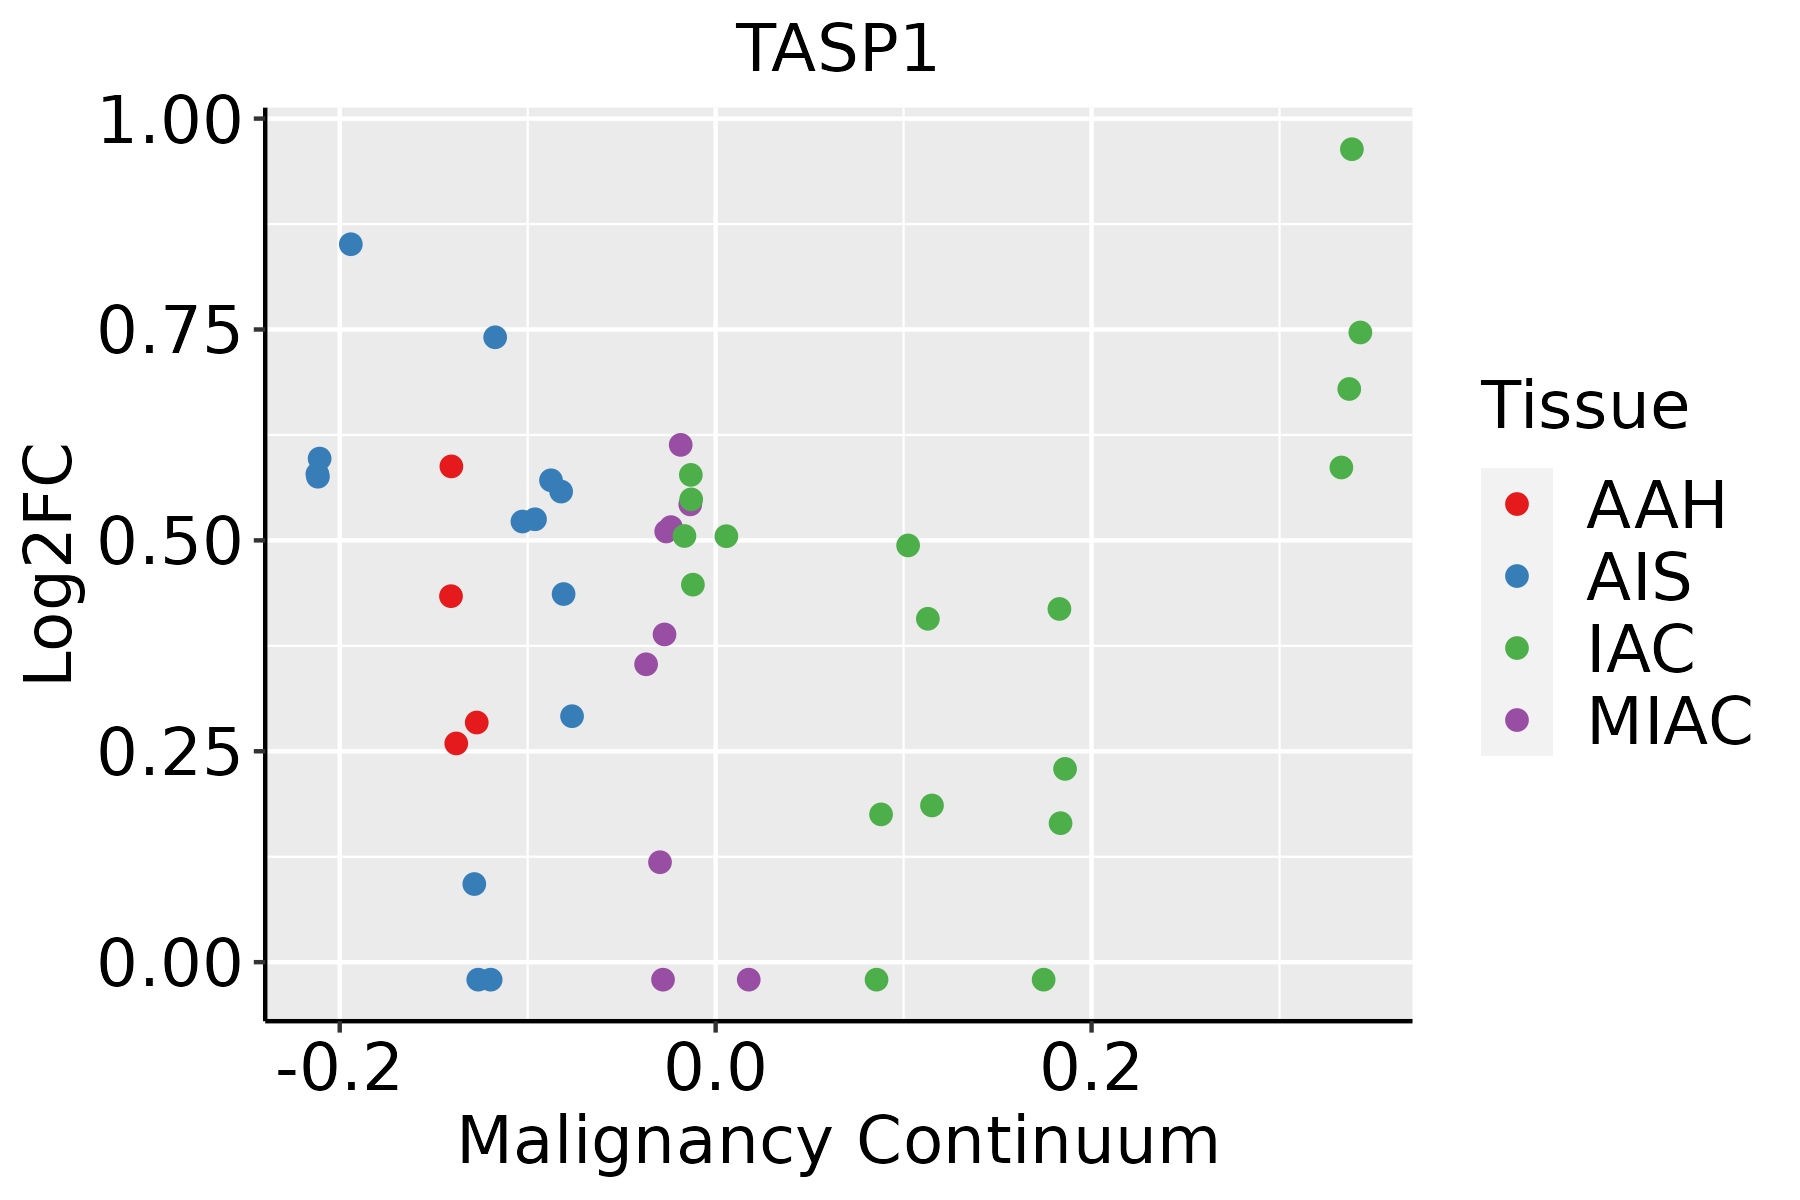 | AAH: Atypical adenomatous hyperplasia |
| AIS: Adenocarcinoma in situ | ||
| IAC: Invasive lung adenocarcinoma | ||
| MIA: Minimally invasive adenocarcinoma | ||
| Oral Cavity | 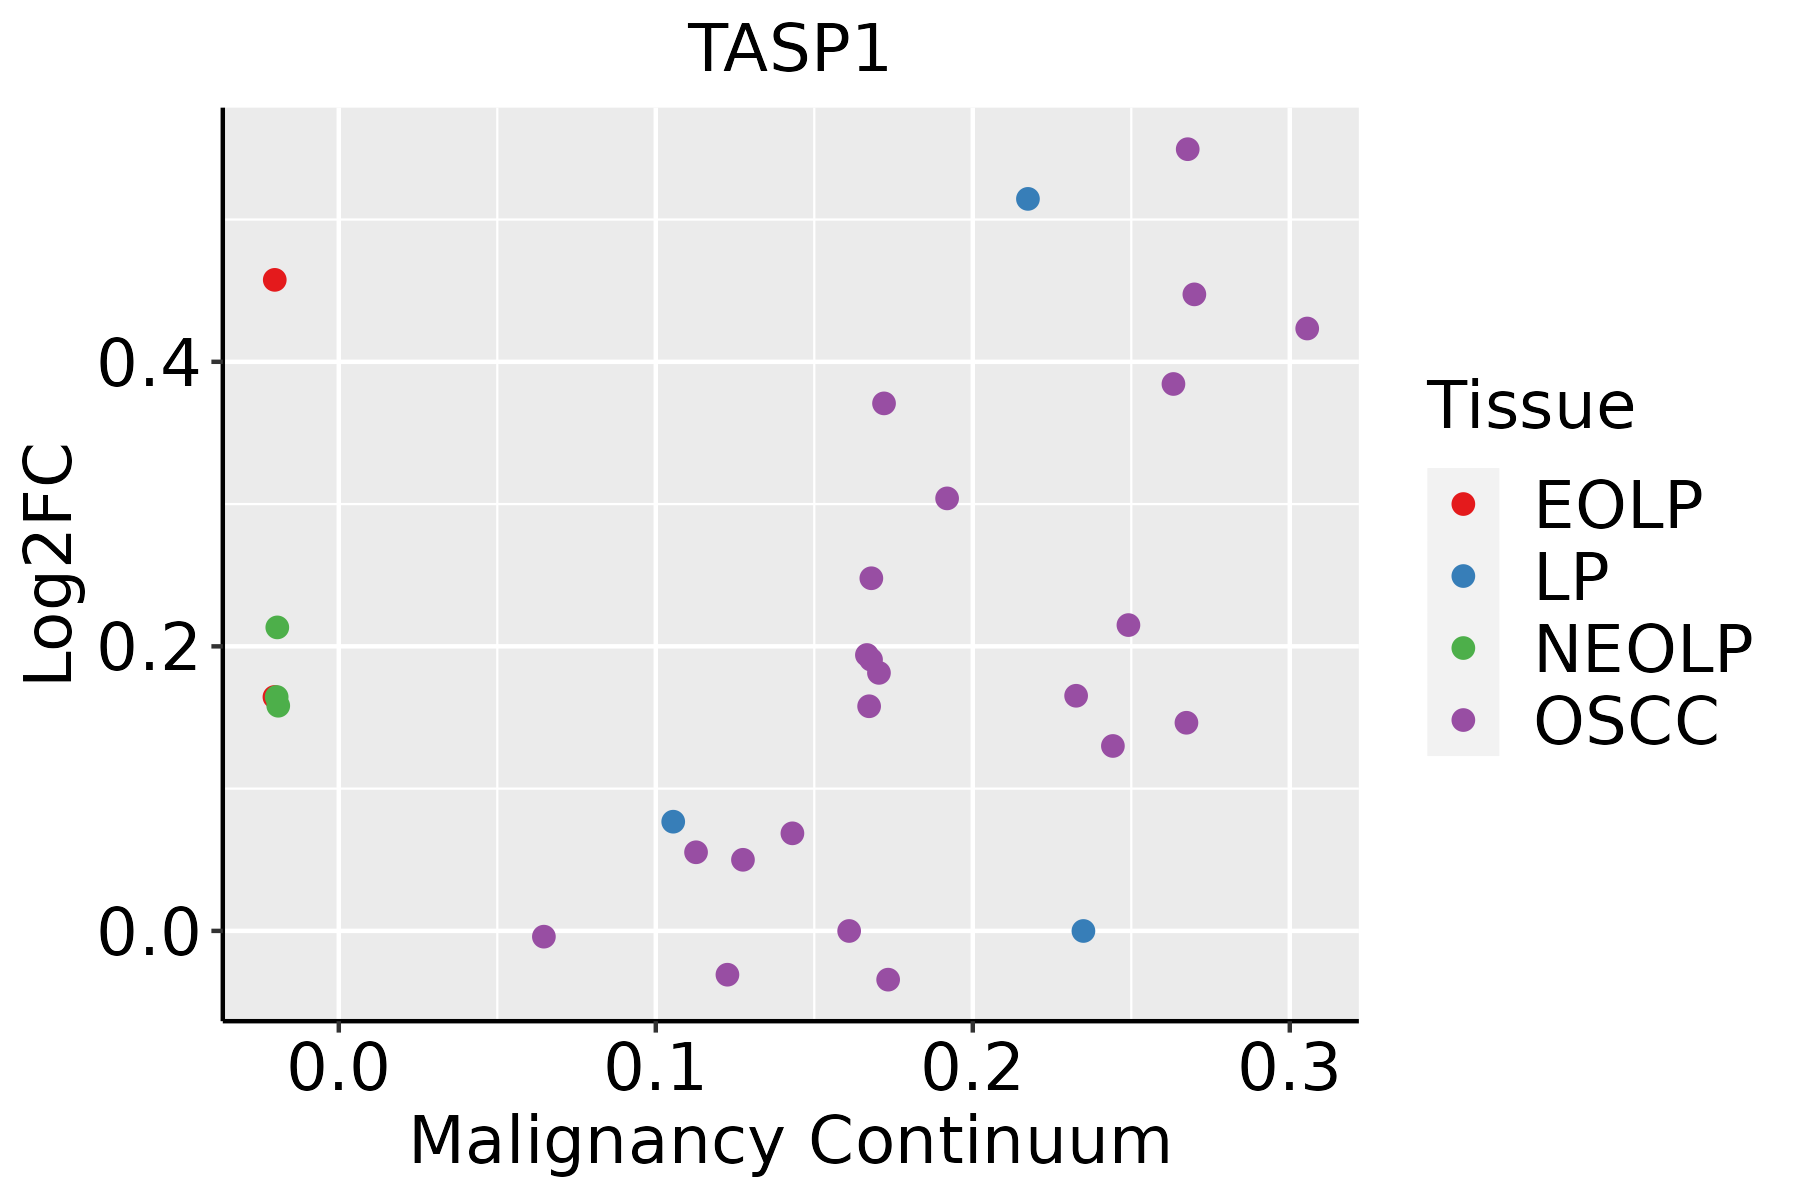 | EOLP: Erosive Oral lichen planus |
| LP: leukoplakia | ||
| NEOLP: Non-erosive oral lichen planus | ||
| OSCC: Oral squamous cell carcinoma |
| ∗log2FC in expression of this searched gene in stem-like cells from each diseased tissue sample relative to stem-like cells in normal samples in each tissue plotted against the malignancy continuum. Samples are colored based on if they are from different disease stage. |
Top |
Malignant transformation related pathway analysis |
| Find out the enriched GO biological processes and KEGG pathways involved in transition from healthy to precancer to cancer |
| Tissue | Disease Stage | Enriched GO biological Processes |
| Colorectum | AD |  |
| Colorectum | SER |  |
| Colorectum | MSS |  |
| Colorectum | MSI-H |  |
| Colorectum | FAP |  |
| ∗Top 15 enriched GO BP terms are showed in the bar plot of each disease state in each tissue. Each row represents a significant GO biological process which is colored according to the -log10(p.adjust). |
| Page: 1 2 3 4 5 6 7 8 9 |
| GO ID | Tissue | Disease Stage | Description | Gene Ratio | Bg Ratio | pvalue | p.adjust | Count |
| GO:00516048 | Cervix | CC | protein maturation | 56/2311 | 294/18723 | 5.90e-04 | 5.59e-03 | 56 |
| GO:0051604 | Colorectum | AD | protein maturation | 85/3918 | 294/18723 | 6.73e-04 | 6.91e-03 | 85 |
| GO:00516041 | Colorectum | SER | protein maturation | 73/2897 | 294/18723 | 1.82e-05 | 5.38e-04 | 73 |
| GO:00516042 | Colorectum | MSS | protein maturation | 75/3467 | 294/18723 | 1.70e-03 | 1.53e-02 | 75 |
| GO:00516044 | Colorectum | CRC | protein maturation | 47/2078 | 294/18723 | 6.52e-03 | 4.70e-02 | 47 |
| GO:005160418 | Esophagus | ESCC | protein maturation | 189/8552 | 294/18723 | 7.64e-11 | 2.39e-09 | 189 |
| GO:005160410 | Oral cavity | OSCC | protein maturation | 170/7305 | 294/18723 | 3.97e-11 | 1.28e-09 | 170 |
| GO:005160416 | Oral cavity | LP | protein maturation | 122/4623 | 294/18723 | 1.37e-10 | 7.72e-09 | 122 |
| GO:005160423 | Oral cavity | EOLP | protein maturation | 50/2218 | 294/18723 | 5.32e-03 | 2.77e-02 | 50 |
| GO:005160432 | Oral cavity | NEOLP | protein maturation | 50/2005 | 294/18723 | 6.46e-04 | 5.47e-03 | 50 |
| Page: 1 |
| Pathway ID | Tissue | Disease Stage | Description | Gene Ratio | Bg Ratio | pvalue | p.adjust | qvalue | Count |
| Page: 1 |
Top |
Cell-cell communication analysis |
| Identification of potential cell-cell interactions between two cell types and their ligand-receptor pairs for different disease states |
| Ligand | Receptor | LRpair | Pathway | Tissue | Disease Stage |
| Page: 1 |
Top |
Single-cell gene regulatory network inference analysis |
| Find out the significant the regulons (TFs) and the target genes of each regulon across cell types for different disease states |
| TF | Cell Type | Tissue | Disease Stage | Target Gene | RSS | Regulon Activity |
| ∗The dot plots of a searched regulon are shown for all cell subpopulations in each disease state of each tissue based on the regulon specific score inferred using pySCENIC and by calculating the average expression. |
| Page: 1 |
Top |
Somatic mutation of malignant transformation related genes |
| Annotation of somatic variants for genes involved in malignant transformation |
| Hugo Symbol | Variant Class | Variant Classification | dbSNP RS | HGVSc | HGVSp | HGVSp Short | SWISSPROT | BIOTYPE | SIFT | PolyPhen | Tumor Sample Barcode | Tissue | Histology | Sex | Age | Stage | Therapy Types | Drugs | Outcome |
| TASP1 | SNV | Missense_Mutation | novel | c.203C>T | p.Ala68Val | p.A68V | Q9H6P5 | protein_coding | deleterious(0) | probably_damaging(0.974) | TCGA-A2-A3Y0-01 | Breast | breast invasive carcinoma | Female | <65 | I/II | Chemotherapy | adriamycin | CR |
| TASP1 | SNV | Missense_Mutation | rs745546208 | c.157C>T | p.His53Tyr | p.H53Y | Q9H6P5 | protein_coding | deleterious(0) | possibly_damaging(0.869) | TCGA-D8-A73U-01 | Breast | breast invasive carcinoma | Female | >=65 | I/II | Hormone Therapy | tamoxiphen | SD |
| TASP1 | SNV | Missense_Mutation | novel | c.1015N>A | p.Val339Met | p.V339M | Q9H6P5 | protein_coding | tolerated(0.13) | possibly_damaging(0.506) | TCGA-OL-A66J-01 | Breast | breast invasive carcinoma | Female | >=65 | I/II | Unknown | Unknown | SD |
| TASP1 | insertion | In_Frame_Ins | novel | c.125_126insAGG | p.Gly42dup | p.G42dup | Q9H6P5 | protein_coding | TCGA-A2-A0YM-01 | Breast | breast invasive carcinoma | Female | >=65 | I/II | Unknown | Unknown | SD | ||
| TASP1 | SNV | Missense_Mutation | novel | c.47N>A | p.Arg16Lys | p.R16K | Q9H6P5 | protein_coding | tolerated_low_confidence(1) | benign(0) | TCGA-JW-A5VL-01 | Cervix | cervical & endocervical cancer | Female | <65 | I/II | Unknown | Unknown | SD |
| TASP1 | SNV | Missense_Mutation | novel | c.235N>T | p.Gly79Cys | p.G79C | Q9H6P5 | protein_coding | deleterious(0) | probably_damaging(0.994) | TCGA-VS-A9UP-01 | Cervix | cervical & endocervical cancer | Female | <65 | I/II | Chemotherapy | cisplatin | PD |
| TASP1 | SNV | Missense_Mutation | c.200N>A | p.Arg67Gln | p.R67Q | Q9H6P5 | protein_coding | tolerated(0.29) | benign(0.151) | TCGA-AA-3977-01 | Colorectum | colon adenocarcinoma | Male | >=65 | I/II | Unknown | Unknown | SD | |
| TASP1 | SNV | Missense_Mutation | c.520N>A | p.Ala174Thr | p.A174T | Q9H6P5 | protein_coding | deleterious(0) | probably_damaging(0.999) | TCGA-AD-6889-01 | Colorectum | colon adenocarcinoma | Male | >=65 | I/II | Chemotherapy | xeloda | PD | |
| TASP1 | SNV | Missense_Mutation | c.253N>A | p.Ala85Thr | p.A85T | Q9H6P5 | protein_coding | deleterious(0.04) | possibly_damaging(0.907) | TCGA-AZ-4313-01 | Colorectum | colon adenocarcinoma | Female | <65 | I/II | Unknown | Unknown | SD | |
| TASP1 | SNV | Missense_Mutation | c.727N>A | p.Glu243Lys | p.E243K | Q9H6P5 | protein_coding | tolerated(0.17) | benign(0.196) | TCGA-AZ-4315-01 | Colorectum | colon adenocarcinoma | Male | <65 | I/II | Unknown | Unknown | SD |
| Page: 1 2 3 4 5 6 |
Top |
Related drugs of malignant transformation related genes |
| Identification of chemicals and drugs interact with genes involved in malignant transfromation |
| (DGIdb 4.0) |
| Entrez ID | Symbol | Category | Interaction Types | Drug Claim Name | Drug Name | PMIDs |
| 55617 | TASP1 | PROTEASE, ENZYME, TRANSCRIPTION FACTOR | inhibitor | 252827510 |
| Page: 1 |

Copyright 2023-Present -The University of Texas Health Science Center at Houston |