
|
|||||
|
 | |
| |
| |
| |
| |
| |
|
Gene: TASOR |
Gene summary for TASOR |
| Gene information | Species | Human | Gene symbol | TASOR | Gene ID | 23272 |
| Gene name | transcription activation suppressor | |
| Gene Alias | C3orf63 | |
| Cytomap | 3p14.3 | |
| Gene Type | protein-coding | GO ID | GO:0000578 | UniProtAcc | Q9UK61 |
Top |
Malignant transformation analysis |
| Identification of the aberrant gene expression in precancerous and cancerous lesions by comparing the gene expression of stem-like cells in diseased tissues with normal stem cells |
| Entrez ID | Symbol | Replicates | Species | Organ | Tissue | Adj P-value | Log2FC | Malignancy |
| 23272 | TASOR | LZE2T | Human | Esophagus | ESCC | 9.54e-06 | 6.52e-01 | 0.082 |
| 23272 | TASOR | LZE4T | Human | Esophagus | ESCC | 2.81e-19 | 5.62e-01 | 0.0811 |
| 23272 | TASOR | LZE5T | Human | Esophagus | ESCC | 1.54e-04 | 2.52e-01 | 0.0514 |
| 23272 | TASOR | LZE7T | Human | Esophagus | ESCC | 2.07e-15 | 6.19e-01 | 0.0667 |
| 23272 | TASOR | LZE20T | Human | Esophagus | ESCC | 1.26e-02 | 1.42e-01 | 0.0662 |
| 23272 | TASOR | LZE24T | Human | Esophagus | ESCC | 2.92e-27 | 6.03e-01 | 0.0596 |
| 23272 | TASOR | LZE21T | Human | Esophagus | ESCC | 6.52e-03 | 1.82e-01 | 0.0655 |
| 23272 | TASOR | LZE6T | Human | Esophagus | ESCC | 1.62e-02 | 1.56e-01 | 0.0845 |
| 23272 | TASOR | RNA-P17T-P17T-4 | Human | Lung | IAC | 4.71e-02 | 4.90e-01 | 0.343 |
| 23272 | TASOR | RNA-P25T1-P25T1-1 | Human | Lung | AIS | 1.44e-06 | 3.50e-01 | -0.2116 |
| 23272 | TASOR | RNA-P25T1-P25T1-2 | Human | Lung | AIS | 1.36e-03 | 5.01e-01 | -0.1941 |
| 23272 | TASOR | RNA-P25T1-P25T1-4 | Human | Lung | AIS | 2.98e-05 | 3.58e-01 | -0.2119 |
| 23272 | TASOR | RNA-P6T2-P6T2-1 | Human | Lung | IAC | 8.58e-08 | 3.11e-01 | -0.0166 |
| 23272 | TASOR | RNA-P6T2-P6T2-2 | Human | Lung | IAC | 5.38e-07 | 3.09e-01 | -0.0132 |
| 23272 | TASOR | RNA-P6T2-P6T2-3 | Human | Lung | IAC | 1.85e-09 | 3.46e-01 | -0.013 |
| 23272 | TASOR | RNA-P6T2-P6T2-4 | Human | Lung | IAC | 4.89e-07 | 3.12e-01 | -0.0121 |
| 23272 | TASOR | RNA-P7T1-P7T1-1 | Human | Lung | AIS | 1.36e-03 | 3.73e-01 | -0.0961 |
| 23272 | TASOR | RNA-P7T1-P7T1-2 | Human | Lung | AIS | 1.46e-05 | 4.66e-01 | -0.0876 |
| 23272 | TASOR | RNA-P7T1-P7T1-3 | Human | Lung | AIS | 2.91e-02 | 3.30e-01 | -0.0822 |
| 23272 | TASOR | RNA-P7T1-P7T1-4 | Human | Lung | AIS | 6.36e-10 | 6.17e-01 | -0.0809 |
| Page: 1 |
| Tissue | Expression Dynamics | Abbreviation |
| Esophagus | 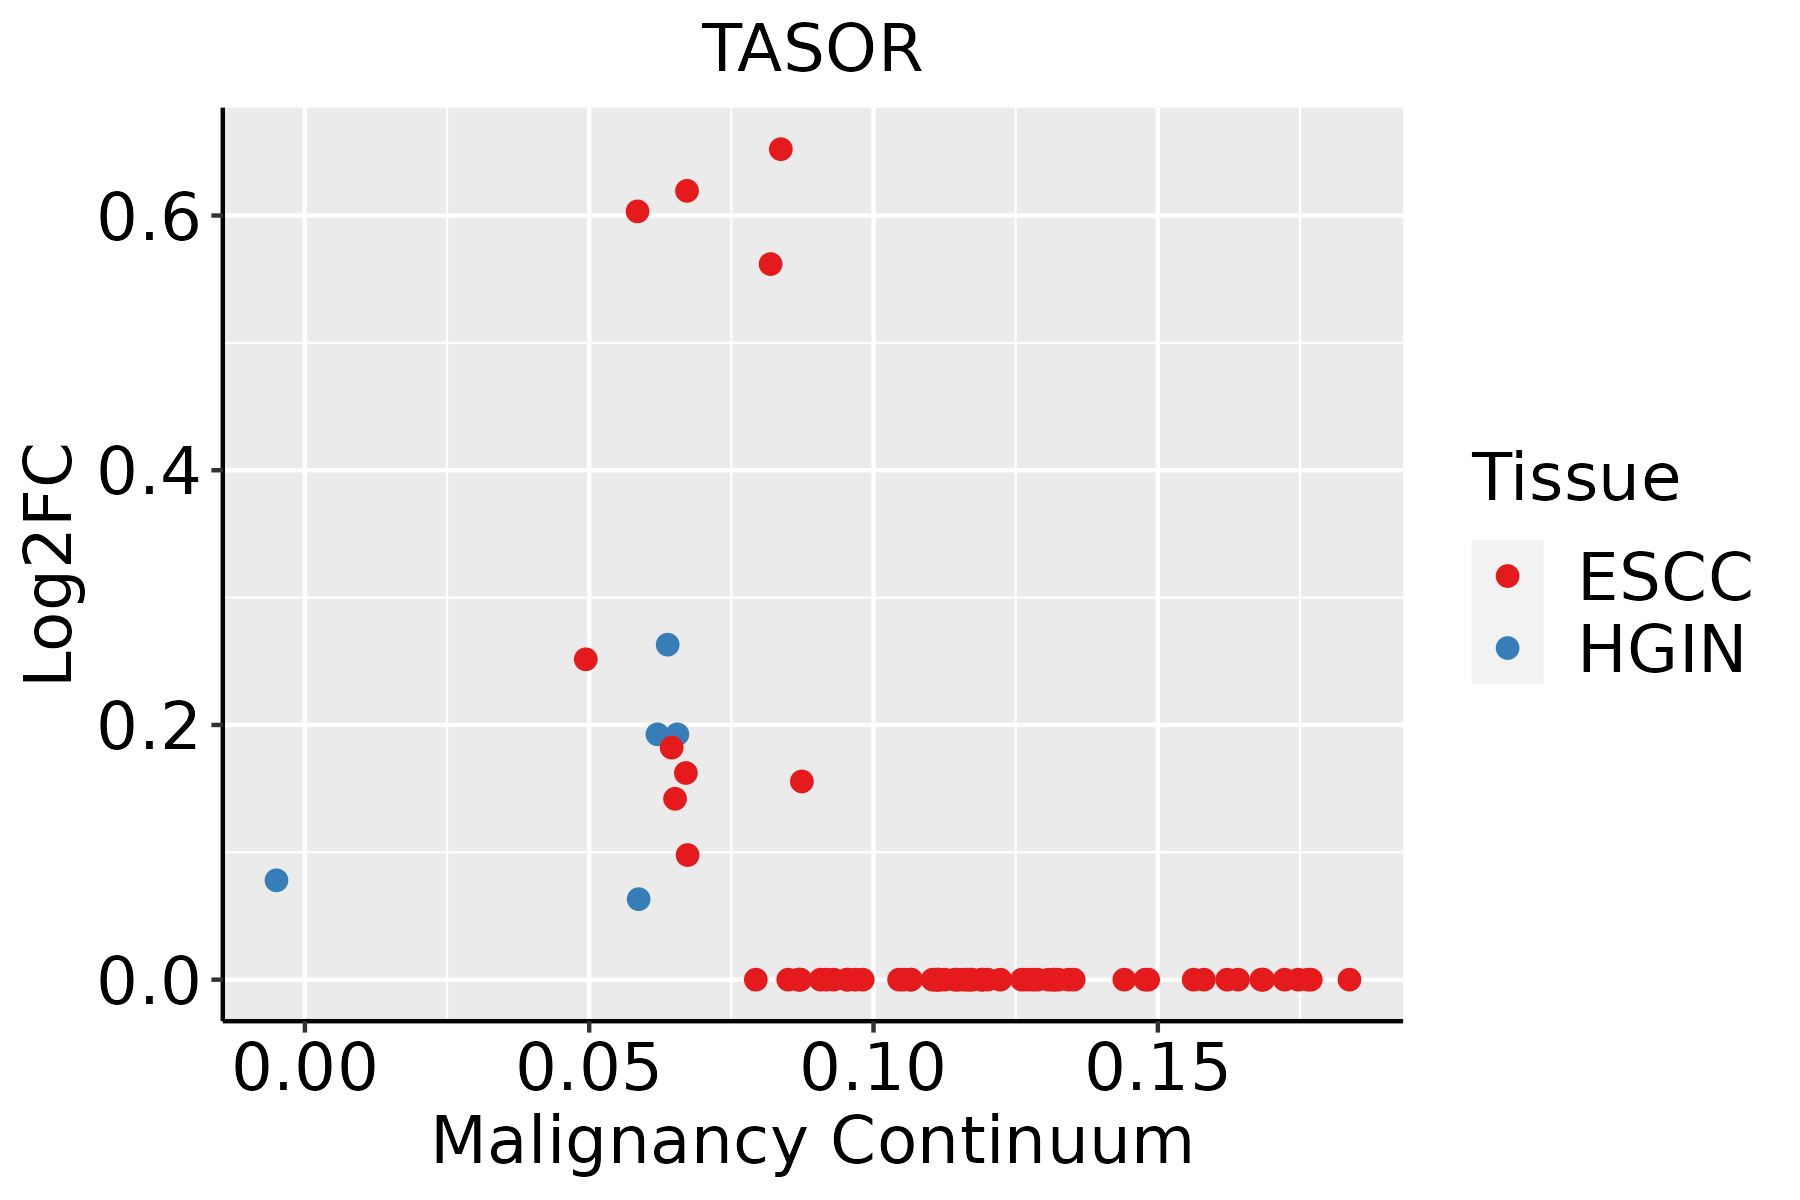 | ESCC: Esophageal squamous cell carcinoma |
| HGIN: High-grade intraepithelial neoplasias | ||
| LGIN: Low-grade intraepithelial neoplasias | ||
| Lung | 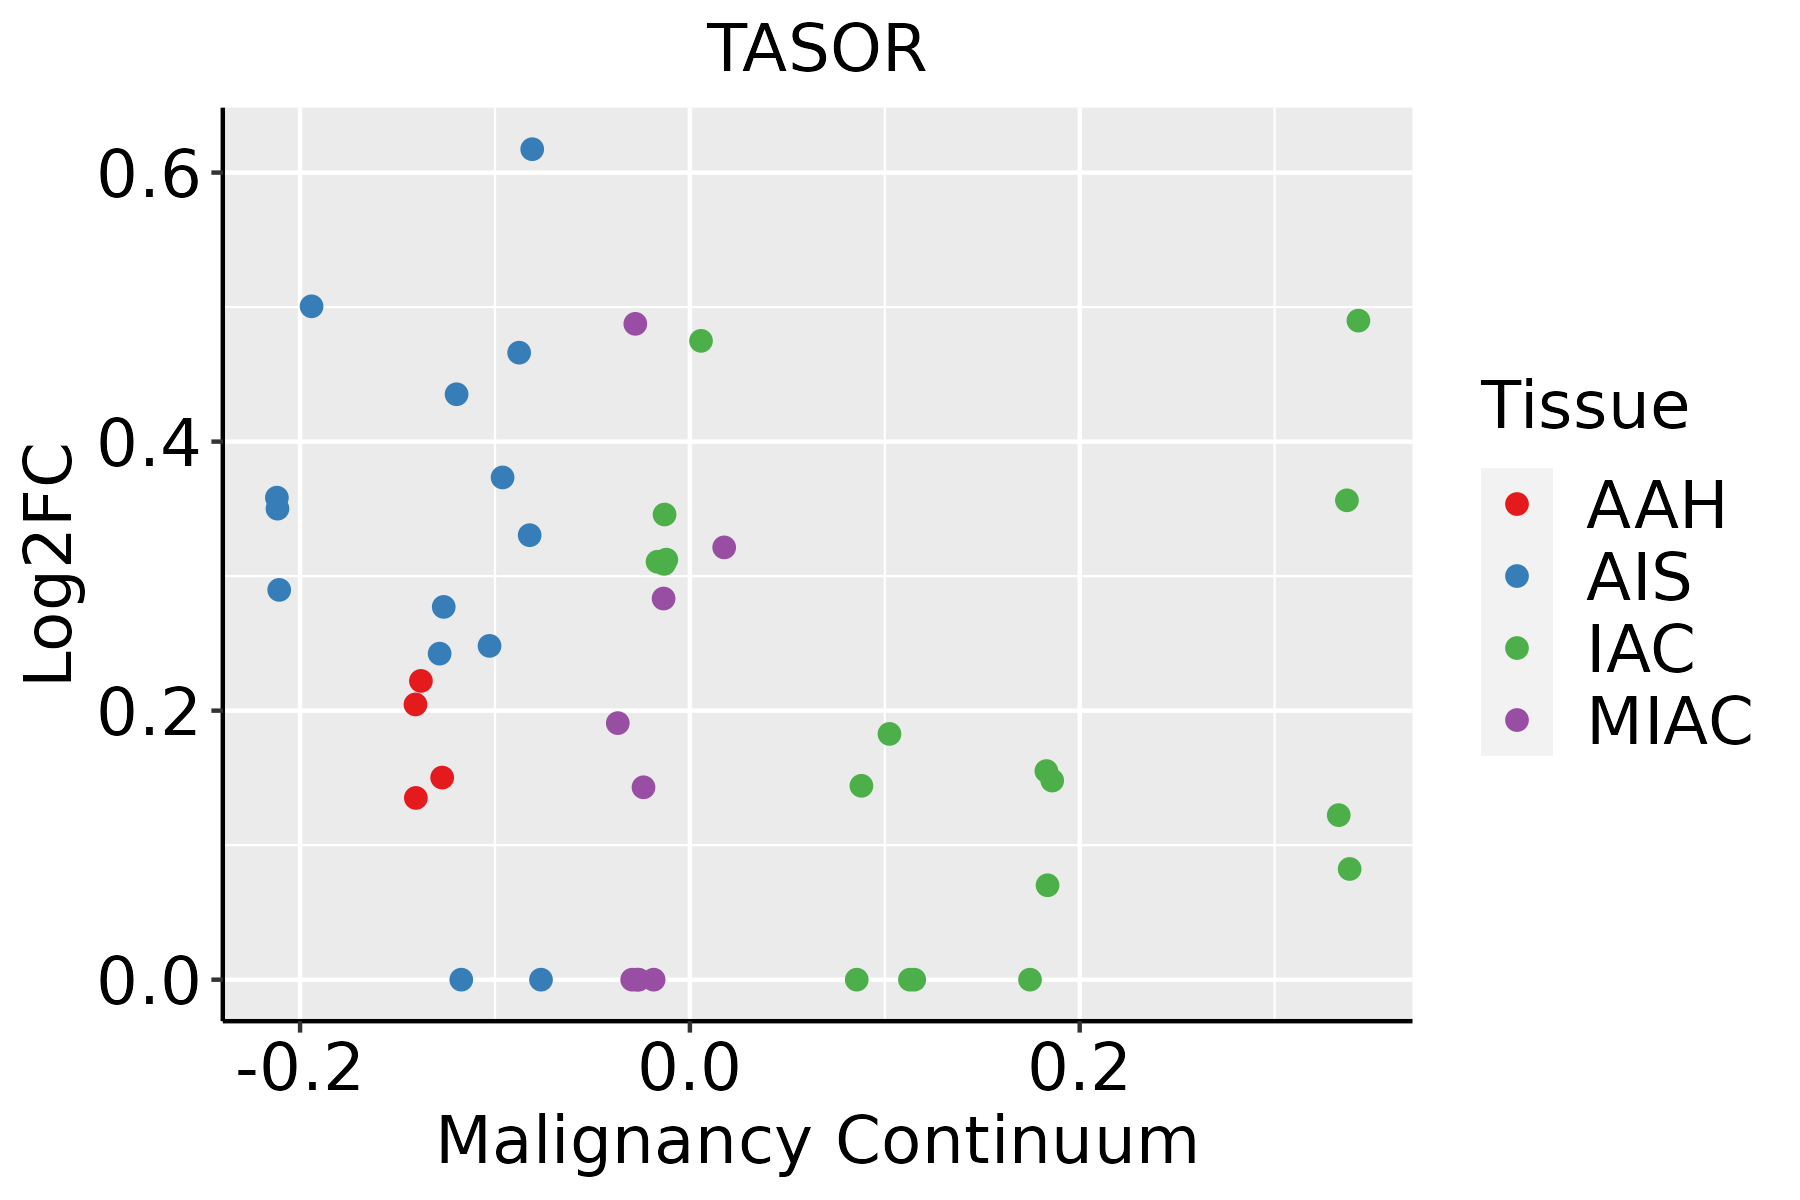 | AAH: Atypical adenomatous hyperplasia |
| AIS: Adenocarcinoma in situ | ||
| IAC: Invasive lung adenocarcinoma | ||
| MIA: Minimally invasive adenocarcinoma |
| ∗log2FC in expression of this searched gene in stem-like cells from each diseased tissue sample relative to stem-like cells in normal samples in each tissue plotted against the malignancy continuum. Samples are colored based on if they are from different disease stage. |
Top |
Malignant transformation related pathway analysis |
| Find out the enriched GO biological processes and KEGG pathways involved in transition from healthy to precancer to cancer |
| Tissue | Disease Stage | Enriched GO biological Processes |
| Colorectum | AD |  |
| Colorectum | SER |  |
| Colorectum | MSS |  |
| Colorectum | MSI-H |  |
| Colorectum | FAP |  |
| ∗Top 15 enriched GO BP terms are showed in the bar plot of each disease state in each tissue. Each row represents a significant GO biological process which is colored according to the -log10(p.adjust). |
| Page: 1 2 3 4 5 6 7 8 9 |
| GO ID | Tissue | Disease Stage | Description | Gene Ratio | Bg Ratio | pvalue | p.adjust | Count |
| GO:0016032111 | Esophagus | ESCC | viral process | 301/8552 | 415/18723 | 3.34e-29 | 1.32e-26 | 301 |
| GO:0019058111 | Esophagus | ESCC | viral life cycle | 226/8552 | 317/18723 | 1.17e-20 | 1.76e-18 | 226 |
| GO:003304416 | Esophagus | ESCC | regulation of chromosome organization | 145/8552 | 187/18723 | 3.80e-19 | 4.31e-17 | 145 |
| GO:0019079111 | Esophagus | ESCC | viral genome replication | 102/8552 | 131/18723 | 4.31e-14 | 2.19e-12 | 102 |
| GO:0050792111 | Esophagus | ESCC | regulation of viral process | 119/8552 | 164/18723 | 2.19e-12 | 9.03e-11 | 119 |
| GO:1903900111 | Esophagus | ESCC | regulation of viral life cycle | 106/8552 | 148/18723 | 1.26e-10 | 3.72e-09 | 106 |
| GO:0045069110 | Esophagus | ESCC | regulation of viral genome replication | 67/8552 | 85/18723 | 3.81e-10 | 1.04e-08 | 67 |
| GO:200125219 | Esophagus | ESCC | positive regulation of chromosome organization | 64/8552 | 82/18723 | 1.98e-09 | 4.52e-08 | 64 |
| GO:003450211 | Esophagus | ESCC | protein localization to chromosome | 70/8552 | 92/18723 | 2.54e-09 | 5.64e-08 | 70 |
| GO:000632517 | Esophagus | ESCC | chromatin organization | 240/8552 | 409/18723 | 6.52e-08 | 1.14e-06 | 240 |
| GO:00400295 | Esophagus | ESCC | regulation of gene expression, epigenetic | 74/8552 | 105/18723 | 2.24e-07 | 3.42e-06 | 74 |
| GO:004852516 | Esophagus | ESCC | negative regulation of viral process | 66/8552 | 92/18723 | 3.49e-07 | 4.88e-06 | 66 |
| GO:004507114 | Esophagus | ESCC | negative regulation of viral genome replication | 44/8552 | 56/18723 | 4.84e-07 | 6.50e-06 | 44 |
| GO:00073698 | Esophagus | ESCC | gastrulation | 115/8552 | 185/18723 | 4.35e-06 | 4.64e-05 | 115 |
| GO:00018378 | Esophagus | ESCC | epithelial to mesenchymal transition | 95/8552 | 157/18723 | 1.25e-04 | 8.56e-04 | 95 |
| GO:003969411 | Esophagus | ESCC | viral RNA genome replication | 27/8552 | 35/18723 | 1.48e-04 | 9.88e-04 | 27 |
| GO:00487628 | Esophagus | ESCC | mesenchymal cell differentiation | 133/8552 | 236/18723 | 5.94e-04 | 3.22e-03 | 133 |
| GO:00708281 | Esophagus | ESCC | heterochromatin organization | 31/8552 | 46/18723 | 2.42e-03 | 1.06e-02 | 31 |
| GO:00604856 | Esophagus | ESCC | mesenchyme development | 156/8552 | 291/18723 | 3.76e-03 | 1.53e-02 | 156 |
| GO:0045814 | Esophagus | ESCC | negative regulation of gene expression, epigenetic | 32/8552 | 50/18723 | 6.90e-03 | 2.52e-02 | 32 |
| Page: 1 2 3 |
| Pathway ID | Tissue | Disease Stage | Description | Gene Ratio | Bg Ratio | pvalue | p.adjust | qvalue | Count |
| Page: 1 |
Top |
Cell-cell communication analysis |
| Identification of potential cell-cell interactions between two cell types and their ligand-receptor pairs for different disease states |
| Ligand | Receptor | LRpair | Pathway | Tissue | Disease Stage |
| Page: 1 |
Top |
Single-cell gene regulatory network inference analysis |
| Find out the significant the regulons (TFs) and the target genes of each regulon across cell types for different disease states |
| TF | Cell Type | Tissue | Disease Stage | Target Gene | RSS | Regulon Activity |
| ∗The dot plots of a searched regulon are shown for all cell subpopulations in each disease state of each tissue based on the regulon specific score inferred using pySCENIC and by calculating the average expression. |
| Page: 1 |
Top |
Somatic mutation of malignant transformation related genes |
| Annotation of somatic variants for genes involved in malignant transformation |
| Hugo Symbol | Variant Class | Variant Classification | dbSNP RS | HGVSc | HGVSp | HGVSp Short | SWISSPROT | BIOTYPE | SIFT | PolyPhen | Tumor Sample Barcode | Tissue | Histology | Sex | Age | Stage | Therapy Types | Drugs | Outcome |
| Page: 1 |
Top |
Related drugs of malignant transformation related genes |
| Identification of chemicals and drugs interact with genes involved in malignant transfromation |
| (DGIdb 4.0) |
| Entrez ID | Symbol | Category | Interaction Types | Drug Claim Name | Drug Name | PMIDs |
| Page: 1 |

Copyright 2023-Present -The University of Texas Health Science Center at Houston |