
|
|||||
|
 | |
| |
| |
| |
| |
| |
|
Gene: TARDBP |
Gene summary for TARDBP |
| Gene information | Species | Human | Gene symbol | TARDBP | Gene ID | 23435 |
| Gene name | TAR DNA binding protein | |
| Gene Alias | ALS10 | |
| Cytomap | 1p36.22 | |
| Gene Type | protein-coding | GO ID | GO:0001932 | UniProtAcc | A0A024R4E2 |
Top |
Malignant transformation analysis |
| Identification of the aberrant gene expression in precancerous and cancerous lesions by comparing the gene expression of stem-like cells in diseased tissues with normal stem cells |
| Entrez ID | Symbol | Replicates | Species | Organ | Tissue | Adj P-value | Log2FC | Malignancy |
| 23435 | TARDBP | HTA11_3410_2000001011 | Human | Colorectum | AD | 2.80e-11 | 2.81e-01 | 0.0155 |
| 23435 | TARDBP | HTA11_2487_2000001011 | Human | Colorectum | SER | 2.05e-07 | 3.41e-01 | -0.1808 |
| 23435 | TARDBP | HTA11_1938_2000001011 | Human | Colorectum | AD | 8.45e-21 | 6.26e-01 | -0.0811 |
| 23435 | TARDBP | HTA11_78_2000001011 | Human | Colorectum | AD | 6.58e-19 | 6.34e-01 | -0.1088 |
| 23435 | TARDBP | HTA11_347_2000001011 | Human | Colorectum | AD | 4.60e-21 | 4.83e-01 | -0.1954 |
| 23435 | TARDBP | HTA11_2112_2000001011 | Human | Colorectum | SER | 3.24e-03 | 4.46e-01 | -0.2196 |
| 23435 | TARDBP | HTA11_3361_2000001011 | Human | Colorectum | AD | 2.31e-05 | 2.71e-01 | -0.1207 |
| 23435 | TARDBP | HTA11_83_2000001011 | Human | Colorectum | SER | 3.42e-06 | 3.40e-01 | -0.1526 |
| 23435 | TARDBP | HTA11_696_2000001011 | Human | Colorectum | AD | 2.20e-12 | 3.09e-01 | -0.1464 |
| 23435 | TARDBP | HTA11_866_2000001011 | Human | Colorectum | AD | 2.18e-07 | 2.06e-01 | -0.1001 |
| 23435 | TARDBP | HTA11_1391_2000001011 | Human | Colorectum | AD | 3.15e-19 | 6.09e-01 | -0.059 |
| 23435 | TARDBP | HTA11_2992_2000001011 | Human | Colorectum | SER | 1.60e-03 | 2.80e-01 | -0.1706 |
| 23435 | TARDBP | HTA11_546_2000001011 | Human | Colorectum | AD | 1.26e-03 | 2.83e-01 | -0.0842 |
| 23435 | TARDBP | HTA11_7862_2000001011 | Human | Colorectum | AD | 2.90e-09 | 4.76e-01 | -0.0179 |
| 23435 | TARDBP | HTA11_866_3004761011 | Human | Colorectum | AD | 5.29e-09 | 3.23e-01 | 0.096 |
| 23435 | TARDBP | HTA11_4255_2000001011 | Human | Colorectum | SER | 2.16e-08 | 5.78e-01 | 0.0446 |
| 23435 | TARDBP | HTA11_7663_2000001011 | Human | Colorectum | SER | 8.50e-09 | 5.36e-01 | 0.0131 |
| 23435 | TARDBP | HTA11_10623_2000001011 | Human | Colorectum | AD | 3.34e-12 | 5.56e-01 | -0.0177 |
| 23435 | TARDBP | HTA11_6801_2000001011 | Human | Colorectum | SER | 2.03e-13 | 7.74e-01 | 0.0171 |
| 23435 | TARDBP | HTA11_10711_2000001011 | Human | Colorectum | AD | 3.09e-02 | 2.14e-01 | 0.0338 |
| Page: 1 2 3 4 5 6 7 8 |
| Tissue | Expression Dynamics | Abbreviation |
| Colorectum (GSE201348) |  | FAP: Familial adenomatous polyposis |
| CRC: Colorectal cancer | ||
| Colorectum (HTA11) |  | AD: Adenomas |
| SER: Sessile serrated lesions | ||
| MSI-H: Microsatellite-high colorectal cancer | ||
| MSS: Microsatellite stable colorectal cancer | ||
| Esophagus | 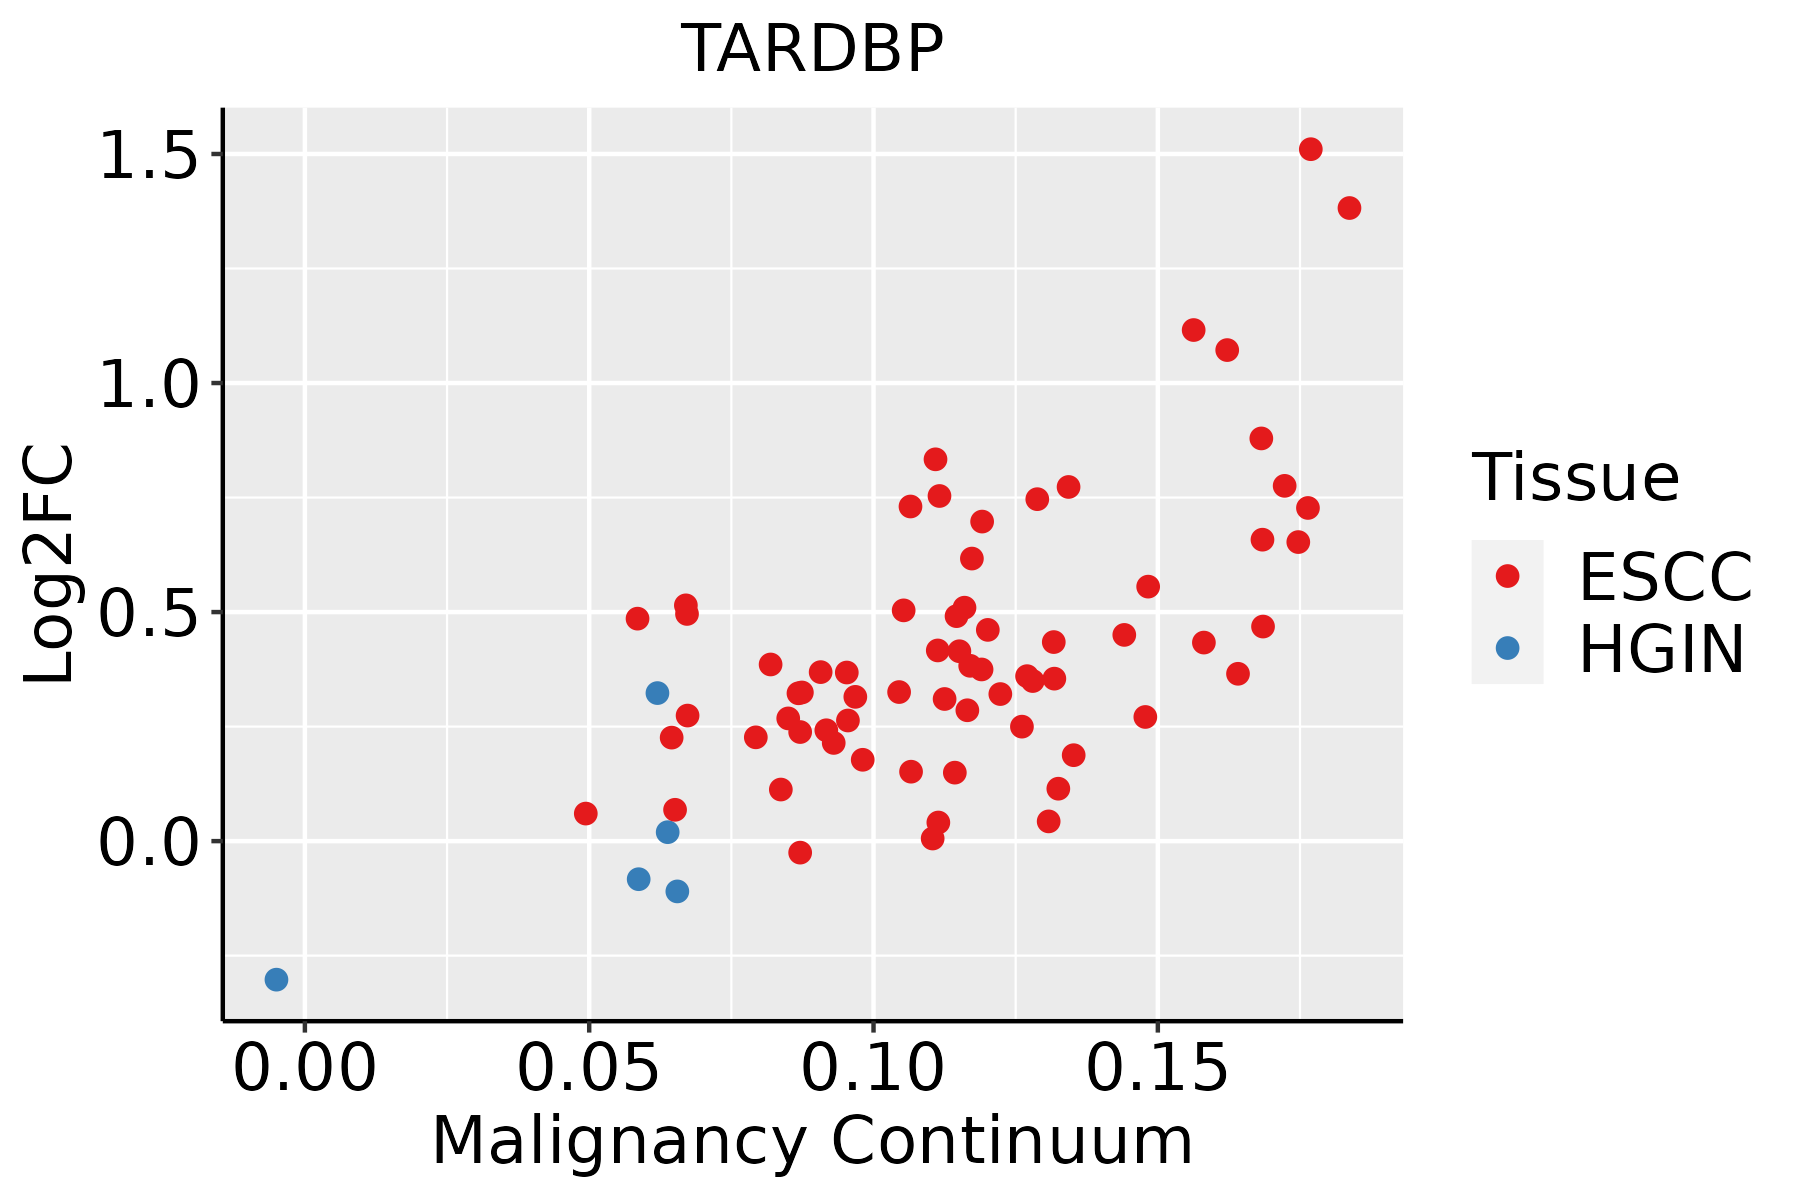 | ESCC: Esophageal squamous cell carcinoma |
| HGIN: High-grade intraepithelial neoplasias | ||
| LGIN: Low-grade intraepithelial neoplasias | ||
| Liver |  | HCC: Hepatocellular carcinoma |
| NAFLD: Non-alcoholic fatty liver disease | ||
| Oral Cavity | 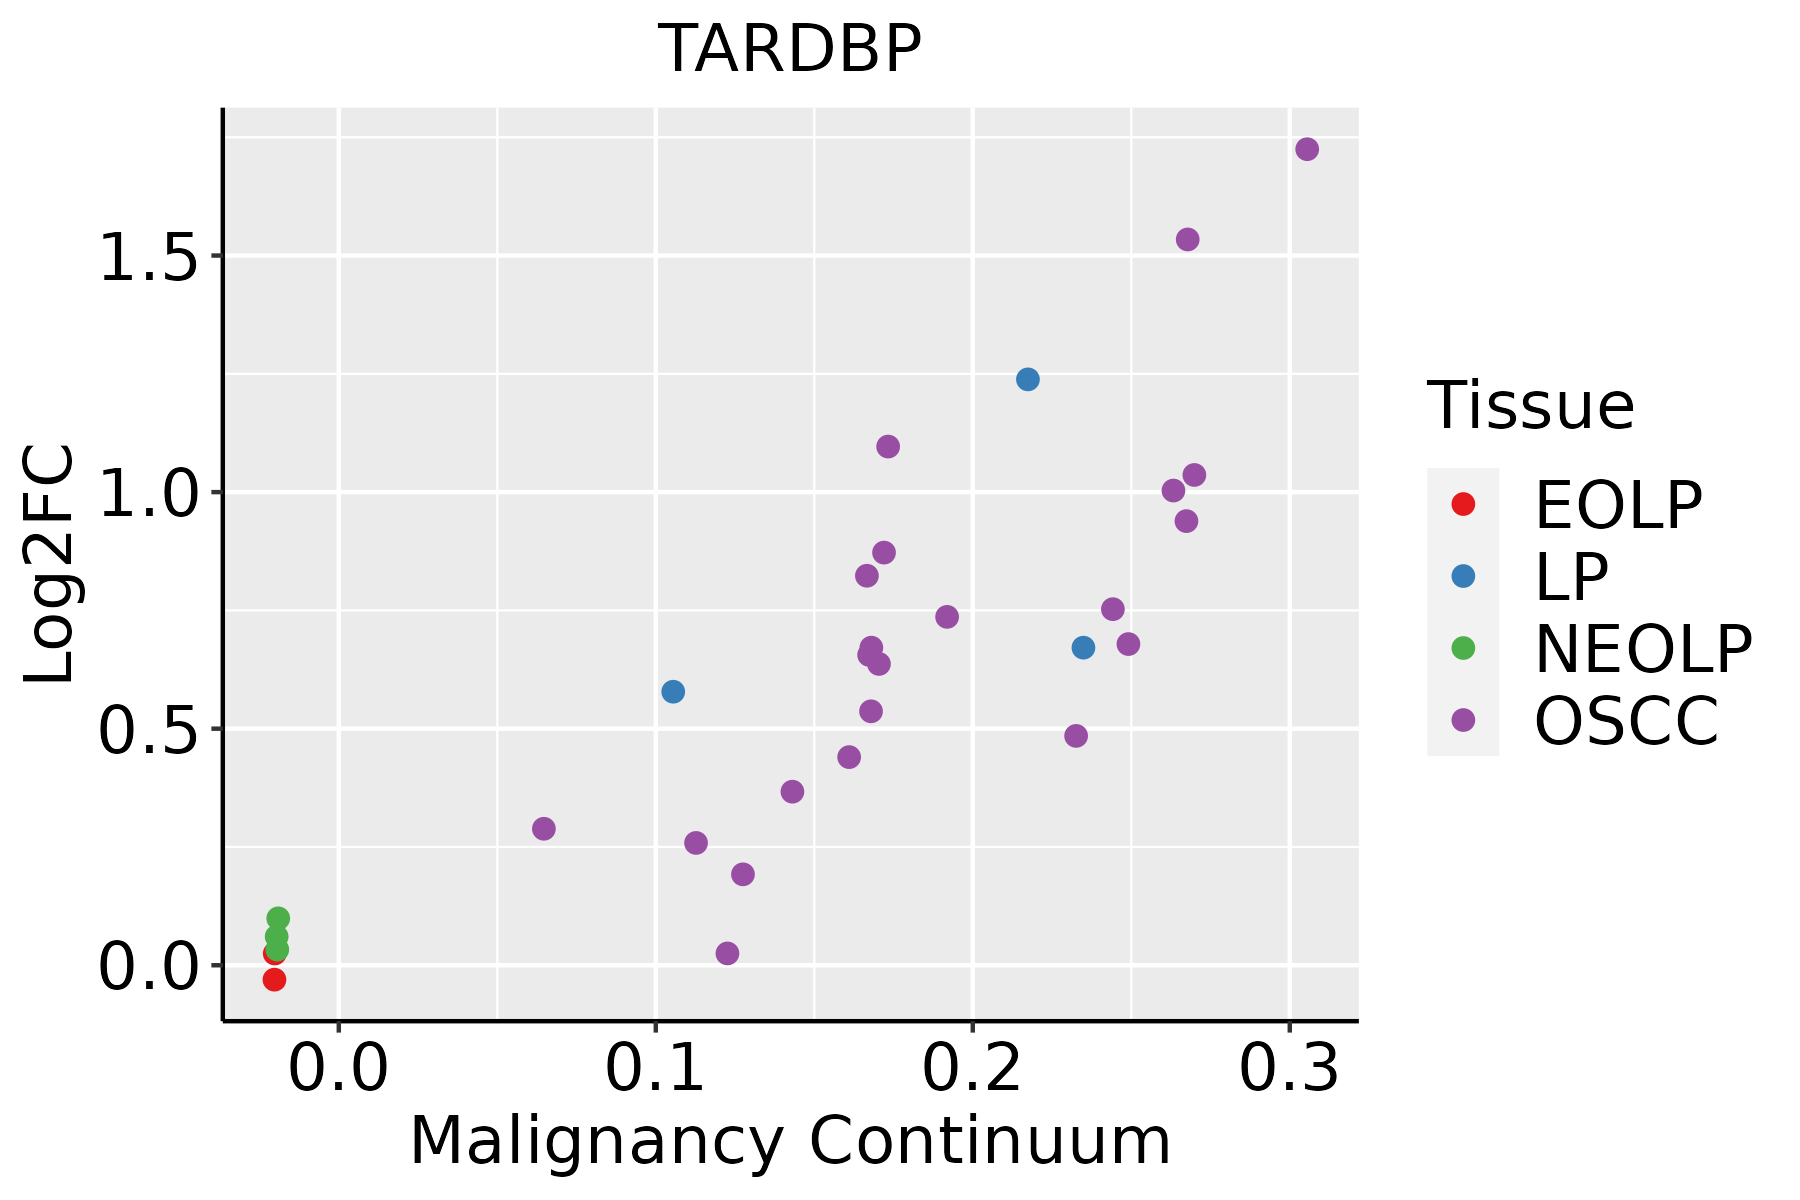 | EOLP: Erosive Oral lichen planus |
| LP: leukoplakia | ||
| NEOLP: Non-erosive oral lichen planus | ||
| OSCC: Oral squamous cell carcinoma | ||
| Skin |  | AK: Actinic keratosis |
| cSCC: Cutaneous squamous cell carcinoma | ||
| SCCIS:squamous cell carcinoma in situ | ||
| Thyroid |  | ATC: Anaplastic thyroid cancer |
| HT: Hashimoto's thyroiditis | ||
| PTC: Papillary thyroid cancer |
| ∗log2FC in expression of this searched gene in stem-like cells from each diseased tissue sample relative to stem-like cells in normal samples in each tissue plotted against the malignancy continuum. Samples are colored based on if they are from different disease stage. |
Top |
Malignant transformation related pathway analysis |
| Find out the enriched GO biological processes and KEGG pathways involved in transition from healthy to precancer to cancer |
| Tissue | Disease Stage | Enriched GO biological Processes |
| Colorectum | AD |  |
| Colorectum | SER |  |
| Colorectum | MSS |  |
| Colorectum | MSI-H |  |
| Colorectum | FAP |  |
| ∗Top 15 enriched GO BP terms are showed in the bar plot of each disease state in each tissue. Each row represents a significant GO biological process which is colored according to the -log10(p.adjust). |
| Page: 1 2 3 4 5 6 7 8 9 |
| GO ID | Tissue | Disease Stage | Description | Gene Ratio | Bg Ratio | pvalue | p.adjust | Count |
| GO:0016032 | Colorectum | AD | viral process | 168/3918 | 415/18723 | 4.67e-20 | 3.66e-17 | 168 |
| GO:0008380 | Colorectum | AD | RNA splicing | 169/3918 | 434/18723 | 3.59e-18 | 2.04e-15 | 169 |
| GO:0009896 | Colorectum | AD | positive regulation of catabolic process | 180/3918 | 492/18723 | 4.33e-16 | 1.94e-13 | 180 |
| GO:1903311 | Colorectum | AD | regulation of mRNA metabolic process | 117/3918 | 288/18723 | 1.69e-14 | 4.23e-12 | 117 |
| GO:0031331 | Colorectum | AD | positive regulation of cellular catabolic process | 156/3918 | 427/18723 | 4.68e-14 | 1.05e-11 | 156 |
| GO:0009895 | Colorectum | AD | negative regulation of catabolic process | 124/3918 | 320/18723 | 1.66e-13 | 3.35e-11 | 124 |
| GO:1903829 | Colorectum | AD | positive regulation of cellular protein localization | 110/3918 | 276/18723 | 4.58e-13 | 8.44e-11 | 110 |
| GO:0031330 | Colorectum | AD | negative regulation of cellular catabolic process | 104/3918 | 262/18723 | 2.66e-12 | 3.96e-10 | 104 |
| GO:0072594 | Colorectum | AD | establishment of protein localization to organelle | 148/3918 | 422/18723 | 7.95e-12 | 1.04e-09 | 148 |
| GO:0031647 | Colorectum | AD | regulation of protein stability | 108/3918 | 298/18723 | 6.33e-10 | 5.08e-08 | 108 |
| GO:0006401 | Colorectum | AD | RNA catabolic process | 102/3918 | 278/18723 | 8.64e-10 | 6.76e-08 | 102 |
| GO:1904951 | Colorectum | AD | positive regulation of establishment of protein localization | 112/3918 | 319/18723 | 2.55e-09 | 1.80e-07 | 112 |
| GO:0044270 | Colorectum | AD | cellular nitrogen compound catabolic process | 147/3918 | 451/18723 | 3.35e-09 | 2.23e-07 | 147 |
| GO:0046700 | Colorectum | AD | heterocycle catabolic process | 145/3918 | 445/18723 | 4.37e-09 | 2.84e-07 | 145 |
| GO:0006402 | Colorectum | AD | mRNA catabolic process | 87/3918 | 232/18723 | 4.40e-09 | 2.84e-07 | 87 |
| GO:0051222 | Colorectum | AD | positive regulation of protein transport | 106/3918 | 303/18723 | 8.45e-09 | 5.08e-07 | 106 |
| GO:0034655 | Colorectum | AD | nucleobase-containing compound catabolic process | 133/3918 | 407/18723 | 1.56e-08 | 9.12e-07 | 133 |
| GO:0019439 | Colorectum | AD | aromatic compound catabolic process | 146/3918 | 467/18723 | 7.48e-08 | 3.84e-06 | 146 |
| GO:1901361 | Colorectum | AD | organic cyclic compound catabolic process | 153/3918 | 495/18723 | 8.23e-08 | 4.18e-06 | 153 |
| GO:0034976 | Colorectum | AD | response to endoplasmic reticulum stress | 90/3918 | 256/18723 | 8.48e-08 | 4.28e-06 | 90 |
| Page: 1 2 3 4 5 6 7 8 9 10 11 12 13 14 15 16 17 18 19 20 21 22 23 24 25 26 27 28 29 30 31 32 33 34 35 36 37 38 39 40 41 42 43 44 45 |
| Pathway ID | Tissue | Disease Stage | Description | Gene Ratio | Bg Ratio | pvalue | p.adjust | qvalue | Count |
| hsa05014 | Colorectum | AD | Amyotrophic lateral sclerosis | 164/2092 | 364/8465 | 4.28e-18 | 1.27e-16 | 8.09e-17 | 164 |
| hsa05022 | Colorectum | AD | Pathways of neurodegeneration - multiple diseases | 201/2092 | 476/8465 | 4.54e-18 | 1.27e-16 | 8.09e-17 | 201 |
| hsa03015 | Colorectum | AD | mRNA surveillance pathway | 35/2092 | 97/8465 | 7.95e-03 | 3.13e-02 | 2.00e-02 | 35 |
| hsa050141 | Colorectum | AD | Amyotrophic lateral sclerosis | 164/2092 | 364/8465 | 4.28e-18 | 1.27e-16 | 8.09e-17 | 164 |
| hsa050221 | Colorectum | AD | Pathways of neurodegeneration - multiple diseases | 201/2092 | 476/8465 | 4.54e-18 | 1.27e-16 | 8.09e-17 | 201 |
| hsa030151 | Colorectum | AD | mRNA surveillance pathway | 35/2092 | 97/8465 | 7.95e-03 | 3.13e-02 | 2.00e-02 | 35 |
| hsa050222 | Colorectum | SER | Pathways of neurodegeneration - multiple diseases | 168/1580 | 476/8465 | 6.23e-19 | 2.07e-17 | 1.50e-17 | 168 |
| hsa050142 | Colorectum | SER | Amyotrophic lateral sclerosis | 138/1580 | 364/8465 | 9.89e-19 | 2.99e-17 | 2.17e-17 | 138 |
| hsa050223 | Colorectum | SER | Pathways of neurodegeneration - multiple diseases | 168/1580 | 476/8465 | 6.23e-19 | 2.07e-17 | 1.50e-17 | 168 |
| hsa050143 | Colorectum | SER | Amyotrophic lateral sclerosis | 138/1580 | 364/8465 | 9.89e-19 | 2.99e-17 | 2.17e-17 | 138 |
| hsa050224 | Colorectum | MSS | Pathways of neurodegeneration - multiple diseases | 192/1875 | 476/8465 | 2.79e-20 | 1.04e-18 | 6.36e-19 | 192 |
| hsa050144 | Colorectum | MSS | Amyotrophic lateral sclerosis | 156/1875 | 364/8465 | 1.43e-19 | 4.62e-18 | 2.83e-18 | 156 |
| hsa050225 | Colorectum | MSS | Pathways of neurodegeneration - multiple diseases | 192/1875 | 476/8465 | 2.79e-20 | 1.04e-18 | 6.36e-19 | 192 |
| hsa050145 | Colorectum | MSS | Amyotrophic lateral sclerosis | 156/1875 | 364/8465 | 1.43e-19 | 4.62e-18 | 2.83e-18 | 156 |
| hsa050146 | Colorectum | MSI-H | Amyotrophic lateral sclerosis | 95/797 | 364/8465 | 2.31e-21 | 1.50e-19 | 1.26e-19 | 95 |
| hsa050226 | Colorectum | MSI-H | Pathways of neurodegeneration - multiple diseases | 107/797 | 476/8465 | 1.24e-18 | 5.72e-17 | 4.80e-17 | 107 |
| hsa050147 | Colorectum | MSI-H | Amyotrophic lateral sclerosis | 95/797 | 364/8465 | 2.31e-21 | 1.50e-19 | 1.26e-19 | 95 |
| hsa050227 | Colorectum | MSI-H | Pathways of neurodegeneration - multiple diseases | 107/797 | 476/8465 | 1.24e-18 | 5.72e-17 | 4.80e-17 | 107 |
| hsa0501430 | Esophagus | HGIN | Amyotrophic lateral sclerosis | 140/1383 | 364/8465 | 2.13e-25 | 1.16e-23 | 9.19e-24 | 140 |
| hsa0502230 | Esophagus | HGIN | Pathways of neurodegeneration - multiple diseases | 153/1383 | 476/8465 | 1.22e-18 | 4.41e-17 | 3.50e-17 | 153 |
| Page: 1 2 3 |
Top |
Cell-cell communication analysis |
| Identification of potential cell-cell interactions between two cell types and their ligand-receptor pairs for different disease states |
| Ligand | Receptor | LRpair | Pathway | Tissue | Disease Stage |
| Page: 1 |
Top |
Single-cell gene regulatory network inference analysis |
| Find out the significant the regulons (TFs) and the target genes of each regulon across cell types for different disease states |
| TF | Cell Type | Tissue | Disease Stage | Target Gene | RSS | Regulon Activity |
| ∗The dot plots of a searched regulon are shown for all cell subpopulations in each disease state of each tissue based on the regulon specific score inferred using pySCENIC and by calculating the average expression. |
| Page: 1 |
Top |
Somatic mutation of malignant transformation related genes |
| Annotation of somatic variants for genes involved in malignant transformation |
| Hugo Symbol | Variant Class | Variant Classification | dbSNP RS | HGVSc | HGVSp | HGVSp Short | SWISSPROT | BIOTYPE | SIFT | PolyPhen | Tumor Sample Barcode | Tissue | Histology | Sex | Age | Stage | Therapy Types | Drugs | Outcome |
| TARDBP | SNV | Missense_Mutation | c.962N>T | p.Ala321Val | p.A321V | Q13148 | protein_coding | tolerated(0.06) | benign(0.003) | TCGA-A8-A06X-01 | Breast | breast invasive carcinoma | Female | >=65 | I/II | Unknown | Unknown | SD | |
| TARDBP | SNV | Missense_Mutation | novel | c.253A>G | p.Met85Val | p.M85V | Q13148 | protein_coding | tolerated(0.62) | benign(0.041) | TCGA-JL-A3YW-01 | Breast | breast invasive carcinoma | Female | <65 | I/II | Unknown | Unknown | SD |
| TARDBP | SNV | Missense_Mutation | novel | c.524G>A | p.Cys175Tyr | p.C175Y | Q13148 | protein_coding | tolerated(0.06) | benign(0.003) | TCGA-2W-A8YY-01 | Cervix | cervical & endocervical cancer | Female | <65 | I/II | Chemotherapy | cisplatin | CR |
| TARDBP | SNV | Missense_Mutation | c.59N>T | p.Ser20Leu | p.S20L | Q13148 | protein_coding | tolerated(0.43) | benign(0.007) | TCGA-DR-A0ZM-01 | Cervix | cervical & endocervical cancer | Female | <65 | III/IV | Unspecific | Cisplatin | SD | |
| TARDBP | SNV | Missense_Mutation | c.1177N>C | p.Ser393Pro | p.S393P | Q13148 | protein_coding | tolerated(0.12) | benign(0.245) | TCGA-A6-6780-01 | Colorectum | colon adenocarcinoma | Male | >=65 | I/II | Unknown | Unknown | SD | |
| TARDBP | SNV | Missense_Mutation | novel | c.595A>G | p.Thr199Ala | p.T199A | Q13148 | protein_coding | deleterious(0.02) | probably_damaging(0.909) | TCGA-AA-A01D-01 | Colorectum | colon adenocarcinoma | Female | <65 | III/IV | Chemotherapy | capecitabine | PD |
| TARDBP | SNV | Missense_Mutation | c.557N>T | p.Glu186Val | p.E186V | Q13148 | protein_coding | tolerated(0.22) | benign(0.037) | TCGA-AA-A01R-01 | Colorectum | colon adenocarcinoma | Male | <65 | III/IV | Chemotherapy | 5-fluorouracil | PD | |
| TARDBP | SNV | Missense_Mutation | novel | c.313G>A | p.Asp105Asn | p.D105N | Q13148 | protein_coding | deleterious(0.04) | probably_damaging(0.971) | TCGA-AZ-4315-01 | Colorectum | colon adenocarcinoma | Male | <65 | I/II | Unknown | Unknown | SD |
| TARDBP | SNV | Missense_Mutation | novel | c.313N>A | p.Asp105Asn | p.D105N | Q13148 | protein_coding | deleterious(0.04) | probably_damaging(0.971) | TCGA-CA-6717-01 | Colorectum | colon adenocarcinoma | Male | <65 | I/II | Chemotherapy | oxaliplatin | CR |
| TARDBP | SNV | Missense_Mutation | novel | c.691T>C | p.Phe231Leu | p.F231L | Q13148 | protein_coding | deleterious(0.02) | possibly_damaging(0.656) | TCGA-AG-3726-01 | Colorectum | rectum adenocarcinoma | Female | <65 | I/II | Unknown | Unknown | SD |
| Page: 1 2 3 4 |
Top |
Related drugs of malignant transformation related genes |
| Identification of chemicals and drugs interact with genes involved in malignant transfromation |
| (DGIdb 4.0) |
| Entrez ID | Symbol | Category | Interaction Types | Drug Claim Name | Drug Name | PMIDs |
| 23435 | TARDBP | TUMOR SUPPRESSOR | 1,7-O-DIACETYLMETHYLGEOPYXIN A | CHEMBL1889303 | ||
| 23435 | TARDBP | TUMOR SUPPRESSOR | GNF-PF-78 | CHEMBL579318 | ||
| 23435 | TARDBP | TUMOR SUPPRESSOR | SJ000032149 | CHEMBL600778 | ||
| 23435 | TARDBP | TUMOR SUPPRESSOR | GNF-PF-159 | CHEMBL599924 | ||
| 23435 | TARDBP | TUMOR SUPPRESSOR | SJ000260153 | CHEMBL589717 | ||
| 23435 | TARDBP | TUMOR SUPPRESSOR | DNDI1416982 | CHEMBL1479114 | ||
| 23435 | TARDBP | TUMOR SUPPRESSOR | DEXIBUPROFEN | DEXIBUPROFEN | ||
| 23435 | TARDBP | TUMOR SUPPRESSOR | NSC-407228 | CHEMBL74852 | ||
| 23435 | TARDBP | TUMOR SUPPRESSOR | TCMDC-123862 | CHEMBL533074 | ||
| 23435 | TARDBP | TUMOR SUPPRESSOR | 3-PHENYLUMBELLIFERONE | CHEMBL153505 |
| Page: 1 2 3 4 5 6 7 8 9 10 11 12 |

Copyright 2023-Present -The University of Texas Health Science Center at Houston |