
|
|||||
|
 | |
| |
| |
| |
| |
| |
|
Gene: TAPT1 |
Gene summary for TAPT1 |
| Gene information | Species | Human | Gene symbol | TAPT1 | Gene ID | 202018 |
| Gene name | transmembrane anterior posterior transformation 1 | |
| Gene Alias | CMVFR | |
| Cytomap | 4p15.32 | |
| Gene Type | protein-coding | GO ID | GO:0001501 | UniProtAcc | Q6NXT6 |
Top |
Malignant transformation analysis |
| Identification of the aberrant gene expression in precancerous and cancerous lesions by comparing the gene expression of stem-like cells in diseased tissues with normal stem cells |
| Entrez ID | Symbol | Replicates | Species | Organ | Tissue | Adj P-value | Log2FC | Malignancy |
| 202018 | TAPT1 | TD9 | Human | Lung | IAC | 2.87e-02 | 8.84e-01 | 0.088 |
| 202018 | TAPT1 | RNA-P10T2-P10T2-1 | Human | Lung | AAH | 1.03e-02 | 6.62e-01 | -0.1271 |
| 202018 | TAPT1 | RNA-P25T1-P25T1-1 | Human | Lung | AIS | 4.11e-10 | 5.16e-01 | -0.2116 |
| 202018 | TAPT1 | RNA-P25T1-P25T1-2 | Human | Lung | AIS | 3.91e-08 | 7.92e-01 | -0.1941 |
| 202018 | TAPT1 | RNA-P25T1-P25T1-3 | Human | Lung | AIS | 2.49e-07 | 6.84e-01 | -0.2107 |
| 202018 | TAPT1 | RNA-P25T1-P25T1-4 | Human | Lung | AIS | 5.34e-11 | 6.56e-01 | -0.2119 |
| 202018 | TAPT1 | RNA-P6T1-P6T1-4 | Human | Lung | MIAC | 3.02e-02 | 3.95e-01 | -0.0263 |
| 202018 | TAPT1 | RNA-P6T2-P6T2-1 | Human | Lung | IAC | 3.85e-11 | 4.23e-01 | -0.0166 |
| 202018 | TAPT1 | RNA-P6T2-P6T2-2 | Human | Lung | IAC | 3.80e-20 | 5.71e-01 | -0.0132 |
| 202018 | TAPT1 | RNA-P6T2-P6T2-3 | Human | Lung | IAC | 1.71e-20 | 5.60e-01 | -0.013 |
| 202018 | TAPT1 | RNA-P6T2-P6T2-4 | Human | Lung | IAC | 2.85e-15 | 5.28e-01 | -0.0121 |
| 202018 | TAPT1 | RNA-P7T1-P7T1-1 | Human | Lung | AIS | 1.66e-05 | 6.95e-01 | -0.0961 |
| 202018 | TAPT1 | RNA-P7T1-P7T1-2 | Human | Lung | AIS | 5.11e-05 | 6.64e-01 | -0.0876 |
| 202018 | TAPT1 | RNA-P7T1-P7T1-3 | Human | Lung | AIS | 1.66e-04 | 7.35e-01 | -0.0822 |
| 202018 | TAPT1 | RNA-P7T1-P7T1-4 | Human | Lung | AIS | 2.49e-07 | 7.50e-01 | -0.0809 |
| 202018 | TAPT1 | HTA12-15-2 | Human | Pancreas | PDAC | 2.82e-04 | 3.85e-01 | 0.2315 |
| 202018 | TAPT1 | HTA12-26-1 | Human | Pancreas | PDAC | 1.35e-03 | 3.19e-01 | 0.3728 |
| 202018 | TAPT1 | HTA12-29-1 | Human | Pancreas | PDAC | 1.32e-25 | 6.14e-01 | 0.3722 |
| 202018 | TAPT1 | HTA12-32-1 | Human | Pancreas | PDAC | 1.22e-02 | 8.17e-01 | 0.3624 |
| Page: 1 |
| Tissue | Expression Dynamics | Abbreviation |
| Lung | 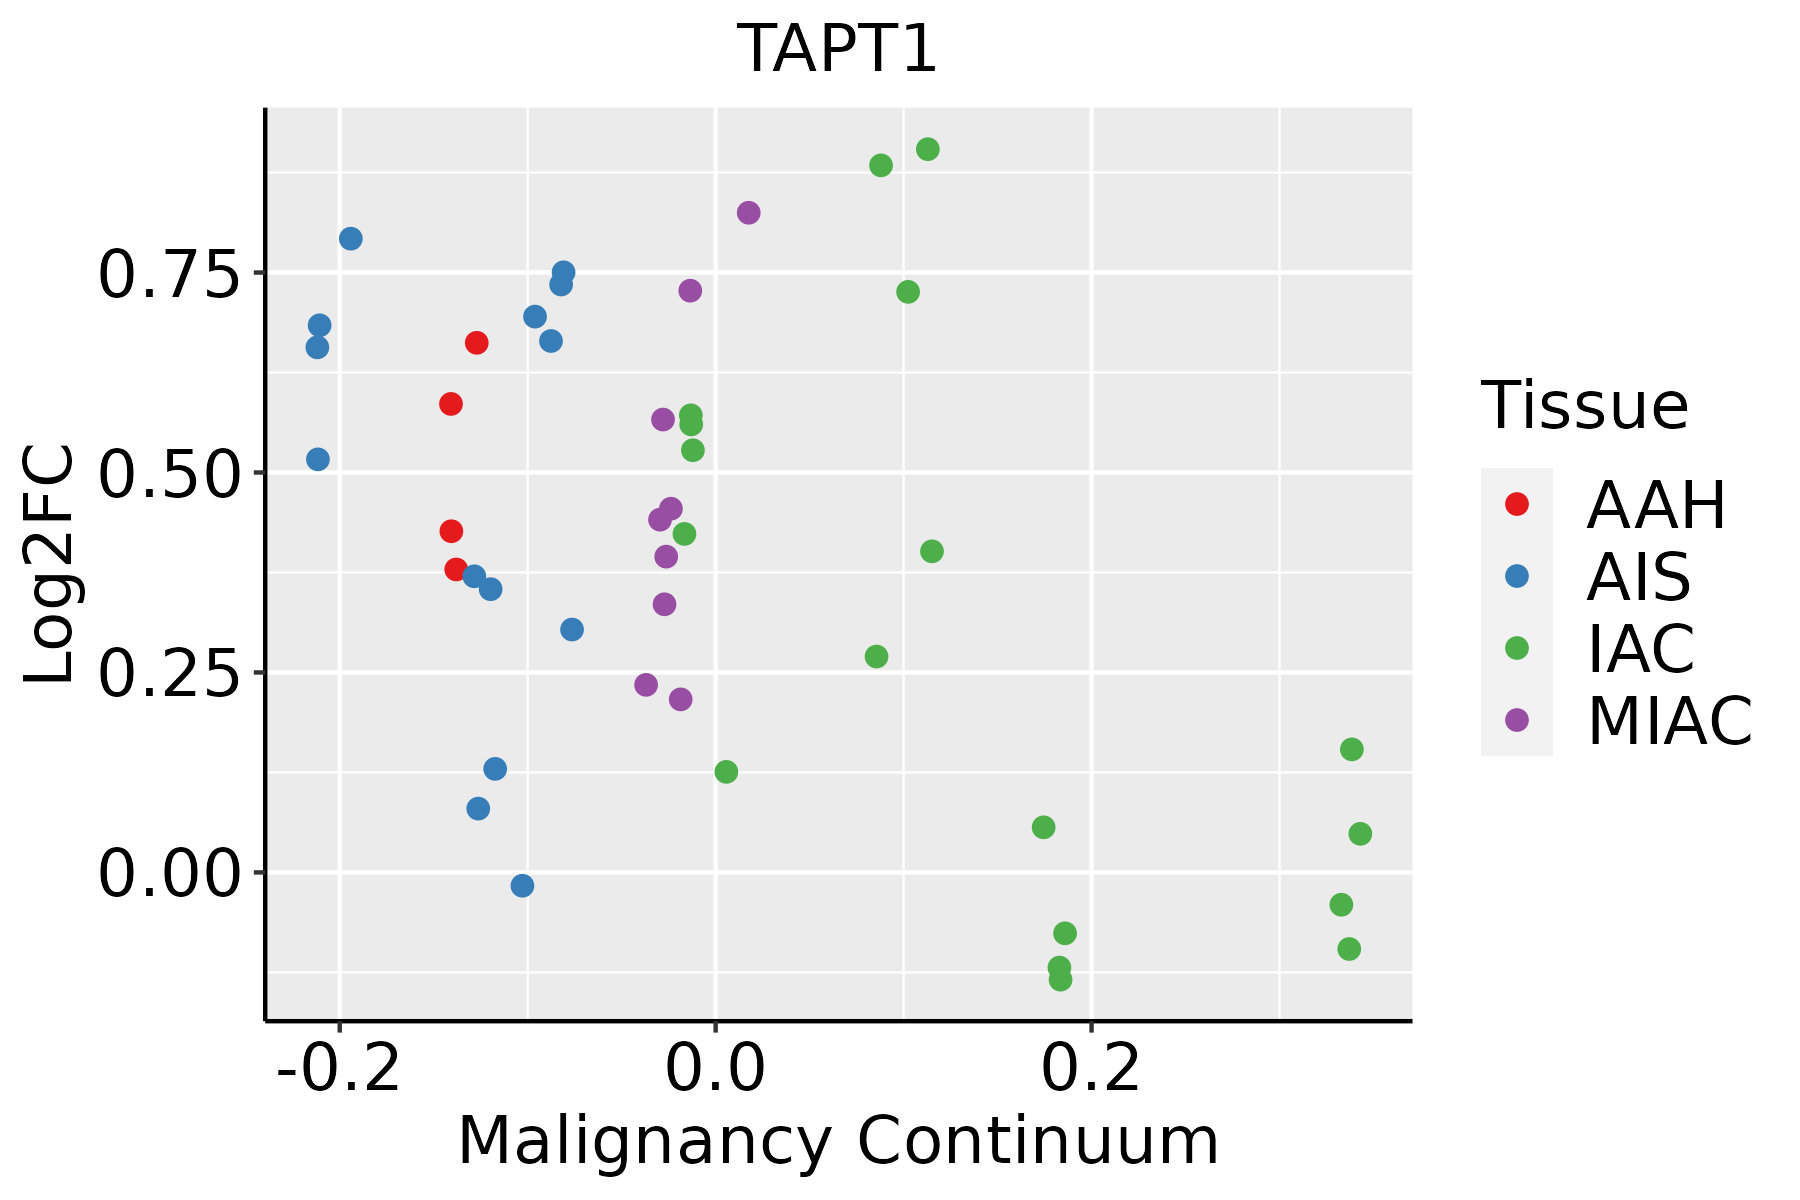 | AAH: Atypical adenomatous hyperplasia |
| AIS: Adenocarcinoma in situ | ||
| IAC: Invasive lung adenocarcinoma | ||
| MIA: Minimally invasive adenocarcinoma |
| ∗log2FC in expression of this searched gene in stem-like cells from each diseased tissue sample relative to stem-like cells in normal samples in each tissue plotted against the malignancy continuum. Samples are colored based on if they are from different disease stage. |
Top |
Malignant transformation related pathway analysis |
| Find out the enriched GO biological processes and KEGG pathways involved in transition from healthy to precancer to cancer |
| Tissue | Disease Stage | Enriched GO biological Processes |
| Colorectum | AD |  |
| Colorectum | SER |  |
| Colorectum | MSS |  |
| Colorectum | MSI-H |  |
| Colorectum | FAP |  |
| ∗Top 15 enriched GO BP terms are showed in the bar plot of each disease state in each tissue. Each row represents a significant GO biological process which is colored according to the -log10(p.adjust). |
| Page: 1 2 3 4 5 6 7 8 9 |
| GO ID | Tissue | Disease Stage | Description | Gene Ratio | Bg Ratio | pvalue | p.adjust | Count |
| GO:01200327 | Lung | IAC | regulation of plasma membrane bounded cell projection assembly | 39/2061 | 186/18723 | 5.41e-05 | 1.21e-03 | 39 |
| GO:00604916 | Lung | IAC | regulation of cell projection assembly | 39/2061 | 188/18723 | 6.92e-05 | 1.47e-03 | 39 |
| GO:00313466 | Lung | IAC | positive regulation of cell projection organization | 63/2061 | 353/18723 | 7.37e-05 | 1.55e-03 | 63 |
| GO:00512357 | Lung | IAC | maintenance of location | 58/2061 | 327/18723 | 1.66e-04 | 2.96e-03 | 58 |
| GO:19021152 | Lung | IAC | regulation of organelle assembly | 37/2061 | 186/18723 | 2.55e-04 | 4.26e-03 | 37 |
| GO:00488633 | Lung | IAC | stem cell differentiation | 38/2061 | 206/18723 | 9.79e-04 | 1.18e-02 | 38 |
| GO:00516518 | Lung | IAC | maintenance of location in cell | 39/2061 | 214/18723 | 1.07e-03 | 1.26e-02 | 39 |
| GO:0060271 | Lung | IAC | cilium assembly | 55/2061 | 337/18723 | 1.84e-03 | 1.88e-02 | 55 |
| GO:0044782 | Lung | IAC | cilium organization | 58/2061 | 368/18723 | 3.15e-03 | 2.75e-02 | 58 |
| GO:00325075 | Lung | IAC | maintenance of protein location in cell | 15/2061 | 65/18723 | 4.02e-03 | 3.30e-02 | 15 |
| GO:00604852 | Lung | IAC | mesenchyme development | 47/2061 | 291/18723 | 4.61e-03 | 3.64e-02 | 47 |
| GO:00451858 | Lung | IAC | maintenance of protein location | 19/2061 | 94/18723 | 6.26e-03 | 4.48e-02 | 19 |
| GO:00487623 | Lung | IAC | mesenchymal cell differentiation | 39/2061 | 236/18723 | 6.33e-03 | 4.51e-02 | 39 |
| GO:012003213 | Lung | AIS | regulation of plasma membrane bounded cell projection assembly | 37/1849 | 186/18723 | 2.67e-05 | 8.60e-04 | 37 |
| GO:006049113 | Lung | AIS | regulation of cell projection assembly | 37/1849 | 188/18723 | 3.41e-05 | 1.05e-03 | 37 |
| GO:004886312 | Lung | AIS | stem cell differentiation | 39/1849 | 206/18723 | 5.25e-05 | 1.51e-03 | 39 |
| GO:005123512 | Lung | AIS | maintenance of location | 55/1849 | 327/18723 | 5.93e-05 | 1.65e-03 | 55 |
| GO:005165113 | Lung | AIS | maintenance of location in cell | 39/1849 | 214/18723 | 1.23e-04 | 2.81e-03 | 39 |
| GO:003134612 | Lung | AIS | positive regulation of cell projection organization | 57/1849 | 353/18723 | 1.38e-04 | 3.05e-03 | 57 |
| GO:190211511 | Lung | AIS | regulation of organelle assembly | 34/1849 | 186/18723 | 3.06e-04 | 5.62e-03 | 34 |
| Page: 1 2 |
| Pathway ID | Tissue | Disease Stage | Description | Gene Ratio | Bg Ratio | pvalue | p.adjust | qvalue | Count |
| Page: 1 |
Top |
Cell-cell communication analysis |
| Identification of potential cell-cell interactions between two cell types and their ligand-receptor pairs for different disease states |
| Ligand | Receptor | LRpair | Pathway | Tissue | Disease Stage |
| Page: 1 |
Top |
Single-cell gene regulatory network inference analysis |
| Find out the significant the regulons (TFs) and the target genes of each regulon across cell types for different disease states |
| TF | Cell Type | Tissue | Disease Stage | Target Gene | RSS | Regulon Activity |
| ∗The dot plots of a searched regulon are shown for all cell subpopulations in each disease state of each tissue based on the regulon specific score inferred using pySCENIC and by calculating the average expression. |
| Page: 1 |
Top |
Somatic mutation of malignant transformation related genes |
| Annotation of somatic variants for genes involved in malignant transformation |
| Hugo Symbol | Variant Class | Variant Classification | dbSNP RS | HGVSc | HGVSp | HGVSp Short | SWISSPROT | BIOTYPE | SIFT | PolyPhen | Tumor Sample Barcode | Tissue | Histology | Sex | Age | Stage | Therapy Types | Drugs | Outcome |
| TAPT1 | SNV | Missense_Mutation | c.1045N>C | p.Glu349Gln | p.E349Q | Q6NXT6 | protein_coding | deleterious(0) | probably_damaging(0.996) | TCGA-AC-A23H-01 | Breast | breast invasive carcinoma | Female | >=65 | I/II | Unknown | Unknown | PD | |
| TAPT1 | SNV | Missense_Mutation | c.1054N>A | p.Val352Met | p.V352M | Q6NXT6 | protein_coding | deleterious(0) | probably_damaging(0.999) | TCGA-AR-A1AI-01 | Breast | breast invasive carcinoma | Female | <65 | I/II | Chemotherapy | cytoxan | PD | |
| TAPT1 | SNV | Missense_Mutation | c.1574N>G | p.Gln525Arg | p.Q525R | Q6NXT6 | protein_coding | tolerated(0.19) | benign(0.057) | TCGA-D8-A1XQ-01 | Breast | breast invasive carcinoma | Female | >=65 | I/II | Unknown | Unknown | SD | |
| TAPT1 | SNV | Missense_Mutation | c.1545A>G | p.Ile515Met | p.I515M | Q6NXT6 | protein_coding | tolerated(0.2) | benign(0.062) | TCGA-2W-A8YY-01 | Cervix | cervical & endocervical cancer | Female | <65 | I/II | Chemotherapy | cisplatin | CR | |
| TAPT1 | SNV | Missense_Mutation | novel | c.1175N>T | p.Thr392Ile | p.T392I | Q6NXT6 | protein_coding | deleterious(0.04) | probably_damaging(0.998) | TCGA-C5-A8XI-01 | Cervix | cervical & endocervical cancer | Female | >=65 | I/II | Chemotherapy | cisplatin | SD |
| TAPT1 | SNV | Missense_Mutation | novel | c.1307N>G | p.Tyr436Cys | p.Y436C | Q6NXT6 | protein_coding | deleterious(0.01) | probably_damaging(0.999) | TCGA-VS-A9V0-01 | Cervix | cervical & endocervical cancer | Female | <65 | I/II | Chemotherapy | cisplatin | PD |
| TAPT1 | SNV | Missense_Mutation | novel | c.635C>A | p.Ser212Tyr | p.S212Y | Q6NXT6 | protein_coding | deleterious(0) | probably_damaging(0.998) | TCGA-A6-6141-01 | Colorectum | colon adenocarcinoma | Male | <65 | I/II | Chemotherapy | 5-fu | SD |
| TAPT1 | SNV | Missense_Mutation | c.754N>T | p.His252Tyr | p.H252Y | Q6NXT6 | protein_coding | deleterious(0) | probably_damaging(0.992) | TCGA-AA-3833-01 | Colorectum | colon adenocarcinoma | Female | <65 | I/II | Unknown | Unknown | SD | |
| TAPT1 | SNV | Missense_Mutation | novel | c.706N>C | p.Ile236Leu | p.I236L | Q6NXT6 | protein_coding | tolerated(0.57) | benign(0.022) | TCGA-AA-3947-01 | Colorectum | colon adenocarcinoma | Female | <65 | I/II | Unknown | Unknown | SD |
| TAPT1 | SNV | Missense_Mutation | rs756174108 | c.269N>G | p.Lys90Arg | p.K90R | Q6NXT6 | protein_coding | tolerated(1) | probably_damaging(0.971) | TCGA-AD-5900-01 | Colorectum | colon adenocarcinoma | Male | >=65 | I/II | Unknown | Unknown | SD |
| Page: 1 2 3 4 5 |
Top |
Related drugs of malignant transformation related genes |
| Identification of chemicals and drugs interact with genes involved in malignant transfromation |
| (DGIdb 4.0) |
| Entrez ID | Symbol | Category | Interaction Types | Drug Claim Name | Drug Name | PMIDs |
| Page: 1 |

Copyright 2023-Present -The University of Texas Health Science Center at Houston |