
|
|||||
|
 | |
| |
| |
| |
| |
| |
|
Gene: TAPBP |
Gene summary for TAPBP |
| Gene information | Species | Human | Gene symbol | TAPBP | Gene ID | 6892 |
| Gene name | TAP binding protein | |
| Gene Alias | NGS17 | |
| Cytomap | 6p21.32 | |
| Gene Type | protein-coding | GO ID | GO:0002376 | UniProtAcc | A0A024RCT1 |
Top |
Malignant transformation analysis |
| Identification of the aberrant gene expression in precancerous and cancerous lesions by comparing the gene expression of stem-like cells in diseased tissues with normal stem cells |
| Entrez ID | Symbol | Replicates | Species | Organ | Tissue | Adj P-value | Log2FC | Malignancy |
| 6892 | TAPBP | CA_HPV_1 | Human | Cervix | CC | 1.18e-07 | 1.49e-01 | 0.0264 |
| 6892 | TAPBP | CA_HPV_3 | Human | Cervix | CC | 1.33e-02 | 3.98e-03 | 0.0414 |
| 6892 | TAPBP | N_HPV_2 | Human | Cervix | N_HPV | 3.60e-03 | 8.95e-02 | -0.0131 |
| 6892 | TAPBP | CCI_2 | Human | Cervix | CC | 2.35e-03 | 8.12e-01 | 0.5249 |
| 6892 | TAPBP | CCII_1 | Human | Cervix | CC | 3.69e-09 | -5.36e-01 | 0.3249 |
| 6892 | TAPBP | Tumor | Human | Cervix | CC | 2.77e-09 | 3.66e-01 | 0.1241 |
| 6892 | TAPBP | sample3 | Human | Cervix | CC | 1.54e-07 | 3.34e-01 | 0.1387 |
| 6892 | TAPBP | L1 | Human | Cervix | CC | 5.89e-05 | -3.09e-01 | 0.0802 |
| 6892 | TAPBP | T1 | Human | Cervix | CC | 1.65e-03 | 3.61e-01 | 0.0918 |
| 6892 | TAPBP | T3 | Human | Cervix | CC | 6.75e-06 | 3.20e-01 | 0.1389 |
| 6892 | TAPBP | HTA11_3410_2000001011 | Human | Colorectum | AD | 1.15e-10 | 4.46e-01 | 0.0155 |
| 6892 | TAPBP | HTA11_2487_2000001011 | Human | Colorectum | SER | 6.79e-19 | 1.01e+00 | -0.1808 |
| 6892 | TAPBP | HTA11_1938_2000001011 | Human | Colorectum | AD | 3.16e-16 | 8.87e-01 | -0.0811 |
| 6892 | TAPBP | HTA11_78_2000001011 | Human | Colorectum | AD | 9.56e-04 | 3.96e-01 | -0.1088 |
| 6892 | TAPBP | HTA11_347_2000001011 | Human | Colorectum | AD | 7.26e-30 | 9.05e-01 | -0.1954 |
| 6892 | TAPBP | HTA11_411_2000001011 | Human | Colorectum | SER | 1.15e-06 | 1.18e+00 | -0.2602 |
| 6892 | TAPBP | HTA11_2112_2000001011 | Human | Colorectum | SER | 1.58e-09 | 1.17e+00 | -0.2196 |
| 6892 | TAPBP | HTA11_3361_2000001011 | Human | Colorectum | AD | 5.59e-10 | 7.16e-01 | -0.1207 |
| 6892 | TAPBP | HTA11_83_2000001011 | Human | Colorectum | SER | 9.42e-07 | 6.44e-01 | -0.1526 |
| 6892 | TAPBP | HTA11_696_2000001011 | Human | Colorectum | AD | 2.55e-34 | 9.96e-01 | -0.1464 |
| Page: 1 2 3 4 5 6 7 8 9 10 11 |
| Tissue | Expression Dynamics | Abbreviation |
| Cervix | 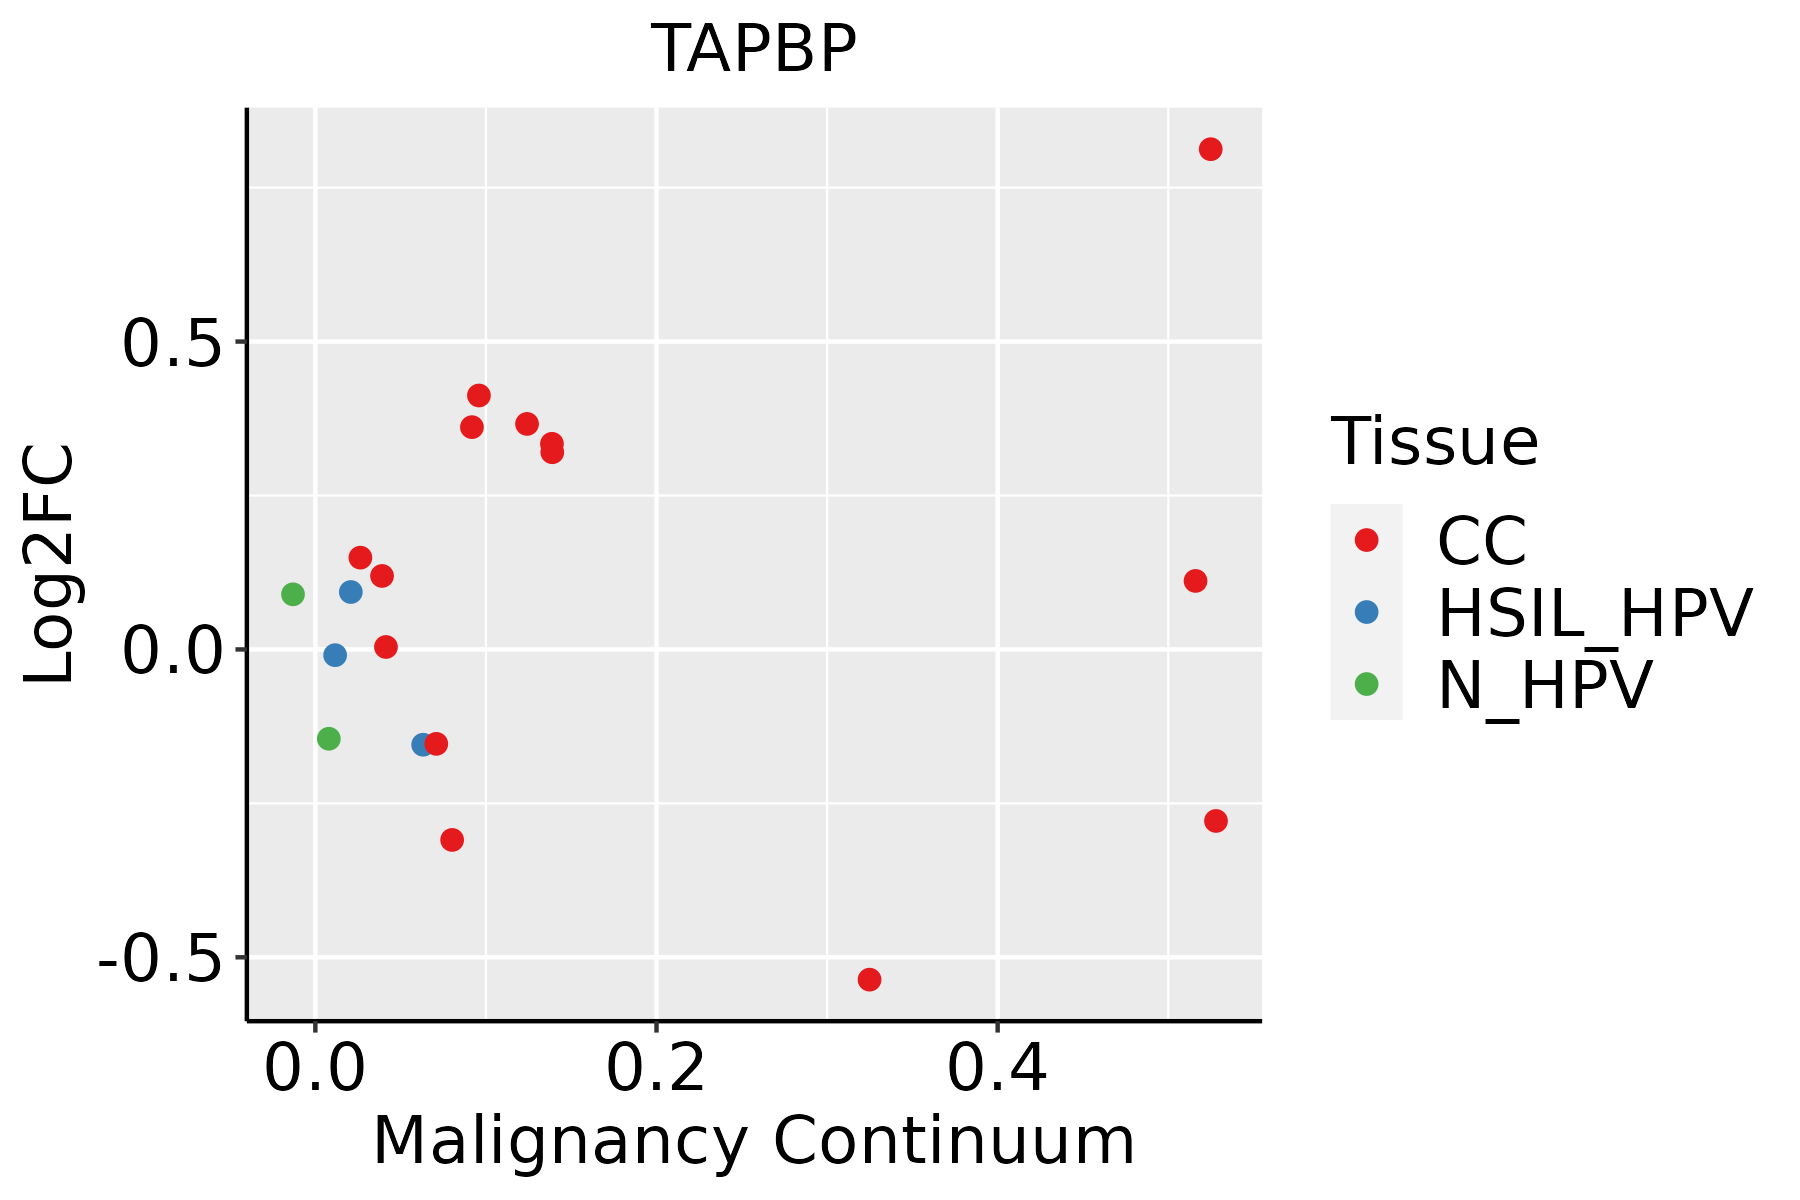 | CC: Cervix cancer |
| HSIL_HPV: HPV-infected high-grade squamous intraepithelial lesions | ||
| N_HPV: HPV-infected normal cervix | ||
| Colorectum (GSE201348) |  | FAP: Familial adenomatous polyposis |
| CRC: Colorectal cancer | ||
| Colorectum (HTA11) |  | AD: Adenomas |
| SER: Sessile serrated lesions | ||
| MSI-H: Microsatellite-high colorectal cancer | ||
| MSS: Microsatellite stable colorectal cancer | ||
| Esophagus |  | ESCC: Esophageal squamous cell carcinoma |
| HGIN: High-grade intraepithelial neoplasias | ||
| LGIN: Low-grade intraepithelial neoplasias | ||
| GC | 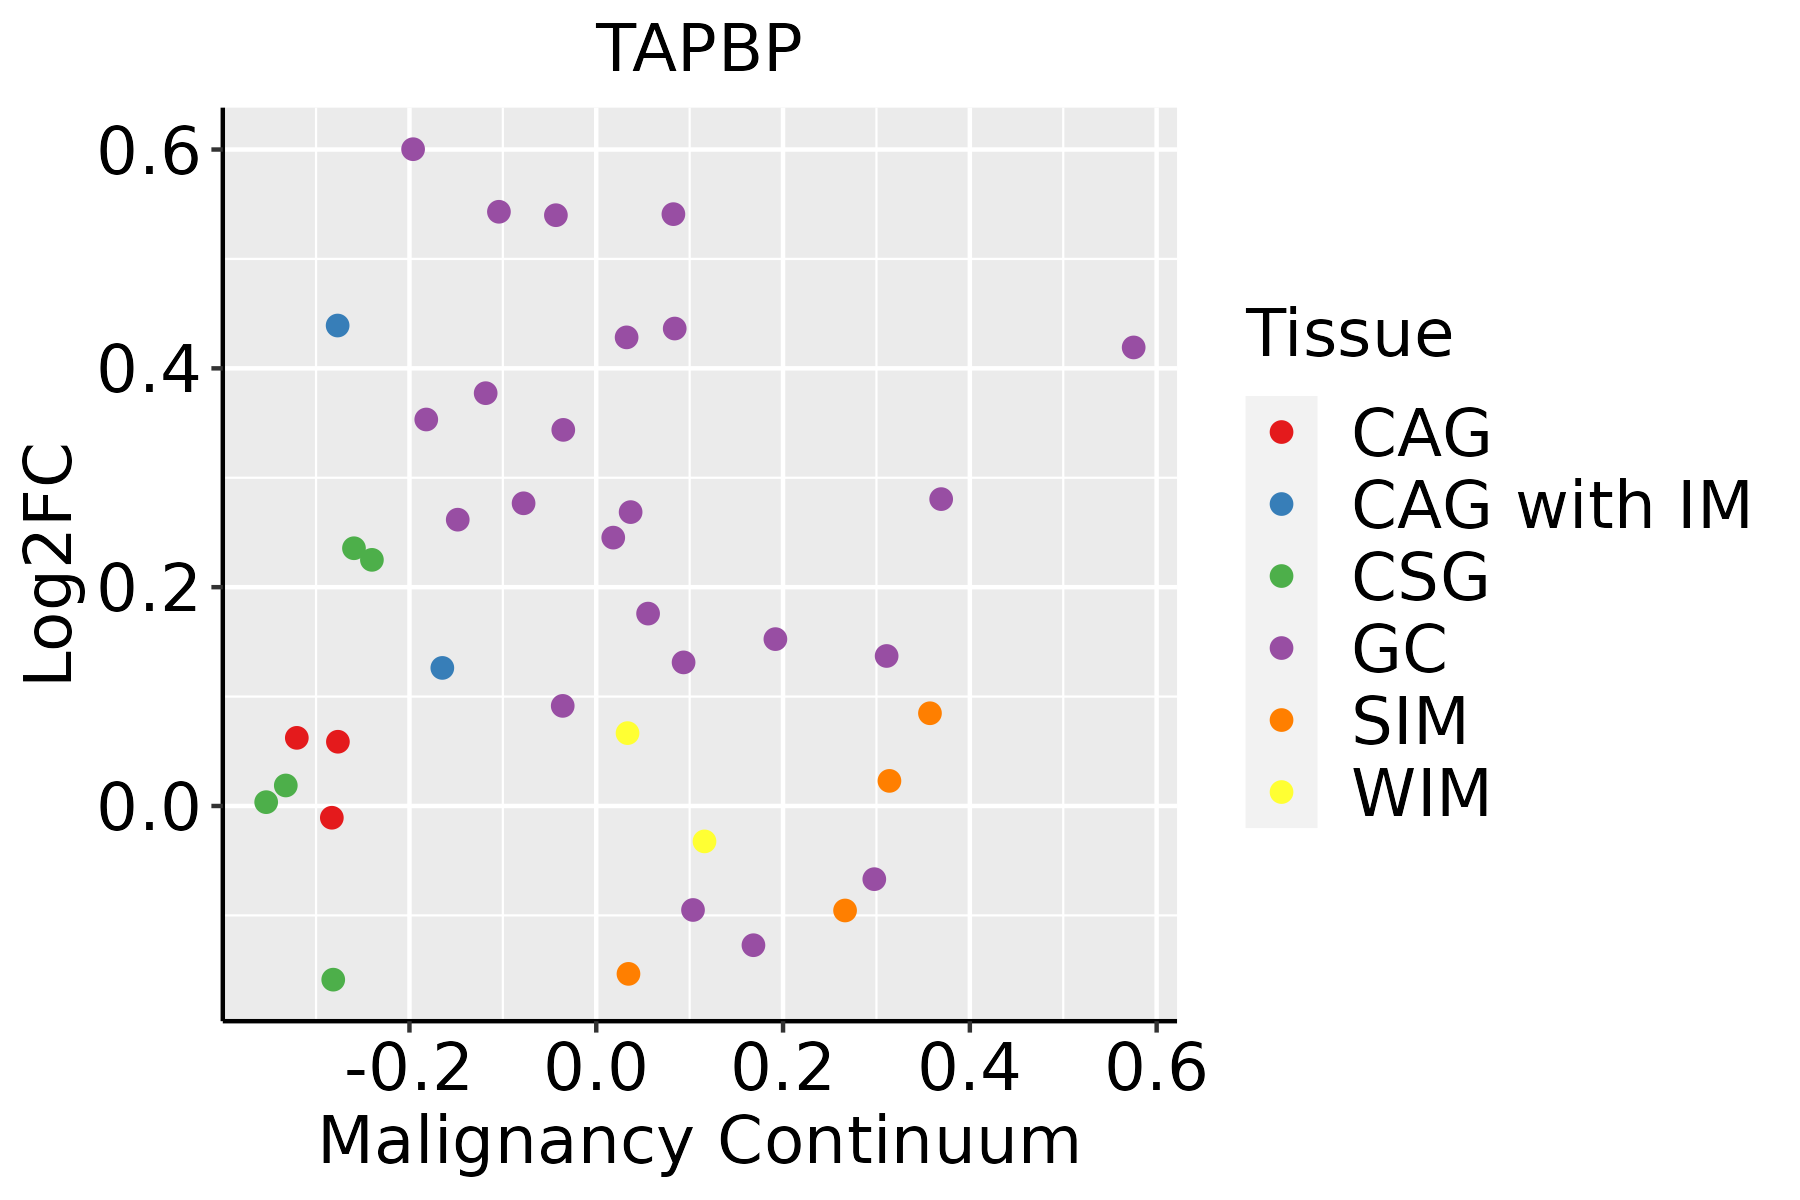 | CAG: Chronic atrophic gastritis |
| CAG with IM: Chronic atrophic gastritis with intestinal metaplasia | ||
| CSG: Chronic superficial gastritis | ||
| GC: Gastric cancer | ||
| SIM: Severe intestinal metaplasia | ||
| WIM: Wild intestinal metaplasia | ||
| Liver | 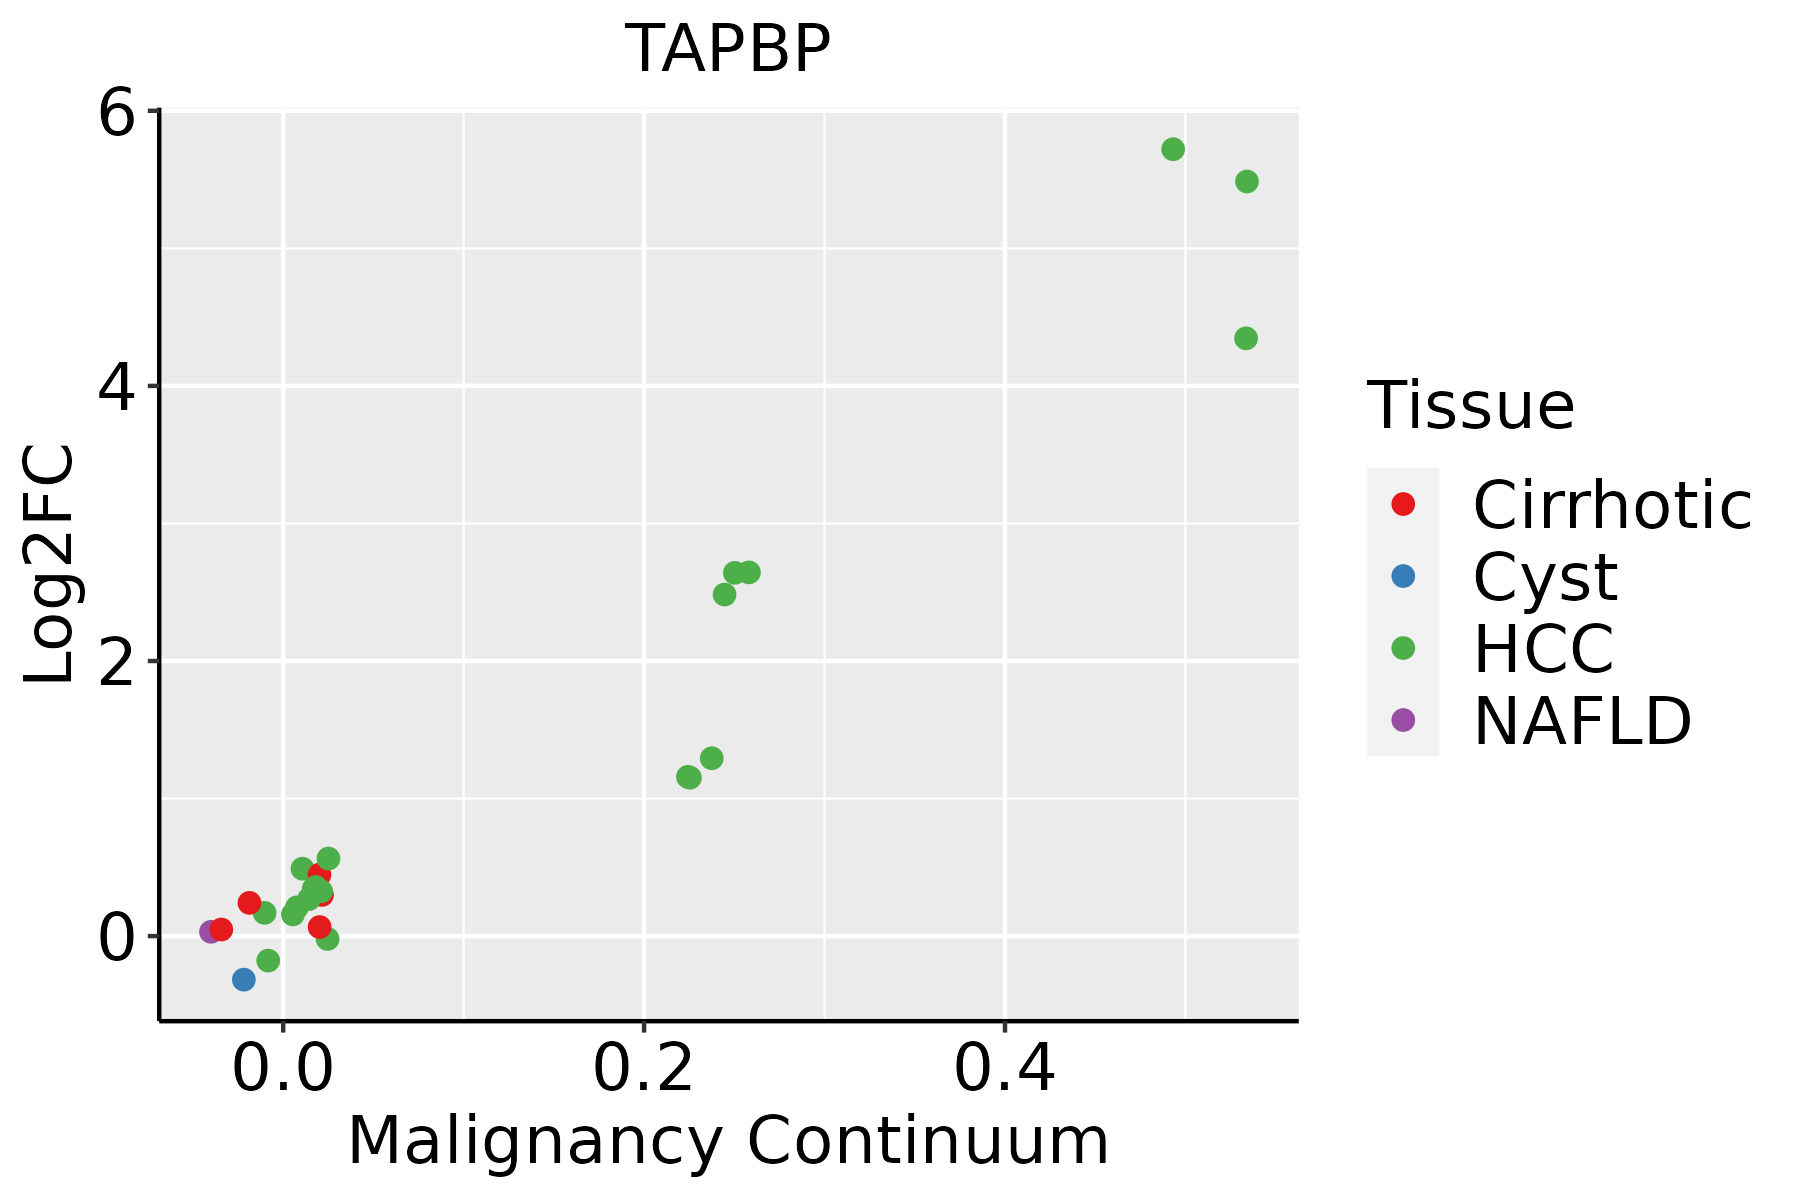 | HCC: Hepatocellular carcinoma |
| NAFLD: Non-alcoholic fatty liver disease | ||
| Oral Cavity | 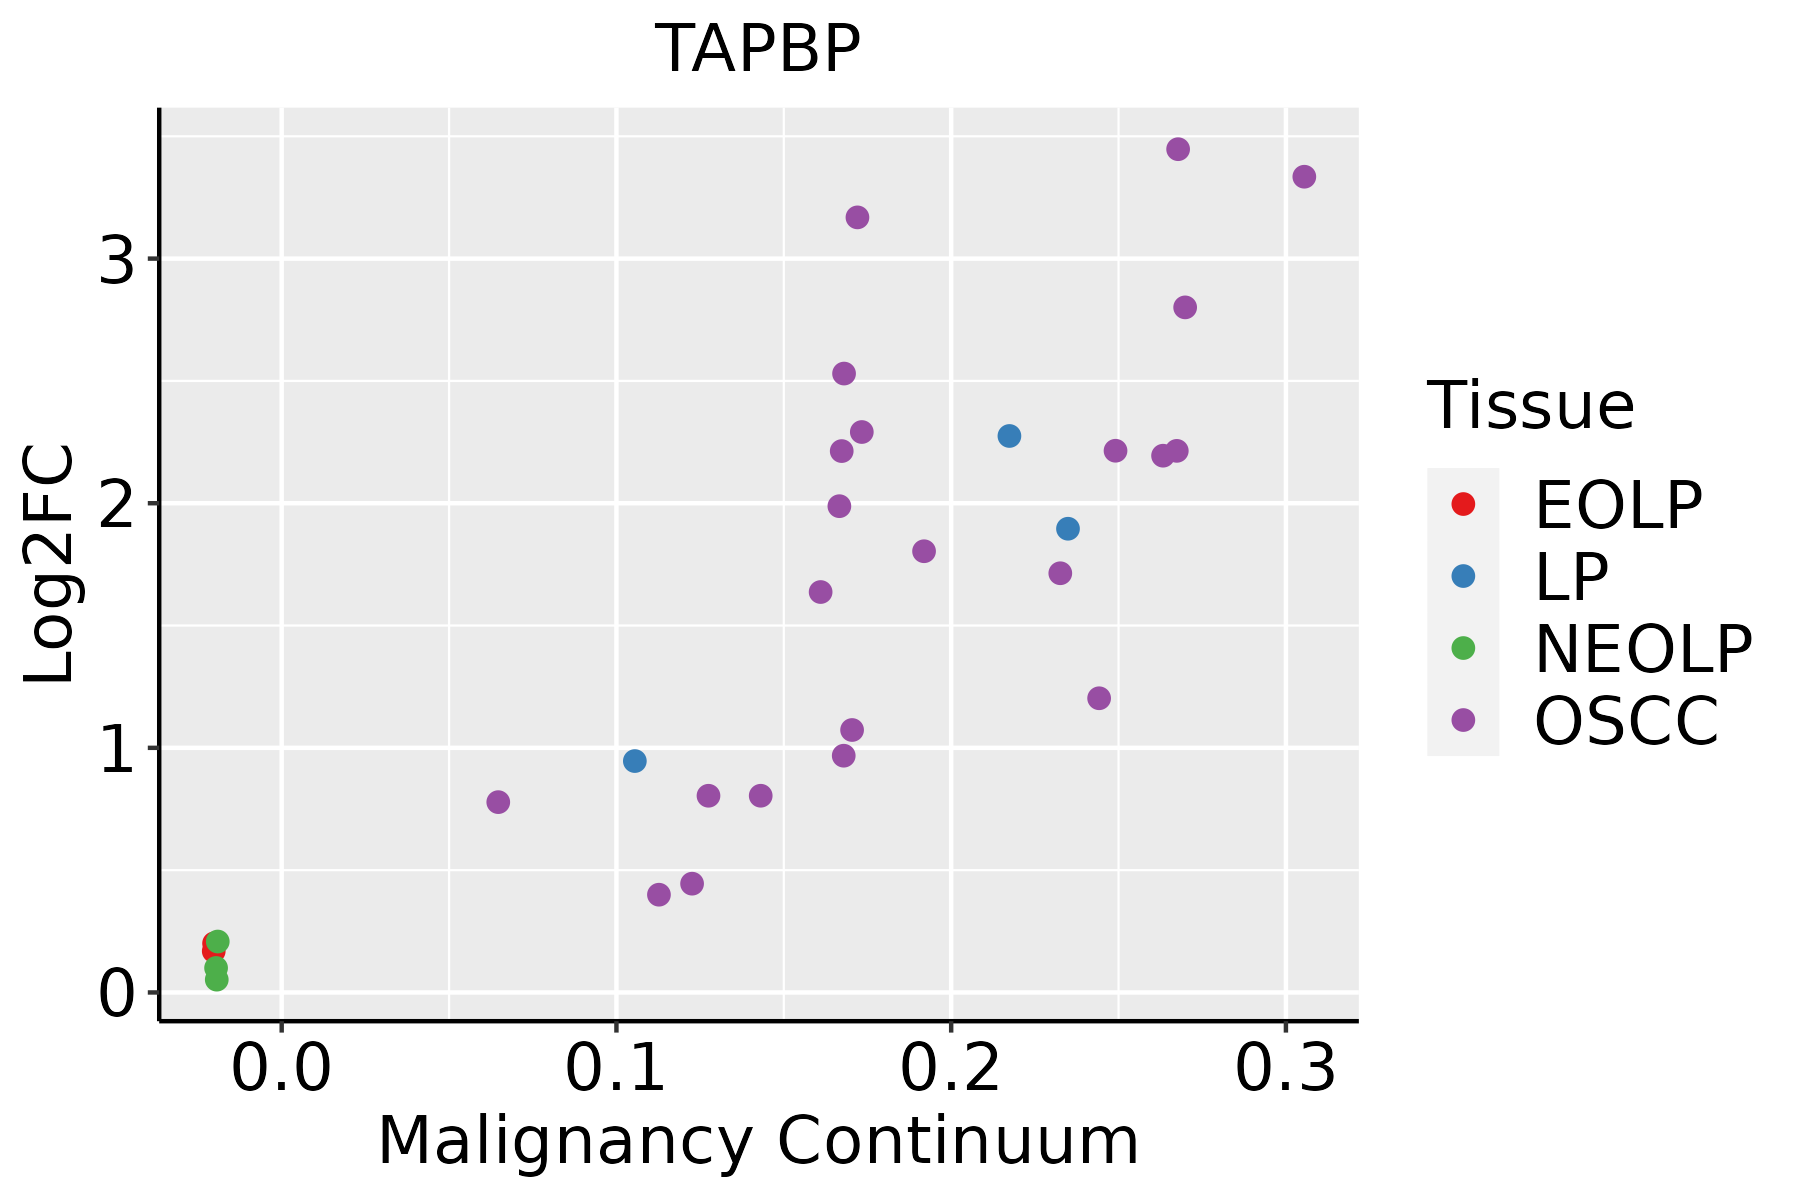 | EOLP: Erosive Oral lichen planus |
| LP: leukoplakia | ||
| NEOLP: Non-erosive oral lichen planus | ||
| OSCC: Oral squamous cell carcinoma | ||
| Prostate |  | BPH: Benign Prostatic Hyperplasia |
| Skin | 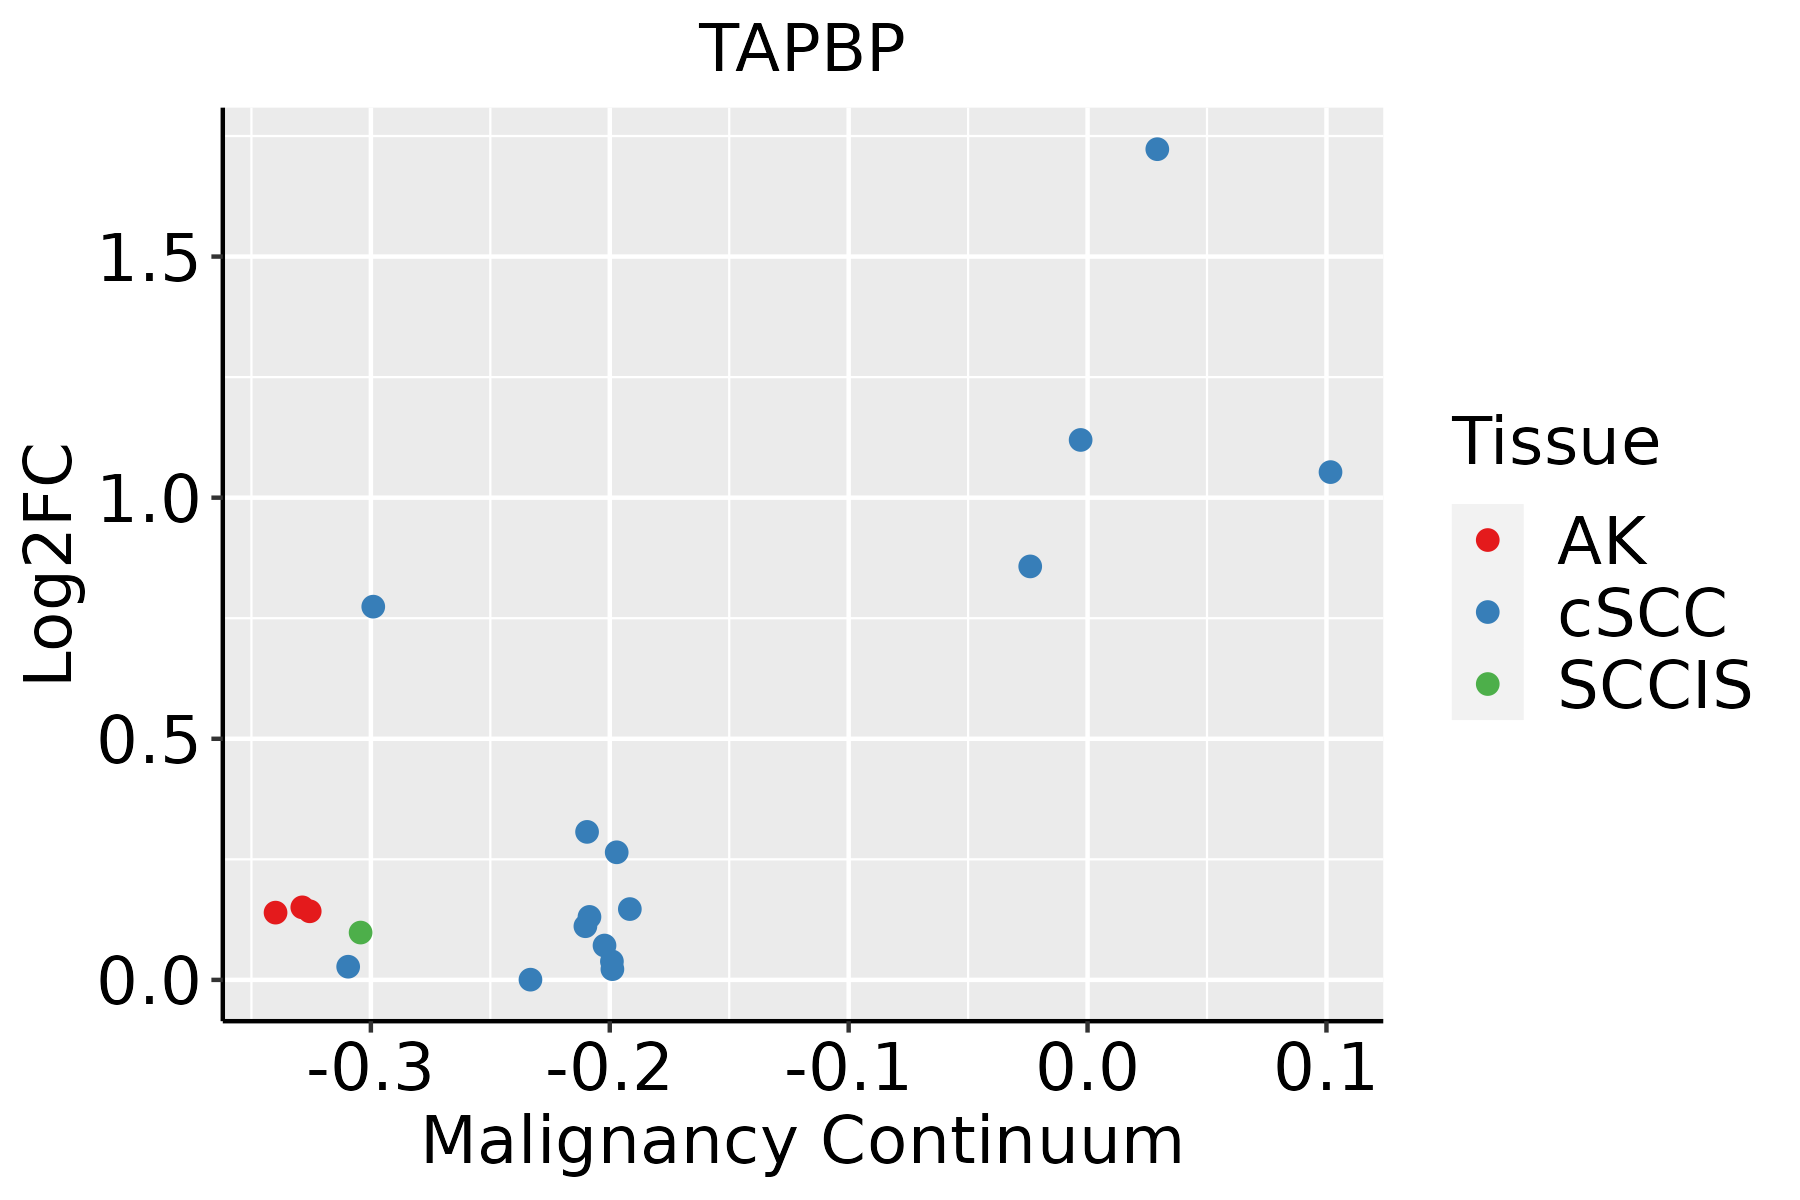 | AK: Actinic keratosis |
| cSCC: Cutaneous squamous cell carcinoma | ||
| SCCIS:squamous cell carcinoma in situ | ||
| Thyroid | 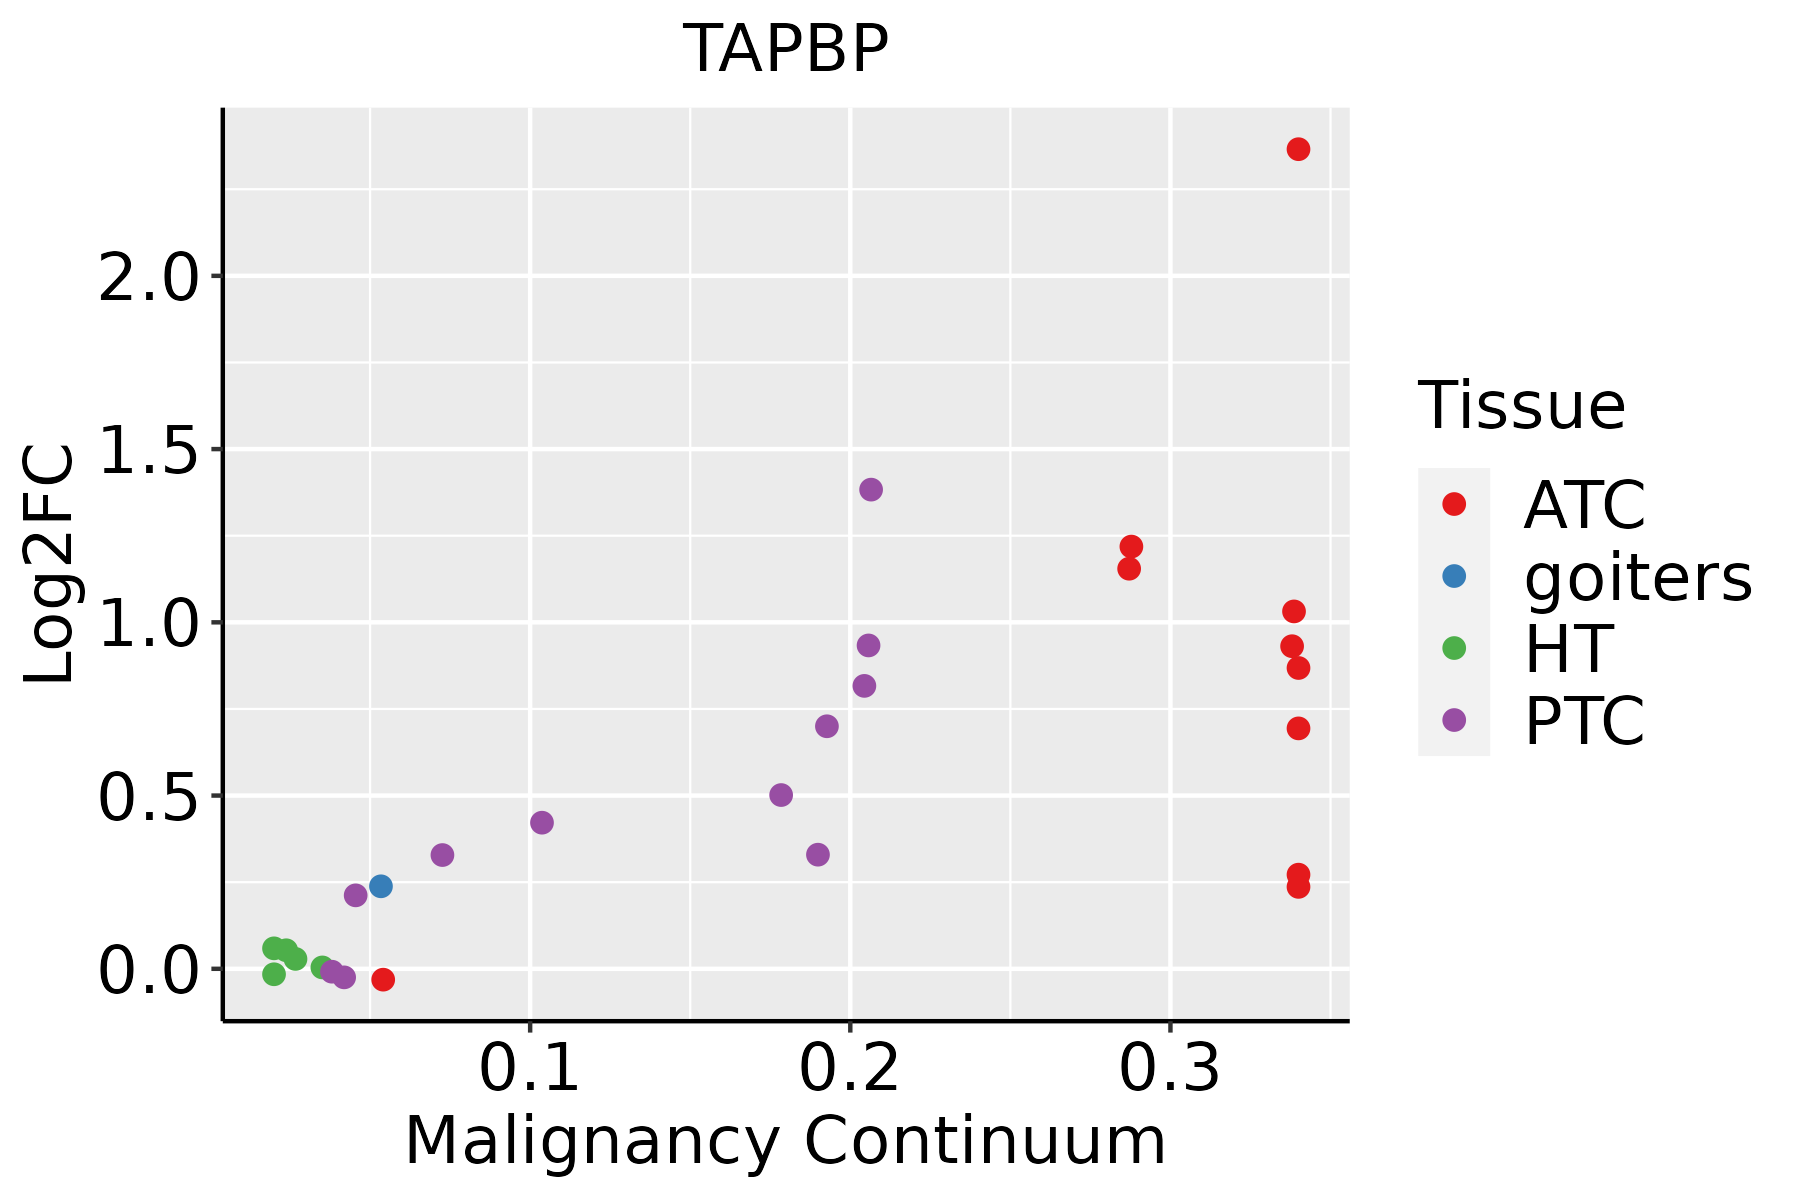 | ATC: Anaplastic thyroid cancer |
| HT: Hashimoto's thyroiditis | ||
| PTC: Papillary thyroid cancer |
| ∗log2FC in expression of this searched gene in stem-like cells from each diseased tissue sample relative to stem-like cells in normal samples in each tissue plotted against the malignancy continuum. Samples are colored based on if they are from different disease stage. |
Top |
Malignant transformation related pathway analysis |
| Find out the enriched GO biological processes and KEGG pathways involved in transition from healthy to precancer to cancer |
| Tissue | Disease Stage | Enriched GO biological Processes |
| Colorectum | AD |  |
| Colorectum | SER |  |
| Colorectum | MSS |  |
| Colorectum | MSI-H |  |
| Colorectum | FAP |  |
| ∗Top 15 enriched GO BP terms are showed in the bar plot of each disease state in each tissue. Each row represents a significant GO biological process which is colored according to the -log10(p.adjust). |
| Page: 1 2 3 4 5 6 7 8 9 |
| GO ID | Tissue | Disease Stage | Description | Gene Ratio | Bg Ratio | pvalue | p.adjust | Count |
| GO:004800210 | Cervix | CC | antigen processing and presentation of peptide antigen | 24/2311 | 62/18723 | 1.21e-07 | 6.07e-06 | 24 |
| GO:00023968 | Cervix | CC | MHC protein complex assembly | 12/2311 | 19/18723 | 2.65e-07 | 1.12e-05 | 12 |
| GO:001988210 | Cervix | CC | antigen processing and presentation | 32/2311 | 106/18723 | 8.61e-07 | 3.08e-05 | 32 |
| GO:000248310 | Cervix | CC | antigen processing and presentation of endogenous peptide antigen | 11/2311 | 19/18723 | 2.89e-06 | 8.23e-05 | 11 |
| GO:001988310 | Cervix | CC | antigen processing and presentation of endogenous antigen | 13/2311 | 26/18723 | 3.25e-06 | 8.80e-05 | 13 |
| GO:001988510 | Cervix | CC | antigen processing and presentation of endogenous peptide antigen via MHC class I | 9/2311 | 17/18723 | 6.27e-05 | 8.94e-04 | 9 |
| GO:00481938 | Cervix | CC | Golgi vesicle transport | 58/2311 | 296/18723 | 2.24e-04 | 2.54e-03 | 58 |
| GO:000247410 | Cervix | CC | antigen processing and presentation of peptide antigen via MHC class I | 11/2311 | 28/18723 | 2.84e-04 | 3.07e-03 | 11 |
| GO:00068907 | Cervix | CC | retrograde vesicle-mediated transport, Golgi to endoplasmic reticulum | 15/2311 | 52/18723 | 1.15e-03 | 9.39e-03 | 15 |
| GO:00158337 | Cervix | CC | peptide transport | 46/2311 | 264/18723 | 9.69e-03 | 4.78e-02 | 46 |
| GO:001988223 | Cervix | N_HPV | antigen processing and presentation | 17/534 | 106/18723 | 7.93e-09 | 1.60e-06 | 17 |
| GO:000239622 | Cervix | N_HPV | MHC protein complex assembly | 8/534 | 19/18723 | 2.38e-08 | 3.18e-06 | 8 |
| GO:004800223 | Cervix | N_HPV | antigen processing and presentation of peptide antigen | 12/534 | 62/18723 | 1.51e-07 | 1.30e-05 | 12 |
| GO:001988314 | Cervix | N_HPV | antigen processing and presentation of endogenous antigen | 7/534 | 26/18723 | 6.06e-06 | 2.17e-04 | 7 |
| GO:000248315 | Cervix | N_HPV | antigen processing and presentation of endogenous peptide antigen | 6/534 | 19/18723 | 1.03e-05 | 3.53e-04 | 6 |
| GO:001988514 | Cervix | N_HPV | antigen processing and presentation of endogenous peptide antigen via MHC class I | 4/534 | 17/18723 | 1.16e-03 | 1.31e-02 | 4 |
| GO:000247413 | Cervix | N_HPV | antigen processing and presentation of peptide antigen via MHC class I | 4/534 | 28/18723 | 7.78e-03 | 4.97e-02 | 4 |
| GO:0048193 | Colorectum | AD | Golgi vesicle transport | 109/3918 | 296/18723 | 1.80e-10 | 1.68e-08 | 109 |
| GO:0006890 | Colorectum | AD | retrograde vesicle-mediated transport, Golgi to endoplasmic reticulum | 27/3918 | 52/18723 | 7.67e-07 | 2.70e-05 | 27 |
| GO:0015833 | Colorectum | AD | peptide transport | 77/3918 | 264/18723 | 8.90e-04 | 8.60e-03 | 77 |
| Page: 1 2 3 4 5 6 7 8 9 10 |
| Pathway ID | Tissue | Disease Stage | Description | Gene Ratio | Bg Ratio | pvalue | p.adjust | qvalue | Count |
| hsa0461220 | Cervix | CC | Antigen processing and presentation | 34/1267 | 78/8465 | 1.06e-09 | 2.14e-08 | 1.26e-08 | 34 |
| hsa0516318 | Cervix | CC | Human cytomegalovirus infection | 65/1267 | 225/8465 | 4.59e-08 | 6.47e-07 | 3.83e-07 | 65 |
| hsa0516920 | Cervix | CC | Epstein-Barr virus infection | 57/1267 | 202/8465 | 7.30e-07 | 7.39e-06 | 4.37e-06 | 57 |
| hsa0517016 | Cervix | CC | Human immunodeficiency virus 1 infection | 55/1267 | 212/8465 | 1.80e-05 | 1.42e-04 | 8.40e-05 | 55 |
| hsa04612110 | Cervix | CC | Antigen processing and presentation | 34/1267 | 78/8465 | 1.06e-09 | 2.14e-08 | 1.26e-08 | 34 |
| hsa0516319 | Cervix | CC | Human cytomegalovirus infection | 65/1267 | 225/8465 | 4.59e-08 | 6.47e-07 | 3.83e-07 | 65 |
| hsa05169110 | Cervix | CC | Epstein-Barr virus infection | 57/1267 | 202/8465 | 7.30e-07 | 7.39e-06 | 4.37e-06 | 57 |
| hsa0517017 | Cervix | CC | Human immunodeficiency virus 1 infection | 55/1267 | 212/8465 | 1.80e-05 | 1.42e-04 | 8.40e-05 | 55 |
| hsa0516942 | Cervix | N_HPV | Epstein-Barr virus infection | 19/349 | 202/8465 | 6.54e-04 | 4.94e-03 | 3.86e-03 | 19 |
| hsa0516952 | Cervix | N_HPV | Epstein-Barr virus infection | 19/349 | 202/8465 | 6.54e-04 | 4.94e-03 | 3.86e-03 | 19 |
| hsa05170 | Colorectum | AD | Human immunodeficiency virus 1 infection | 72/2092 | 212/8465 | 1.40e-03 | 8.46e-03 | 5.39e-03 | 72 |
| hsa05163 | Colorectum | AD | Human cytomegalovirus infection | 75/2092 | 225/8465 | 2.00e-03 | 1.10e-02 | 7.01e-03 | 75 |
| hsa051701 | Colorectum | AD | Human immunodeficiency virus 1 infection | 72/2092 | 212/8465 | 1.40e-03 | 8.46e-03 | 5.39e-03 | 72 |
| hsa051631 | Colorectum | AD | Human cytomegalovirus infection | 75/2092 | 225/8465 | 2.00e-03 | 1.10e-02 | 7.01e-03 | 75 |
| hsa051702 | Colorectum | SER | Human immunodeficiency virus 1 infection | 58/1580 | 212/8465 | 1.08e-03 | 8.56e-03 | 6.21e-03 | 58 |
| hsa04612 | Colorectum | SER | Antigen processing and presentation | 25/1580 | 78/8465 | 3.11e-03 | 2.11e-02 | 1.53e-02 | 25 |
| hsa051632 | Colorectum | SER | Human cytomegalovirus infection | 57/1580 | 225/8465 | 7.40e-03 | 3.84e-02 | 2.79e-02 | 57 |
| hsa051703 | Colorectum | SER | Human immunodeficiency virus 1 infection | 58/1580 | 212/8465 | 1.08e-03 | 8.56e-03 | 6.21e-03 | 58 |
| hsa046121 | Colorectum | SER | Antigen processing and presentation | 25/1580 | 78/8465 | 3.11e-03 | 2.11e-02 | 1.53e-02 | 25 |
| hsa051633 | Colorectum | SER | Human cytomegalovirus infection | 57/1580 | 225/8465 | 7.40e-03 | 3.84e-02 | 2.79e-02 | 57 |
| Page: 1 2 3 4 5 6 7 |
Top |
Cell-cell communication analysis |
| Identification of potential cell-cell interactions between two cell types and their ligand-receptor pairs for different disease states |
| Ligand | Receptor | LRpair | Pathway | Tissue | Disease Stage |
| Page: 1 |
Top |
Single-cell gene regulatory network inference analysis |
| Find out the significant the regulons (TFs) and the target genes of each regulon across cell types for different disease states |
| TF | Cell Type | Tissue | Disease Stage | Target Gene | RSS | Regulon Activity |
| ∗The dot plots of a searched regulon are shown for all cell subpopulations in each disease state of each tissue based on the regulon specific score inferred using pySCENIC and by calculating the average expression. |
| Page: 1 |
Top |
Somatic mutation of malignant transformation related genes |
| Annotation of somatic variants for genes involved in malignant transformation |
| Hugo Symbol | Variant Class | Variant Classification | dbSNP RS | HGVSc | HGVSp | HGVSp Short | SWISSPROT | BIOTYPE | SIFT | PolyPhen | Tumor Sample Barcode | Tissue | Histology | Sex | Age | Stage | Therapy Types | Drugs | Outcome |
| TAPBP | SNV | Missense_Mutation | novel | c.613N>C | p.Glu205Gln | p.E205Q | protein_coding | deleterious(0) | probably_damaging(1) | TCGA-EK-A3GJ-01 | Cervix | cervical & endocervical cancer | Female | <65 | I/II | Unknown | Unknown | SD | |
| TAPBP | SNV | Missense_Mutation | c.444N>T | p.Glu148Asp | p.E148D | protein_coding | tolerated(0.1) | benign(0.003) | TCGA-FU-A3HZ-01 | Cervix | cervical & endocervical cancer | Female | <65 | I/II | Chemotherapy | cisplatin | CR | ||
| TAPBP | SNV | Missense_Mutation | c.1021N>G | p.Gln341Glu | p.Q341E | protein_coding | tolerated(0.5) | benign(0.066) | TCGA-JW-A5VL-01 | Cervix | cervical & endocervical cancer | Female | <65 | I/II | Unknown | Unknown | SD | ||
| TAPBP | SNV | Missense_Mutation | c.288N>G | p.Phe96Leu | p.F96L | protein_coding | deleterious(0.01) | benign(0.423) | TCGA-LP-A4AU-01 | Cervix | cervical & endocervical cancer | Female | <65 | III/IV | Chemotherapy | cisplatin | CR | ||
| TAPBP | SNV | Missense_Mutation | novel | c.583C>G | p.Leu195Val | p.L195V | protein_coding | tolerated(0.14) | benign(0.06) | TCGA-VS-A9UH-01 | Cervix | cervical & endocervical cancer | Female | <65 | I/II | Chemotherapy | cisplatin | CR | |
| TAPBP | SNV | Missense_Mutation | novel | c.1030G>A | p.Glu344Lys | p.E344K | protein_coding | tolerated(0.83) | benign(0.003) | TCGA-ZJ-AAXF-01 | Cervix | cervical & endocervical cancer | Female | <65 | I/II | Unknown | Unknown | SD | |
| TAPBP | SNV | Missense_Mutation | novel | c.960N>A | p.Phe320Leu | p.F320L | protein_coding | deleterious(0.01) | possibly_damaging(0.809) | TCGA-AA-3984-01 | Colorectum | colon adenocarcinoma | Female | <65 | I/II | Unknown | Unknown | SD | |
| TAPBP | SNV | Missense_Mutation | rs749133011 | c.1240N>A | p.Val414Ile | p.V414I | protein_coding | tolerated(0.83) | benign(0.038) | TCGA-QG-A5YV-01 | Colorectum | colon adenocarcinoma | Female | <65 | III/IV | Chemotherapy | xeloda | CR | |
| TAPBP | SNV | Missense_Mutation | novel | c.1079N>C | p.Val360Ala | p.V360A | protein_coding | deleterious(0.02) | possibly_damaging(0.888) | TCGA-AG-3892-01 | Colorectum | rectum adenocarcinoma | Female | <65 | I/II | Unknown | Unknown | SD | |
| TAPBP | SNV | Missense_Mutation | rs750940622 | c.1148N>A | p.Arg383Gln | p.R383Q | protein_coding | tolerated(0.23) | possibly_damaging(0.849) | TCGA-EI-6917-01 | Colorectum | rectum adenocarcinoma | Male | <65 | III/IV | Chemotherapy | 5fluorouracil+oxaciplatina+l-folinian | SD |
| Page: 1 2 3 4 5 |
Top |
Related drugs of malignant transformation related genes |
| Identification of chemicals and drugs interact with genes involved in malignant transfromation |
| (DGIdb 4.0) |
| Entrez ID | Symbol | Category | Interaction Types | Drug Claim Name | Drug Name | PMIDs |
| 6892 | TAPBP | TRANSPORTER | aspirin | ASPIRIN | 23736108 |
| Page: 1 |

Copyright 2023-Present -The University of Texas Health Science Center at Houston |