
|
|||||
|
 | |
| |
| |
| |
| |
| |
|
Gene: TAP2 |
Gene summary for TAP2 |
| Gene information | Species | Human | Gene symbol | TAP2 | Gene ID | 6891 |
| Gene name | transporter 2, ATP binding cassette subfamily B member | |
| Gene Alias | ABC18 | |
| Cytomap | 6p21.32 | |
| Gene Type | protein-coding | GO ID | GO:0002250 | UniProtAcc | Q03519 |
Top |
Malignant transformation analysis |
| Identification of the aberrant gene expression in precancerous and cancerous lesions by comparing the gene expression of stem-like cells in diseased tissues with normal stem cells |
| Entrez ID | Symbol | Replicates | Species | Organ | Tissue | Adj P-value | Log2FC | Malignancy |
| 6891 | TAP2 | HTA11_2487_2000001011 | Human | Colorectum | SER | 5.80e-07 | 2.32e-01 | -0.1808 |
| 6891 | TAP2 | HTA11_1938_2000001011 | Human | Colorectum | AD | 7.73e-09 | 2.54e-01 | -0.0811 |
| 6891 | TAP2 | HTA11_347_2000001011 | Human | Colorectum | AD | 1.02e-14 | 2.78e-01 | -0.1954 |
| 6891 | TAP2 | HTA11_411_2000001011 | Human | Colorectum | SER | 5.61e-03 | 2.55e-01 | -0.2602 |
| 6891 | TAP2 | HTA11_2112_2000001011 | Human | Colorectum | SER | 1.29e-05 | 3.96e-01 | -0.2196 |
| 6891 | TAP2 | HTA11_3361_2000001011 | Human | Colorectum | AD | 1.09e-06 | 2.67e-01 | -0.1207 |
| 6891 | TAP2 | HTA11_83_2000001011 | Human | Colorectum | SER | 1.47e-06 | 2.84e-01 | -0.1526 |
| 6891 | TAP2 | HTA11_696_2000001011 | Human | Colorectum | AD | 3.80e-25 | 4.61e-01 | -0.1464 |
| 6891 | TAP2 | HTA11_866_2000001011 | Human | Colorectum | AD | 2.05e-06 | 1.52e-01 | -0.1001 |
| 6891 | TAP2 | HTA11_1391_2000001011 | Human | Colorectum | AD | 3.44e-15 | 3.88e-01 | -0.059 |
| 6891 | TAP2 | HTA11_5212_2000001011 | Human | Colorectum | AD | 6.52e-06 | 3.82e-01 | -0.2061 |
| 6891 | TAP2 | HTA11_546_2000001011 | Human | Colorectum | AD | 4.17e-02 | 1.52e-01 | -0.0842 |
| 6891 | TAP2 | HTA11_866_3004761011 | Human | Colorectum | AD | 1.67e-10 | 2.88e-01 | 0.096 |
| 6891 | TAP2 | HTA11_7663_2000001011 | Human | Colorectum | SER | 6.81e-04 | 2.58e-01 | 0.0131 |
| 6891 | TAP2 | HTA11_6801_2000001011 | Human | Colorectum | SER | 1.85e-04 | 2.69e-01 | 0.0171 |
| 6891 | TAP2 | HTA11_7696_3000711011 | Human | Colorectum | AD | 1.92e-04 | 1.44e-01 | 0.0674 |
| 6891 | TAP2 | HTA11_99999970781_79442 | Human | Colorectum | MSS | 2.30e-41 | 7.92e-01 | 0.294 |
| 6891 | TAP2 | HTA11_99999965062_69753 | Human | Colorectum | MSI-H | 1.40e-05 | 7.22e-01 | 0.3487 |
| 6891 | TAP2 | HTA11_99999965104_69814 | Human | Colorectum | MSS | 1.91e-05 | 2.35e-01 | 0.281 |
| 6891 | TAP2 | HTA11_99999971662_82457 | Human | Colorectum | MSS | 4.93e-21 | 4.33e-01 | 0.3859 |
| Page: 1 2 3 4 5 |
| Tissue | Expression Dynamics | Abbreviation |
| Colorectum (GSE201348) |  | FAP: Familial adenomatous polyposis |
| CRC: Colorectal cancer | ||
| Colorectum (HTA11) | 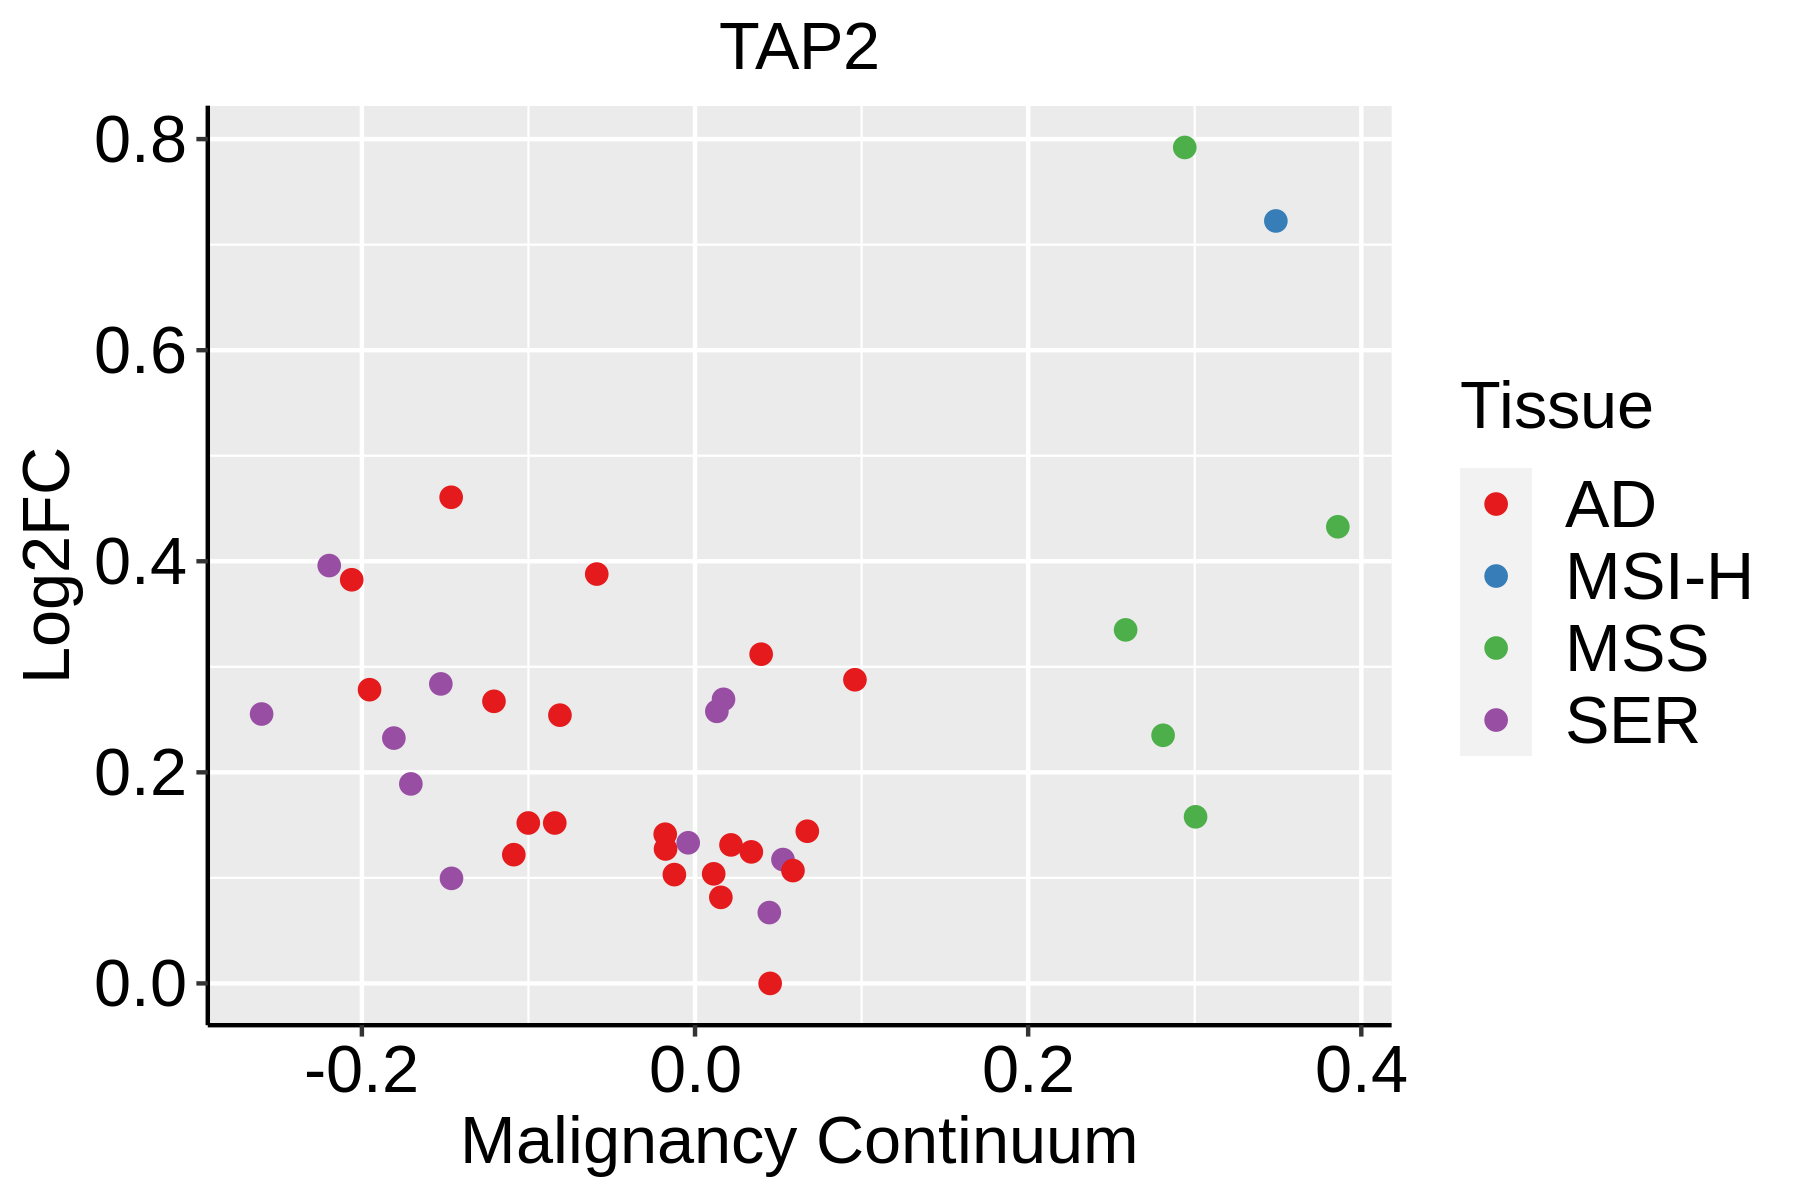 | AD: Adenomas |
| SER: Sessile serrated lesions | ||
| MSI-H: Microsatellite-high colorectal cancer | ||
| MSS: Microsatellite stable colorectal cancer | ||
| Esophagus | 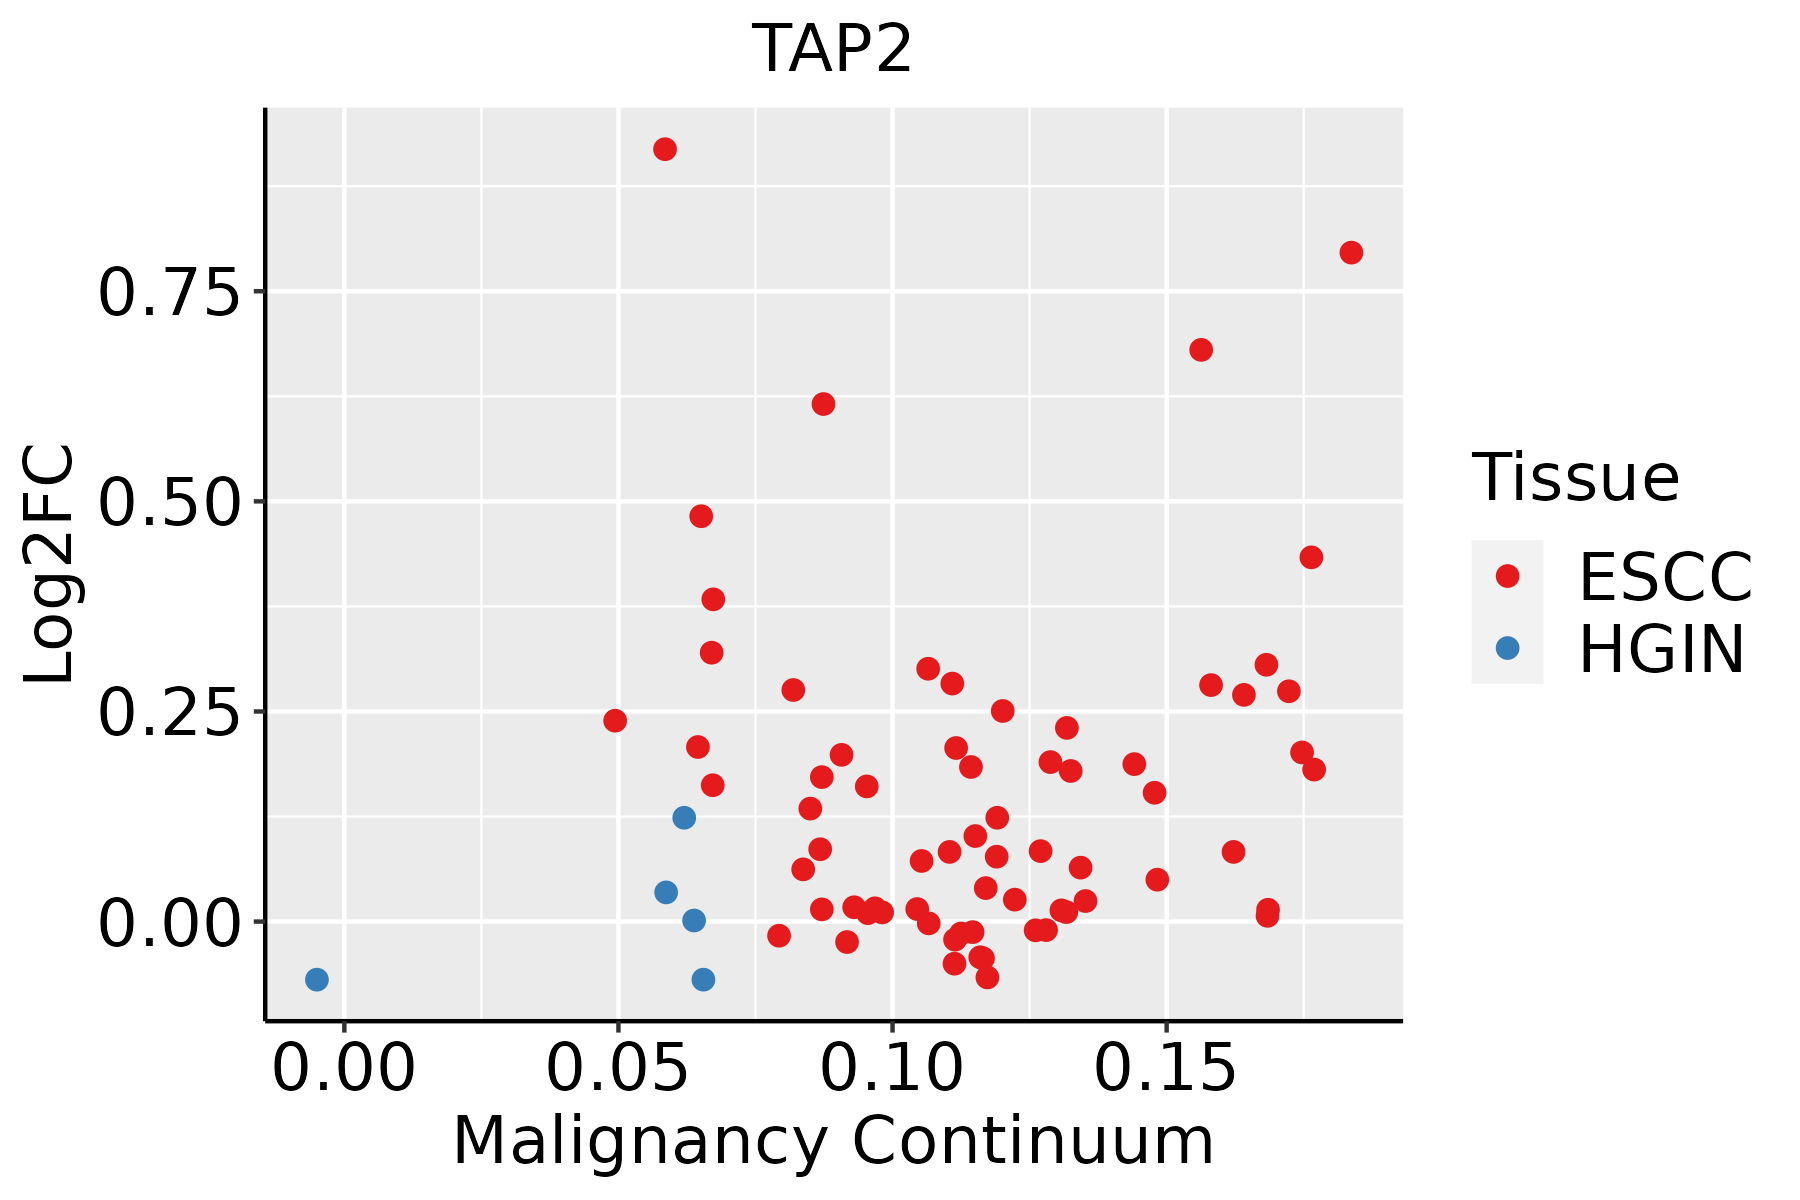 | ESCC: Esophageal squamous cell carcinoma |
| HGIN: High-grade intraepithelial neoplasias | ||
| LGIN: Low-grade intraepithelial neoplasias | ||
| Liver | 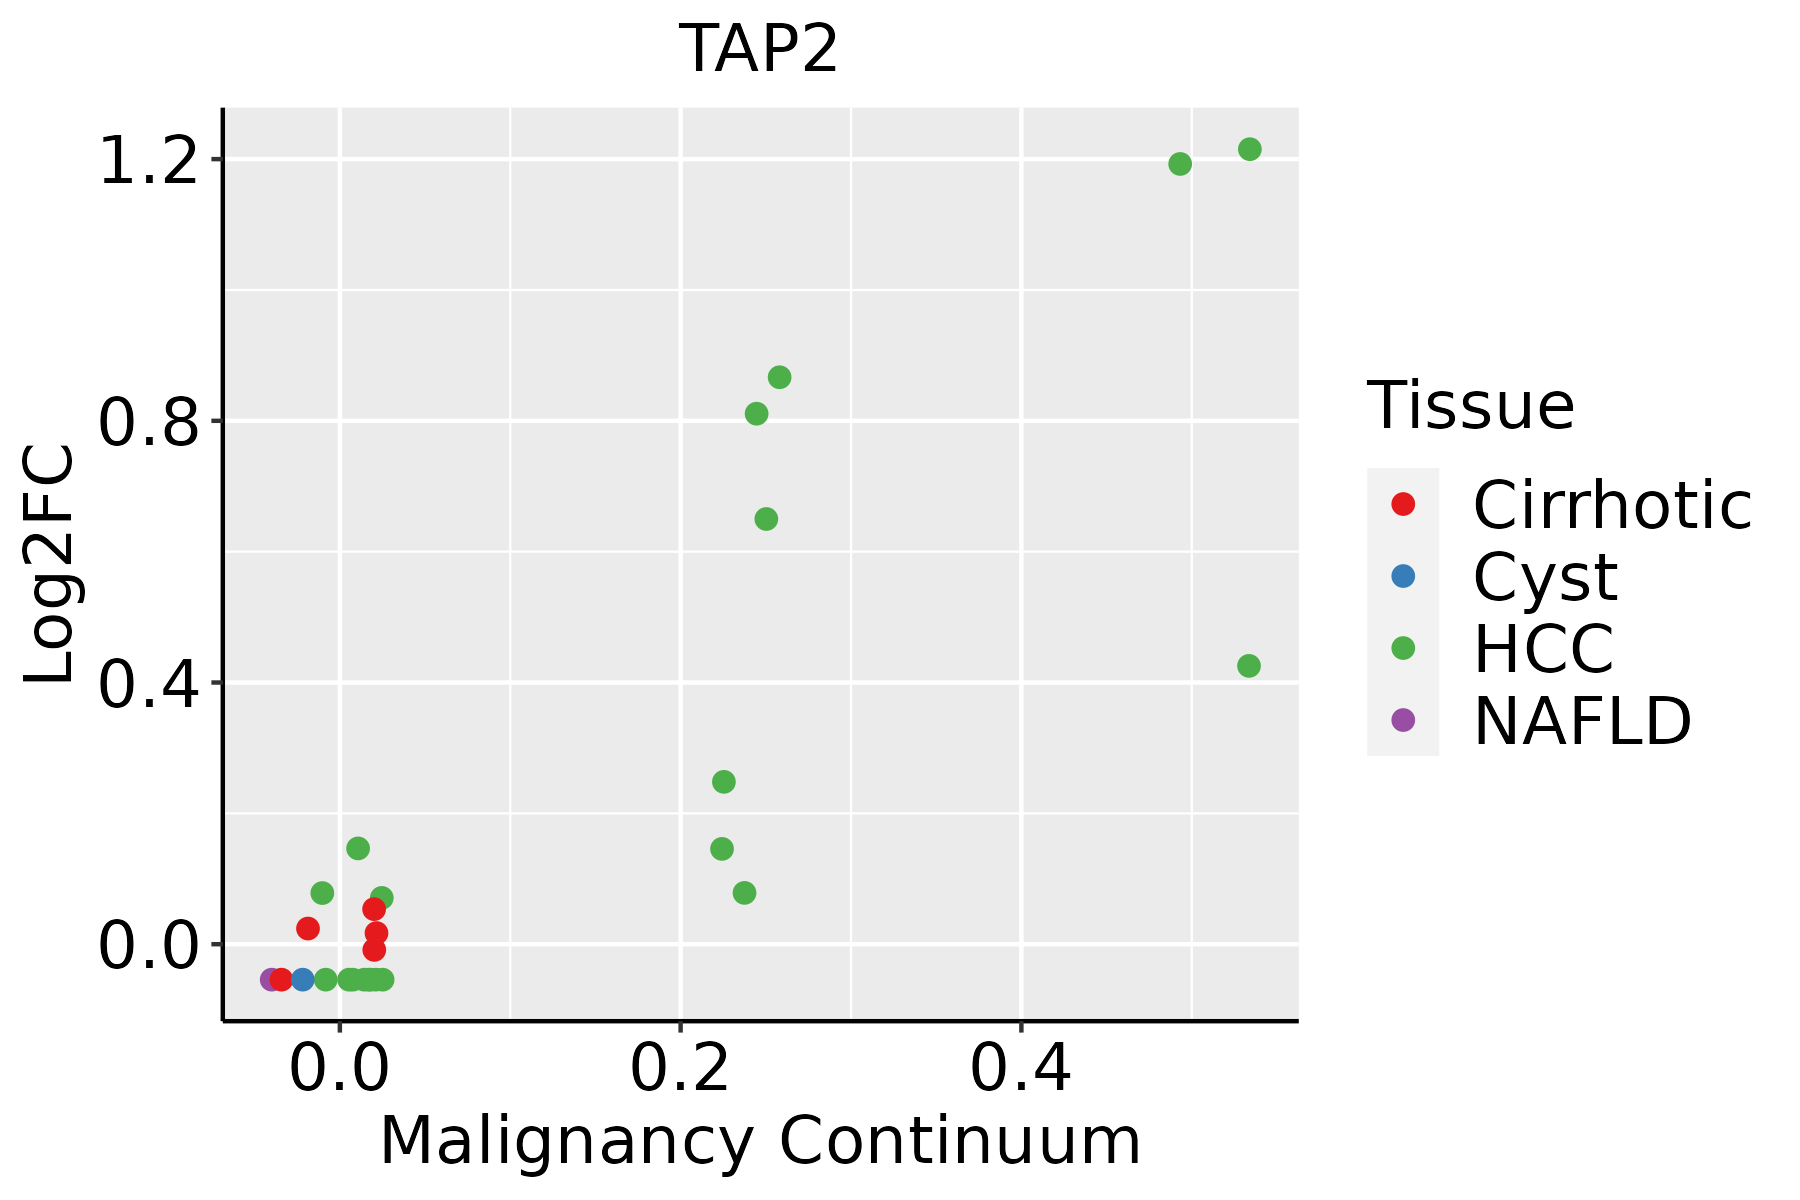 | HCC: Hepatocellular carcinoma |
| NAFLD: Non-alcoholic fatty liver disease | ||
| Oral Cavity | 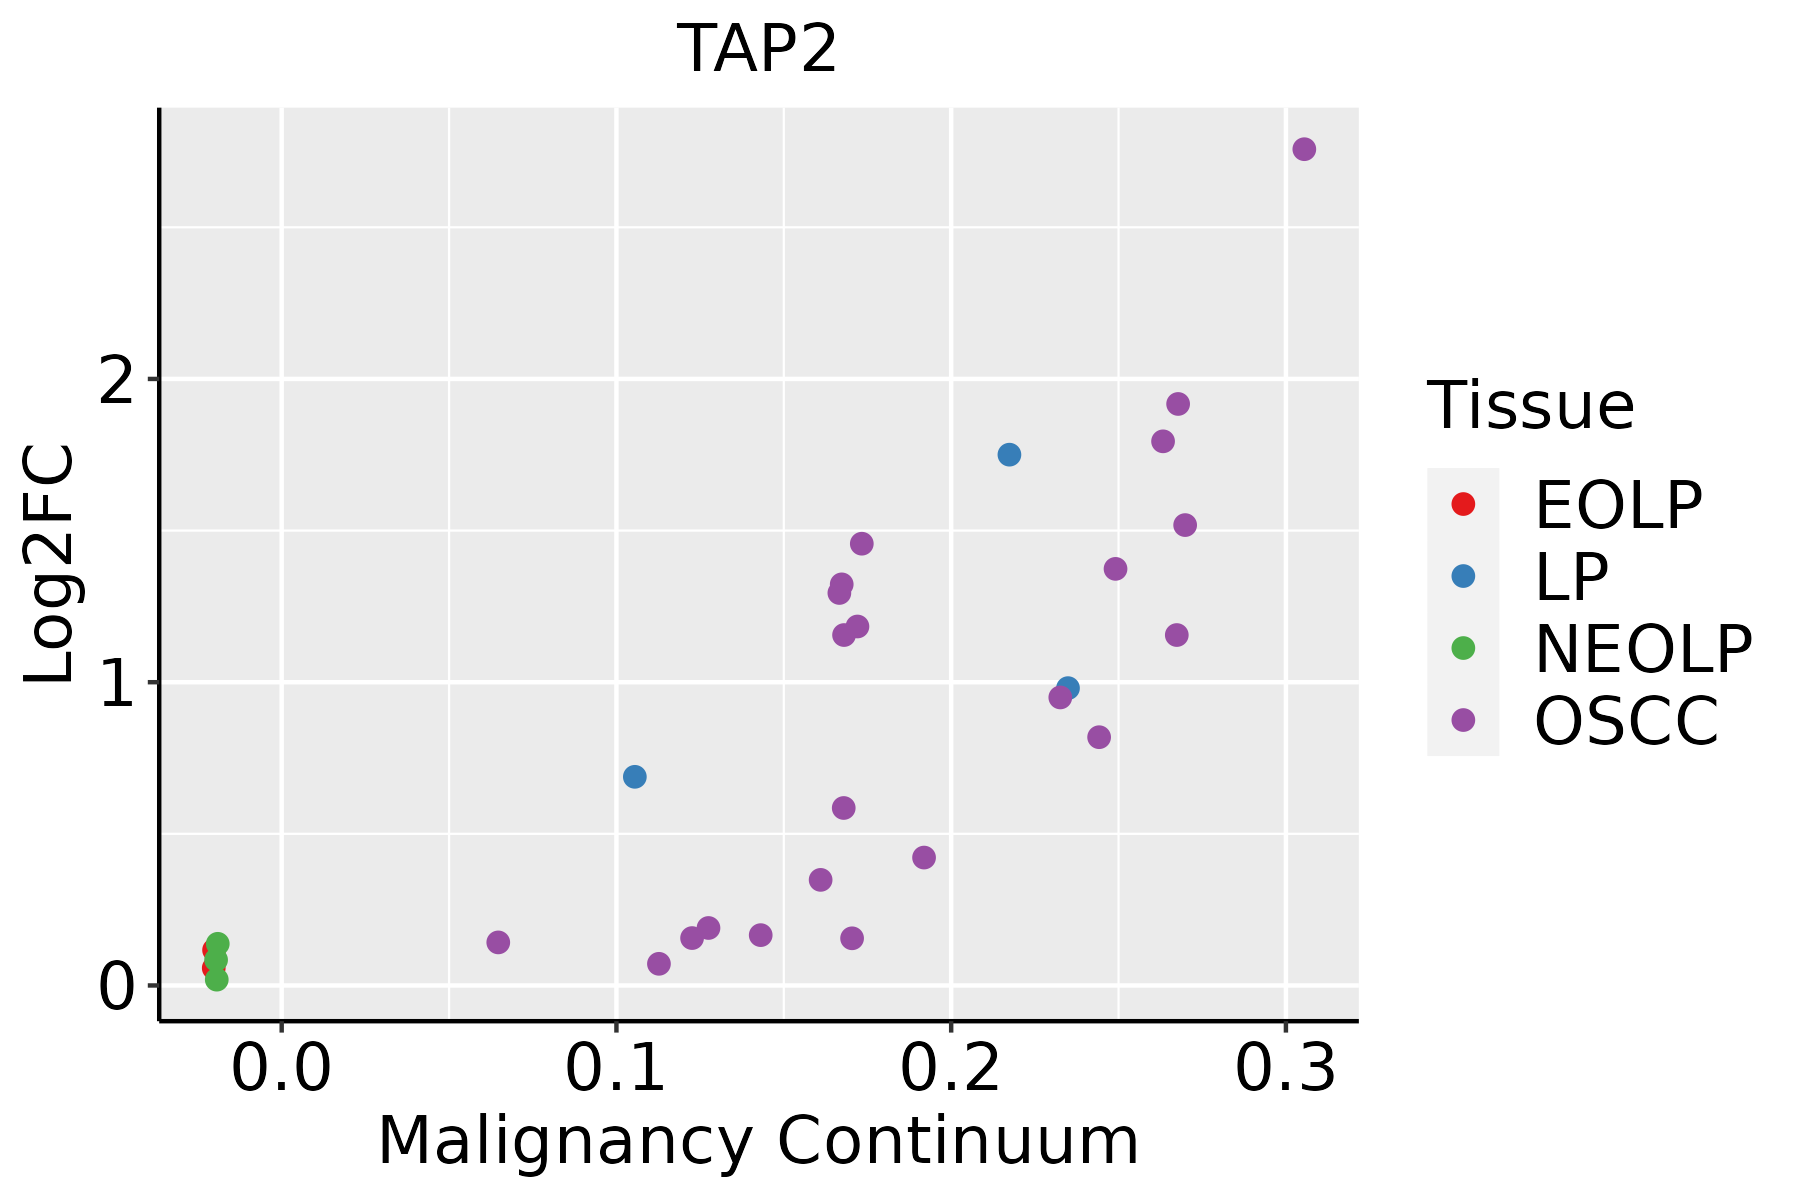 | EOLP: Erosive Oral lichen planus |
| LP: leukoplakia | ||
| NEOLP: Non-erosive oral lichen planus | ||
| OSCC: Oral squamous cell carcinoma | ||
| Thyroid | 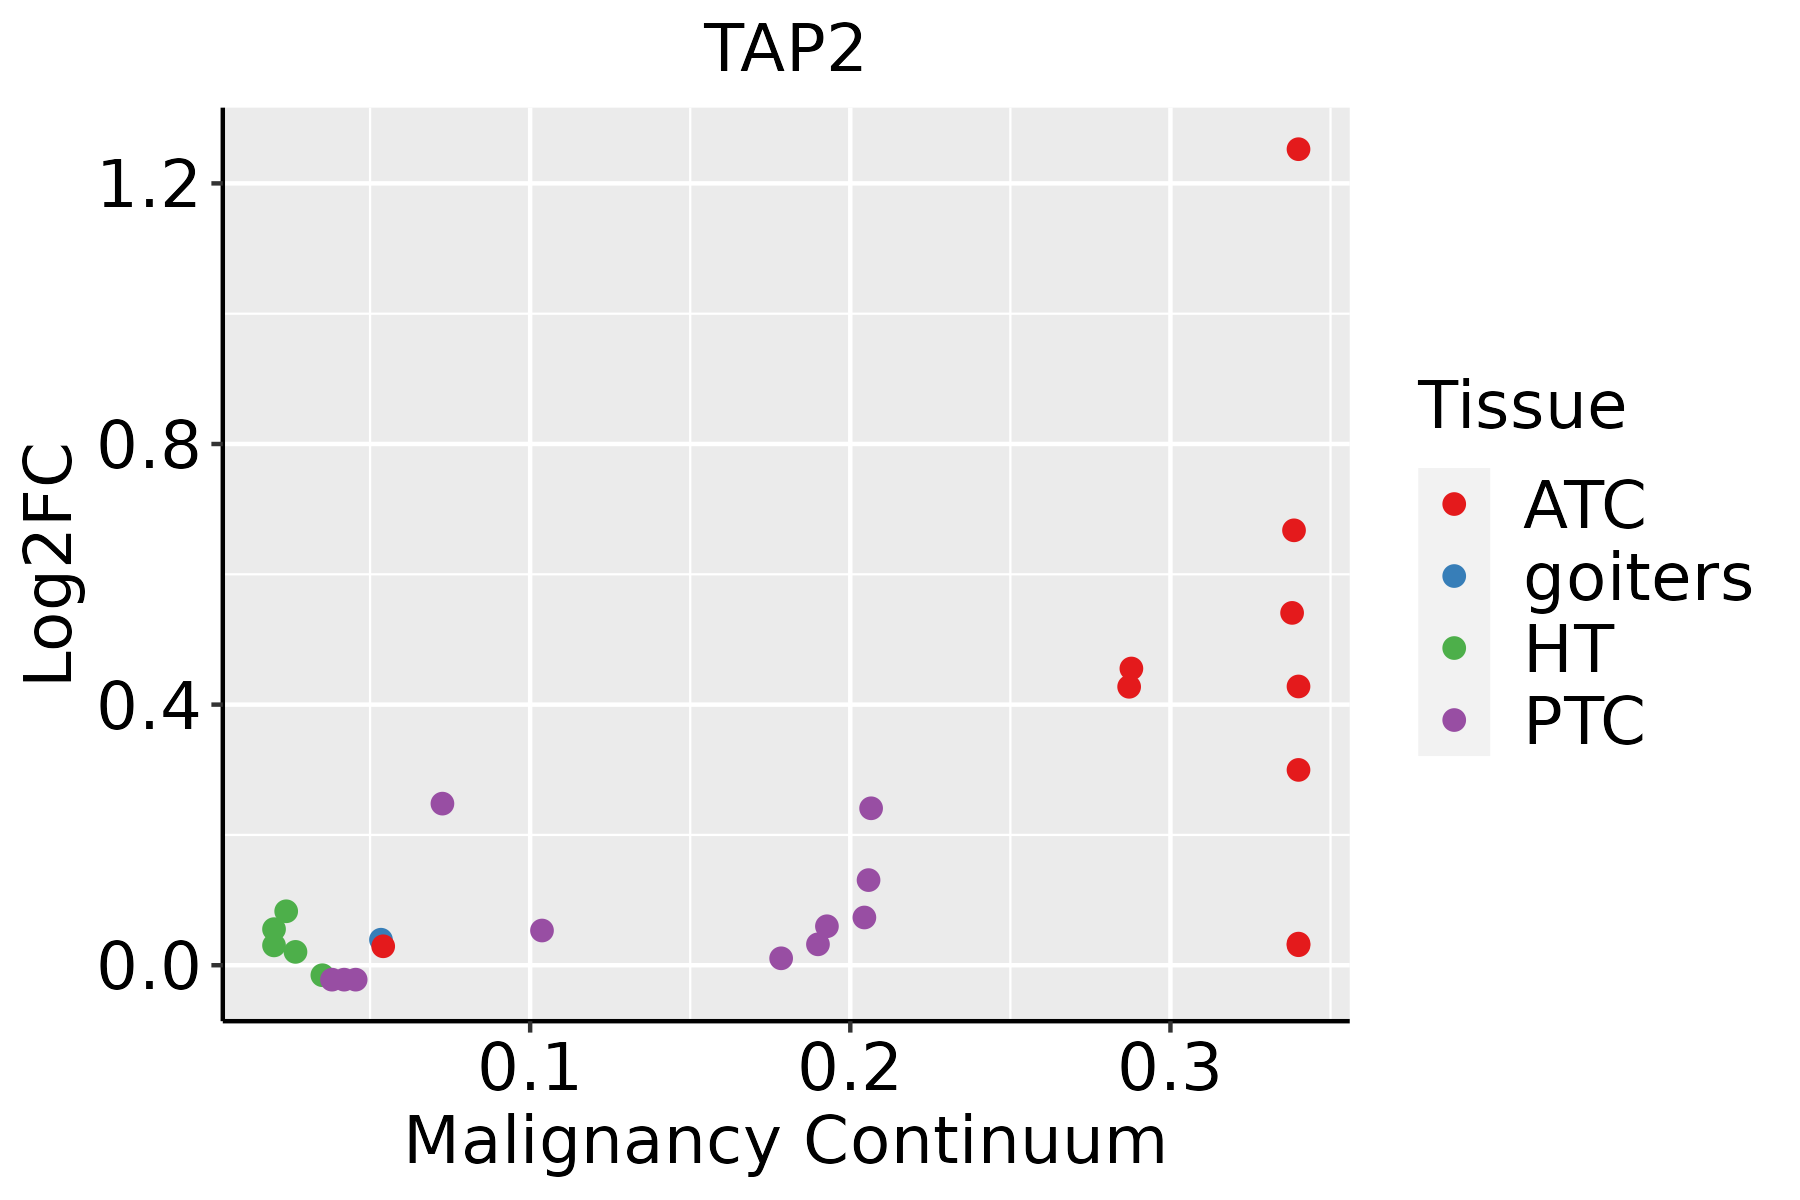 | ATC: Anaplastic thyroid cancer |
| HT: Hashimoto's thyroiditis | ||
| PTC: Papillary thyroid cancer |
| ∗log2FC in expression of this searched gene in stem-like cells from each diseased tissue sample relative to stem-like cells in normal samples in each tissue plotted against the malignancy continuum. Samples are colored based on if they are from different disease stage. |
Top |
Malignant transformation related pathway analysis |
| Find out the enriched GO biological processes and KEGG pathways involved in transition from healthy to precancer to cancer |
| Tissue | Disease Stage | Enriched GO biological Processes |
| Colorectum | AD |  |
| Colorectum | SER |  |
| Colorectum | MSS |  |
| Colorectum | MSI-H |  |
| Colorectum | FAP |  |
| ∗Top 15 enriched GO BP terms are showed in the bar plot of each disease state in each tissue. Each row represents a significant GO biological process which is colored according to the -log10(p.adjust). |
| Page: 1 2 3 4 5 6 7 8 9 |
| GO ID | Tissue | Disease Stage | Description | Gene Ratio | Bg Ratio | pvalue | p.adjust | Count |
| GO:0015833 | Colorectum | AD | peptide transport | 77/3918 | 264/18723 | 8.90e-04 | 8.60e-03 | 77 |
| GO:0002483 | Colorectum | AD | antigen processing and presentation of endogenous peptide antigen | 10/3918 | 19/18723 | 2.25e-03 | 1.77e-02 | 10 |
| GO:0042886 | Colorectum | AD | amide transport | 83/3918 | 301/18723 | 3.37e-03 | 2.46e-02 | 83 |
| GO:0019883 | Colorectum | AD | antigen processing and presentation of endogenous antigen | 12/3918 | 26/18723 | 3.47e-03 | 2.51e-02 | 12 |
| GO:00198831 | Colorectum | SER | antigen processing and presentation of endogenous antigen | 11/2897 | 26/18723 | 9.60e-04 | 1.15e-02 | 11 |
| GO:00024831 | Colorectum | SER | antigen processing and presentation of endogenous peptide antigen | 9/2897 | 19/18723 | 1.05e-03 | 1.23e-02 | 9 |
| GO:0048002 | Colorectum | SER | antigen processing and presentation of peptide antigen | 19/2897 | 62/18723 | 1.96e-03 | 1.97e-02 | 19 |
| GO:0019885 | Colorectum | SER | antigen processing and presentation of endogenous peptide antigen via MHC class I | 8/2897 | 17/18723 | 2.12e-03 | 2.06e-02 | 8 |
| GO:0019882 | Colorectum | SER | antigen processing and presentation | 28/2897 | 106/18723 | 2.52e-03 | 2.34e-02 | 28 |
| GO:00158331 | Colorectum | SER | peptide transport | 58/2897 | 264/18723 | 3.08e-03 | 2.70e-02 | 58 |
| GO:00158332 | Colorectum | MSS | peptide transport | 71/3467 | 264/18723 | 4.79e-04 | 5.60e-03 | 71 |
| GO:00024832 | Colorectum | MSS | antigen processing and presentation of endogenous peptide antigen | 10/3467 | 19/18723 | 8.39e-04 | 8.68e-03 | 10 |
| GO:00198832 | Colorectum | MSS | antigen processing and presentation of endogenous antigen | 12/3467 | 26/18723 | 1.16e-03 | 1.12e-02 | 12 |
| GO:00428861 | Colorectum | MSS | amide transport | 76/3467 | 301/18723 | 2.14e-03 | 1.80e-02 | 76 |
| GO:00198851 | Colorectum | MSS | antigen processing and presentation of endogenous peptide antigen via MHC class I | 8/3467 | 17/18723 | 6.76e-03 | 4.38e-02 | 8 |
| GO:00024833 | Colorectum | MSI-H | antigen processing and presentation of endogenous peptide antigen | 10/1319 | 19/18723 | 1.49e-07 | 1.32e-05 | 10 |
| GO:00198833 | Colorectum | MSI-H | antigen processing and presentation of endogenous antigen | 11/1319 | 26/18723 | 5.86e-07 | 4.28e-05 | 11 |
| GO:00198852 | Colorectum | MSI-H | antigen processing and presentation of endogenous peptide antigen via MHC class I | 8/1319 | 17/18723 | 8.12e-06 | 3.99e-04 | 8 |
| GO:00480021 | Colorectum | MSI-H | antigen processing and presentation of peptide antigen | 13/1319 | 62/18723 | 3.19e-04 | 7.63e-03 | 13 |
| GO:0002474 | Colorectum | MSI-H | antigen processing and presentation of peptide antigen via MHC class I | 8/1319 | 28/18723 | 5.16e-04 | 1.07e-02 | 8 |
| Page: 1 2 3 4 5 |
| Pathway ID | Tissue | Disease Stage | Description | Gene Ratio | Bg Ratio | pvalue | p.adjust | qvalue | Count |
| hsa05170 | Colorectum | AD | Human immunodeficiency virus 1 infection | 72/2092 | 212/8465 | 1.40e-03 | 8.46e-03 | 5.39e-03 | 72 |
| hsa05163 | Colorectum | AD | Human cytomegalovirus infection | 75/2092 | 225/8465 | 2.00e-03 | 1.10e-02 | 7.01e-03 | 75 |
| hsa051701 | Colorectum | AD | Human immunodeficiency virus 1 infection | 72/2092 | 212/8465 | 1.40e-03 | 8.46e-03 | 5.39e-03 | 72 |
| hsa051631 | Colorectum | AD | Human cytomegalovirus infection | 75/2092 | 225/8465 | 2.00e-03 | 1.10e-02 | 7.01e-03 | 75 |
| hsa051702 | Colorectum | SER | Human immunodeficiency virus 1 infection | 58/1580 | 212/8465 | 1.08e-03 | 8.56e-03 | 6.21e-03 | 58 |
| hsa04612 | Colorectum | SER | Antigen processing and presentation | 25/1580 | 78/8465 | 3.11e-03 | 2.11e-02 | 1.53e-02 | 25 |
| hsa051632 | Colorectum | SER | Human cytomegalovirus infection | 57/1580 | 225/8465 | 7.40e-03 | 3.84e-02 | 2.79e-02 | 57 |
| hsa051703 | Colorectum | SER | Human immunodeficiency virus 1 infection | 58/1580 | 212/8465 | 1.08e-03 | 8.56e-03 | 6.21e-03 | 58 |
| hsa046121 | Colorectum | SER | Antigen processing and presentation | 25/1580 | 78/8465 | 3.11e-03 | 2.11e-02 | 1.53e-02 | 25 |
| hsa051633 | Colorectum | SER | Human cytomegalovirus infection | 57/1580 | 225/8465 | 7.40e-03 | 3.84e-02 | 2.79e-02 | 57 |
| hsa051634 | Colorectum | MSS | Human cytomegalovirus infection | 74/1875 | 225/8465 | 1.12e-04 | 1.01e-03 | 6.19e-04 | 74 |
| hsa051704 | Colorectum | MSS | Human immunodeficiency virus 1 infection | 69/1875 | 212/8465 | 2.66e-04 | 1.98e-03 | 1.21e-03 | 69 |
| hsa05169 | Colorectum | MSS | Epstein-Barr virus infection | 63/1875 | 202/8465 | 1.63e-03 | 8.98e-03 | 5.50e-03 | 63 |
| hsa046122 | Colorectum | MSS | Antigen processing and presentation | 27/1875 | 78/8465 | 7.72e-03 | 2.91e-02 | 1.78e-02 | 27 |
| hsa051635 | Colorectum | MSS | Human cytomegalovirus infection | 74/1875 | 225/8465 | 1.12e-04 | 1.01e-03 | 6.19e-04 | 74 |
| hsa051705 | Colorectum | MSS | Human immunodeficiency virus 1 infection | 69/1875 | 212/8465 | 2.66e-04 | 1.98e-03 | 1.21e-03 | 69 |
| hsa051691 | Colorectum | MSS | Epstein-Barr virus infection | 63/1875 | 202/8465 | 1.63e-03 | 8.98e-03 | 5.50e-03 | 63 |
| hsa046123 | Colorectum | MSS | Antigen processing and presentation | 27/1875 | 78/8465 | 7.72e-03 | 2.91e-02 | 1.78e-02 | 27 |
| hsa046124 | Colorectum | MSI-H | Antigen processing and presentation | 23/797 | 78/8465 | 4.15e-07 | 7.91e-06 | 6.63e-06 | 23 |
| hsa04145 | Colorectum | MSI-H | Phagosome | 27/797 | 152/8465 | 8.74e-04 | 1.01e-02 | 8.48e-03 | 27 |
| Page: 1 2 3 4 |
Top |
Cell-cell communication analysis |
| Identification of potential cell-cell interactions between two cell types and their ligand-receptor pairs for different disease states |
| Ligand | Receptor | LRpair | Pathway | Tissue | Disease Stage |
| Page: 1 |
Top |
Single-cell gene regulatory network inference analysis |
| Find out the significant the regulons (TFs) and the target genes of each regulon across cell types for different disease states |
| TF | Cell Type | Tissue | Disease Stage | Target Gene | RSS | Regulon Activity |
| ∗The dot plots of a searched regulon are shown for all cell subpopulations in each disease state of each tissue based on the regulon specific score inferred using pySCENIC and by calculating the average expression. |
| Page: 1 |
Top |
Somatic mutation of malignant transformation related genes |
| Annotation of somatic variants for genes involved in malignant transformation |
| Hugo Symbol | Variant Class | Variant Classification | dbSNP RS | HGVSc | HGVSp | HGVSp Short | SWISSPROT | BIOTYPE | SIFT | PolyPhen | Tumor Sample Barcode | Tissue | Histology | Sex | Age | Stage | Therapy Types | Drugs | Outcome |
| TAP2 | insertion | In_Frame_Ins | novel | c.1468_1469insTCATAAGAGATGGTG | p.Thr490delinsIleIleArgAspGlyAla | p.T490delinsIIRDGA | Q03519 | protein_coding | TCGA-A8-A09D-01 | Breast | breast invasive carcinoma | Female | <65 | I/II | Chemotherapy | doxorubicin | CR | ||
| TAP2 | SNV | Missense_Mutation | c.94N>T | p.Pro32Ser | p.P32S | Q03519 | protein_coding | deleterious(0.02) | benign(0.103) | TCGA-FU-A23K-01 | Cervix | cervical & endocervical cancer | Female | <65 | III/IV | Unknown | Unknown | SD | |
| TAP2 | SNV | Missense_Mutation | c.1079N>C | p.Glu360Ala | p.E360A | Q03519 | protein_coding | tolerated(0.21) | possibly_damaging(0.634) | TCGA-FU-A3HZ-01 | Cervix | cervical & endocervical cancer | Female | <65 | I/II | Chemotherapy | cisplatin | CR | |
| TAP2 | SNV | Missense_Mutation | c.1414N>A | p.Asp472Asn | p.D472N | Q03519 | protein_coding | tolerated(0.87) | benign(0.001) | TCGA-IR-A3LI-01 | Cervix | cervical & endocervical cancer | Female | <65 | I/II | Chemotherapy | cisplatin | CR | |
| TAP2 | SNV | Missense_Mutation | rs769546391 | c.872N>A | p.Arg291Gln | p.R291Q | Q03519 | protein_coding | tolerated(0.39) | possibly_damaging(0.672) | TCGA-AA-3510-01 | Colorectum | colon adenocarcinoma | Male | >=65 | I/II | Unknown | Unknown | SD |
| TAP2 | SNV | Missense_Mutation | c.1600N>G | p.Ile534Val | p.I534V | Q03519 | protein_coding | tolerated(0.32) | benign(0.017) | TCGA-AA-3877-01 | Colorectum | colon adenocarcinoma | Female | >=65 | I/II | Unknown | Unknown | SD | |
| TAP2 | SNV | Missense_Mutation | c.2006N>T | p.Ala669Val | p.A669V | Q03519 | protein_coding | deleterious(0.03) | benign(0.174) | TCGA-AA-A010-01 | Colorectum | colon adenocarcinoma | Female | <65 | I/II | Chemotherapy | folinic | CR | |
| TAP2 | SNV | Missense_Mutation | novel | c.1053N>C | p.Glu351Asp | p.E351D | Q03519 | protein_coding | deleterious(0) | possibly_damaging(0.677) | TCGA-CA-6717-01 | Colorectum | colon adenocarcinoma | Male | <65 | I/II | Chemotherapy | oxaliplatin | CR |
| TAP2 | SNV | Missense_Mutation | rs376467259 | c.1028N>A | p.Arg343His | p.R343H | Q03519 | protein_coding | deleterious(0) | probably_damaging(0.986) | TCGA-CK-6746-01 | Colorectum | colon adenocarcinoma | Female | >=65 | I/II | Unknown | Unknown | SD |
| TAP2 | SNV | Missense_Mutation | c.977N>T | p.Ala326Val | p.A326V | Q03519 | protein_coding | deleterious(0) | probably_damaging(0.99) | TCGA-F4-6856-01 | Colorectum | colon adenocarcinoma | Male | <65 | I/II | Ancillary | leucovorin | CR |
| Page: 1 2 3 4 5 6 |
Top |
Related drugs of malignant transformation related genes |
| Identification of chemicals and drugs interact with genes involved in malignant transfromation |
| (DGIdb 4.0) |
| Entrez ID | Symbol | Category | Interaction Types | Drug Claim Name | Drug Name | PMIDs |
| Page: 1 |

Copyright 2023-Present -The University of Texas Health Science Center at Houston |