| Tissue | Expression Dynamics | Abbreviation |
| Breast | 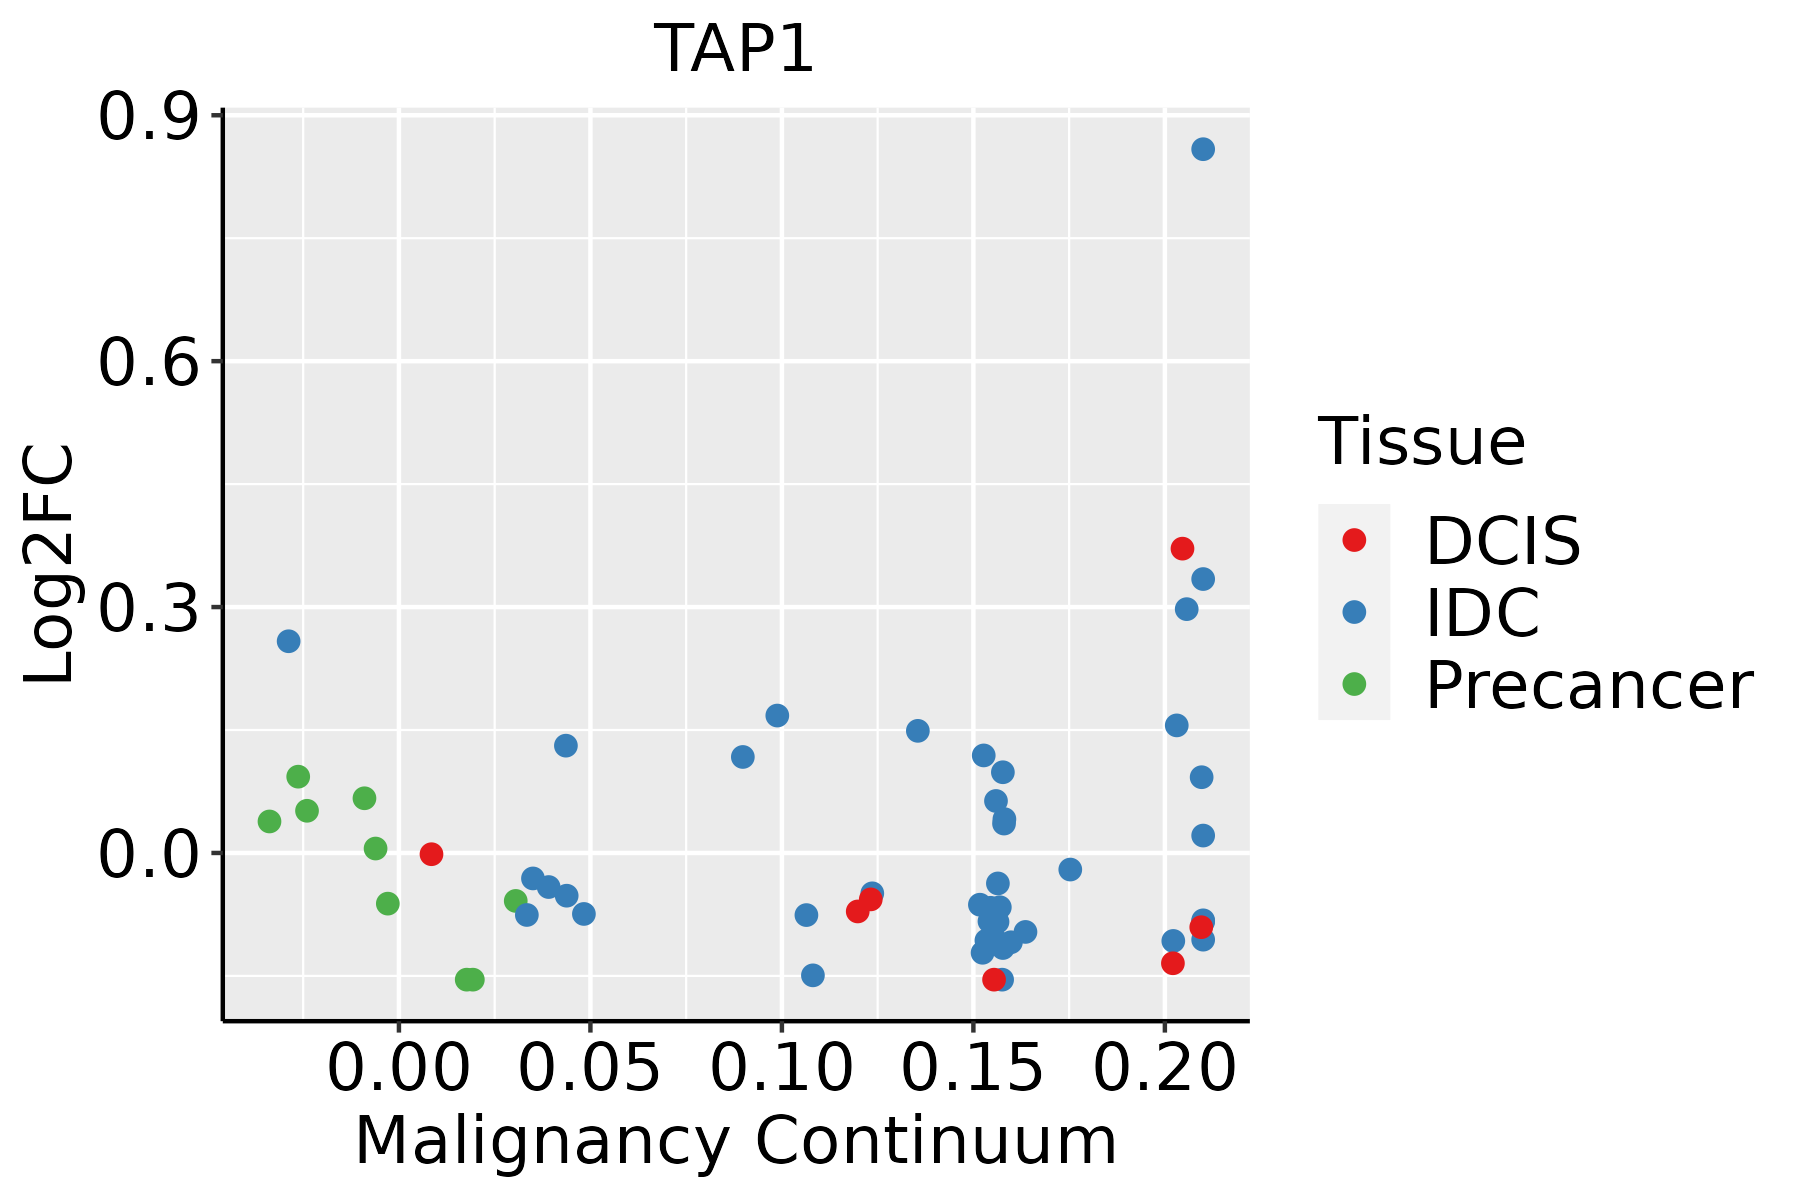 | IDC: Invasive ductal carcinoma |
| DCIS: Ductal carcinoma in situ |
| Precancer(BRCA1-mut): Precancerous lesion from BRCA1 mutation carriers |
| Cervix | 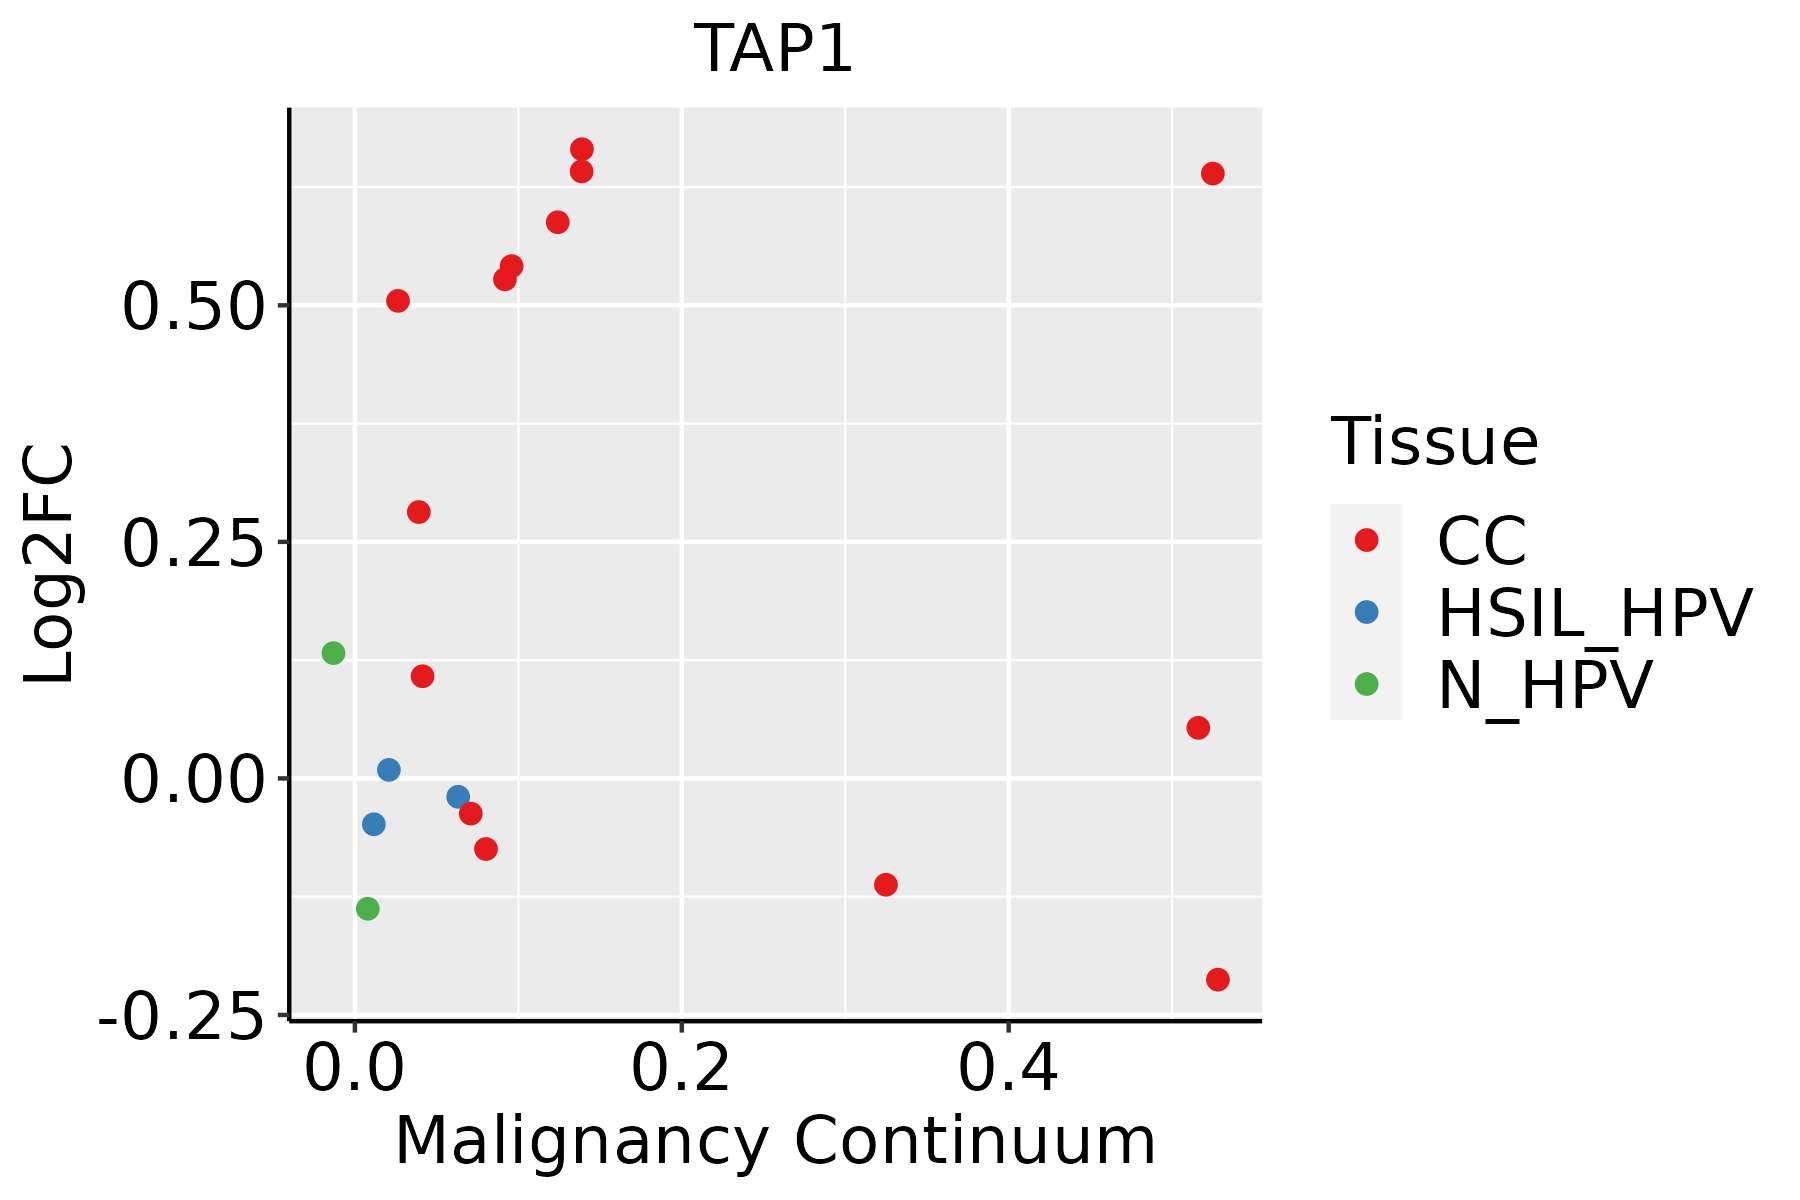 | CC: Cervix cancer |
| HSIL_HPV: HPV-infected high-grade squamous intraepithelial lesions |
| N_HPV: HPV-infected normal cervix |
| Esophagus | 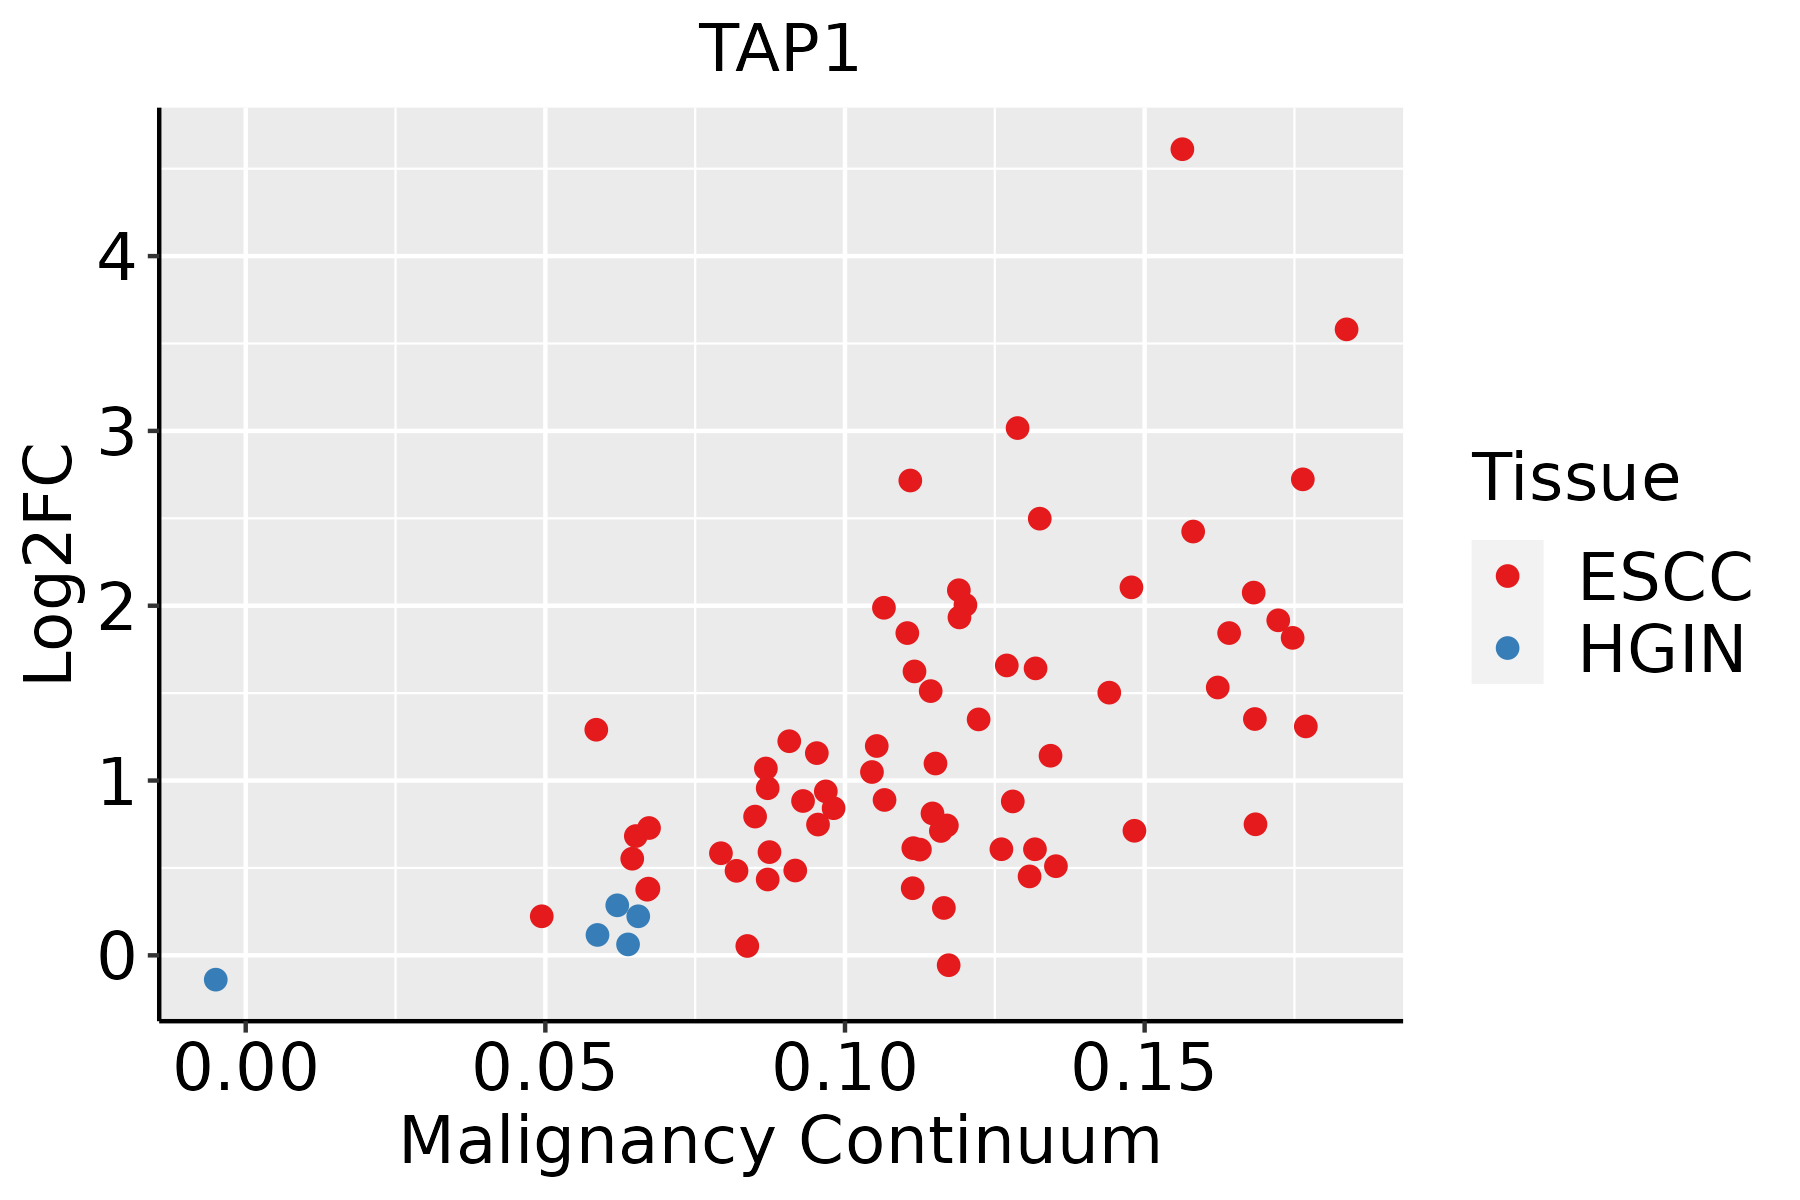 | ESCC: Esophageal squamous cell carcinoma |
| HGIN: High-grade intraepithelial neoplasias |
| LGIN: Low-grade intraepithelial neoplasias |
| Liver |  | HCC: Hepatocellular carcinoma |
| NAFLD: Non-alcoholic fatty liver disease |
| Oral Cavity | 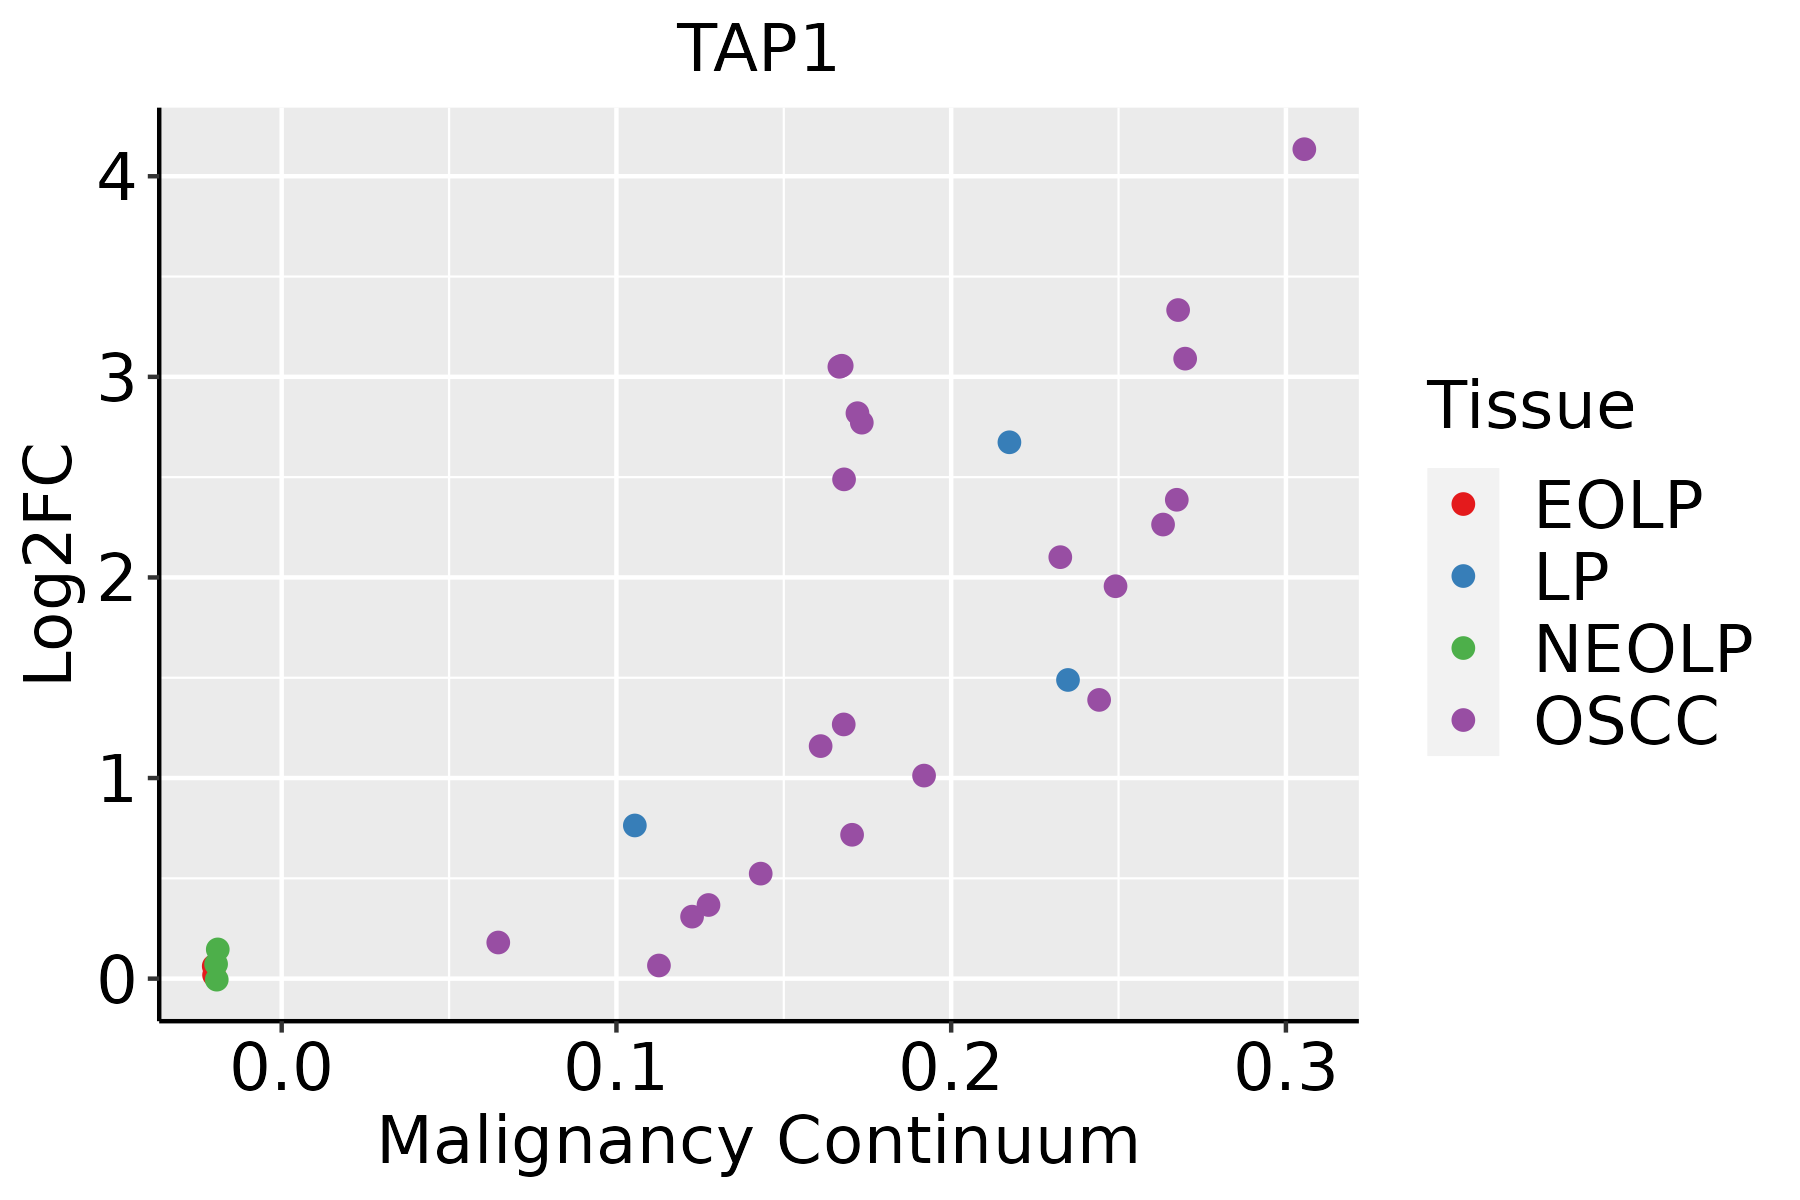 | EOLP: Erosive Oral lichen planus |
| LP: leukoplakia |
| NEOLP: Non-erosive oral lichen planus |
| OSCC: Oral squamous cell carcinoma |
| Skin | 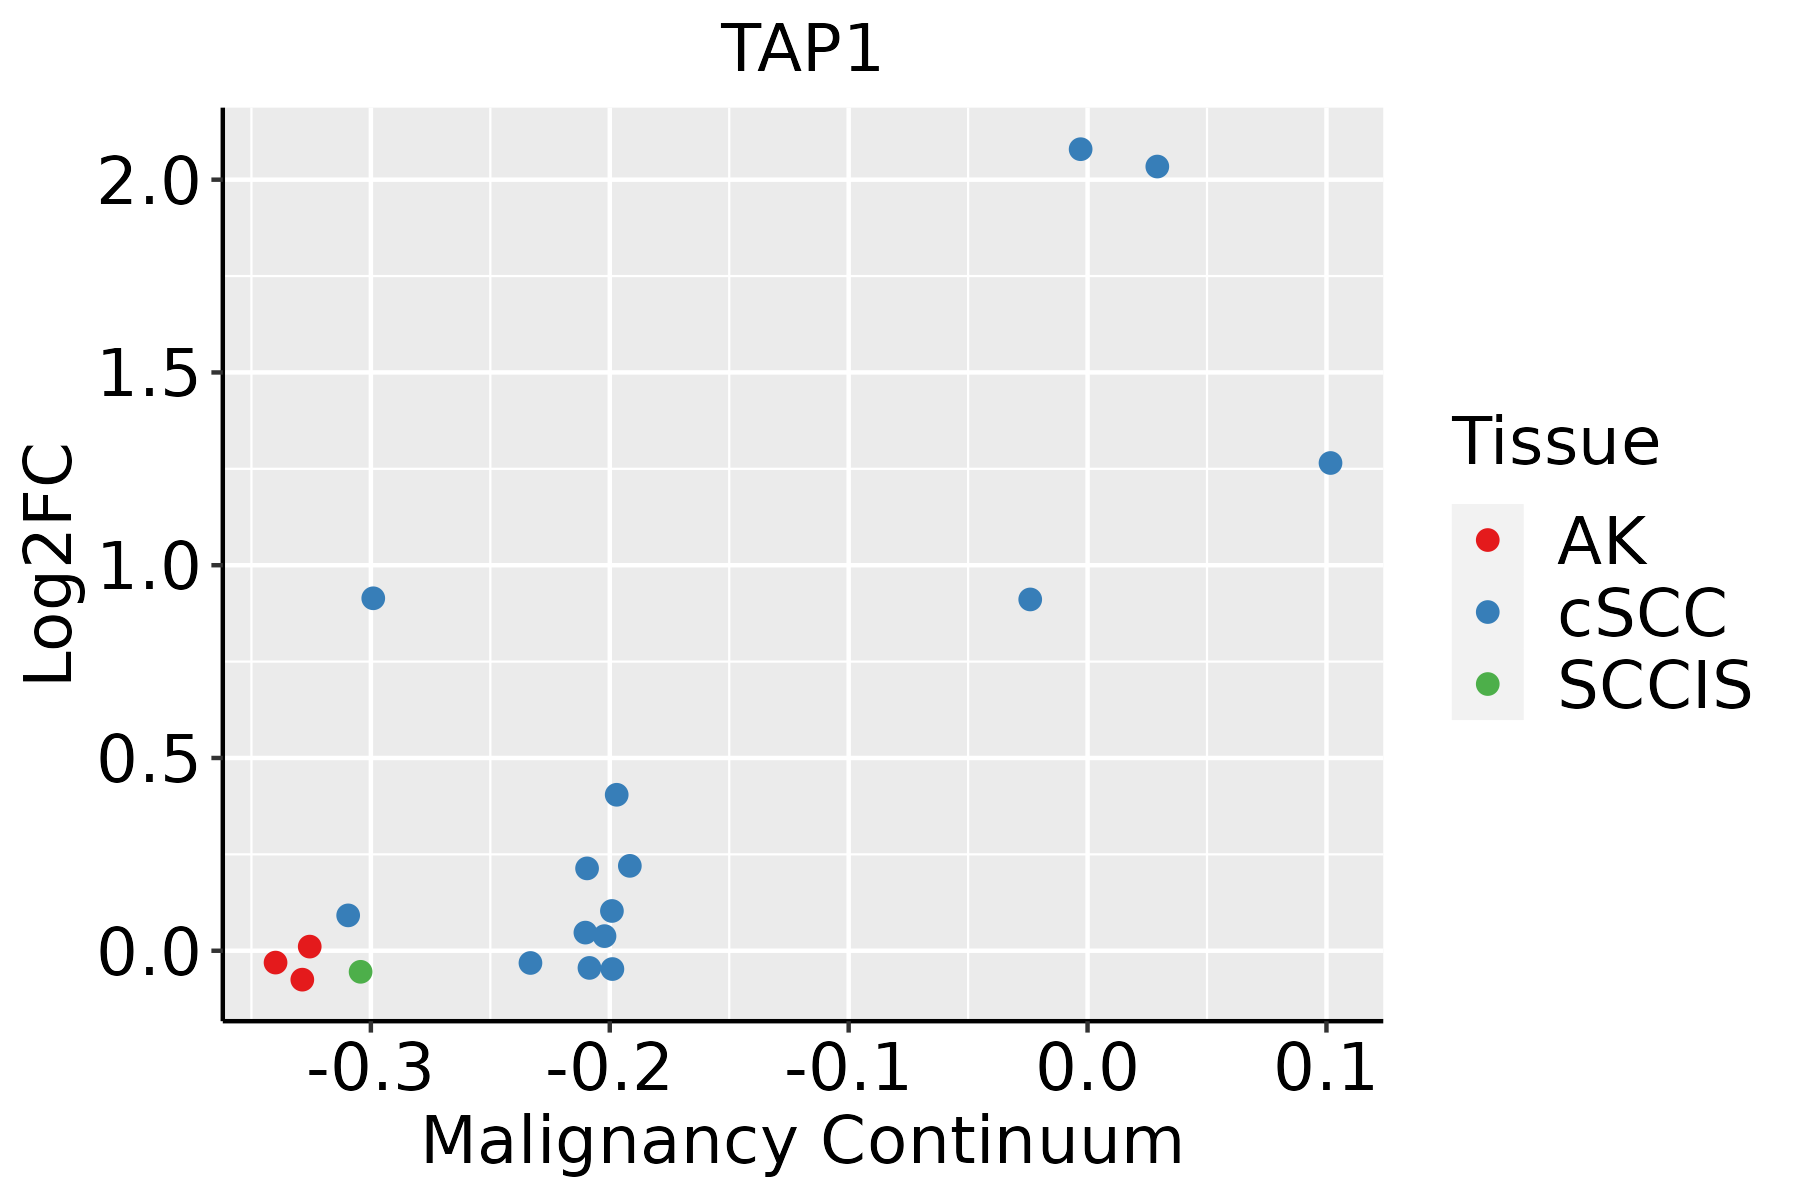 | AK: Actinic keratosis |
| cSCC: Cutaneous squamous cell carcinoma |
| SCCIS:squamous cell carcinoma in situ |
| Thyroid | 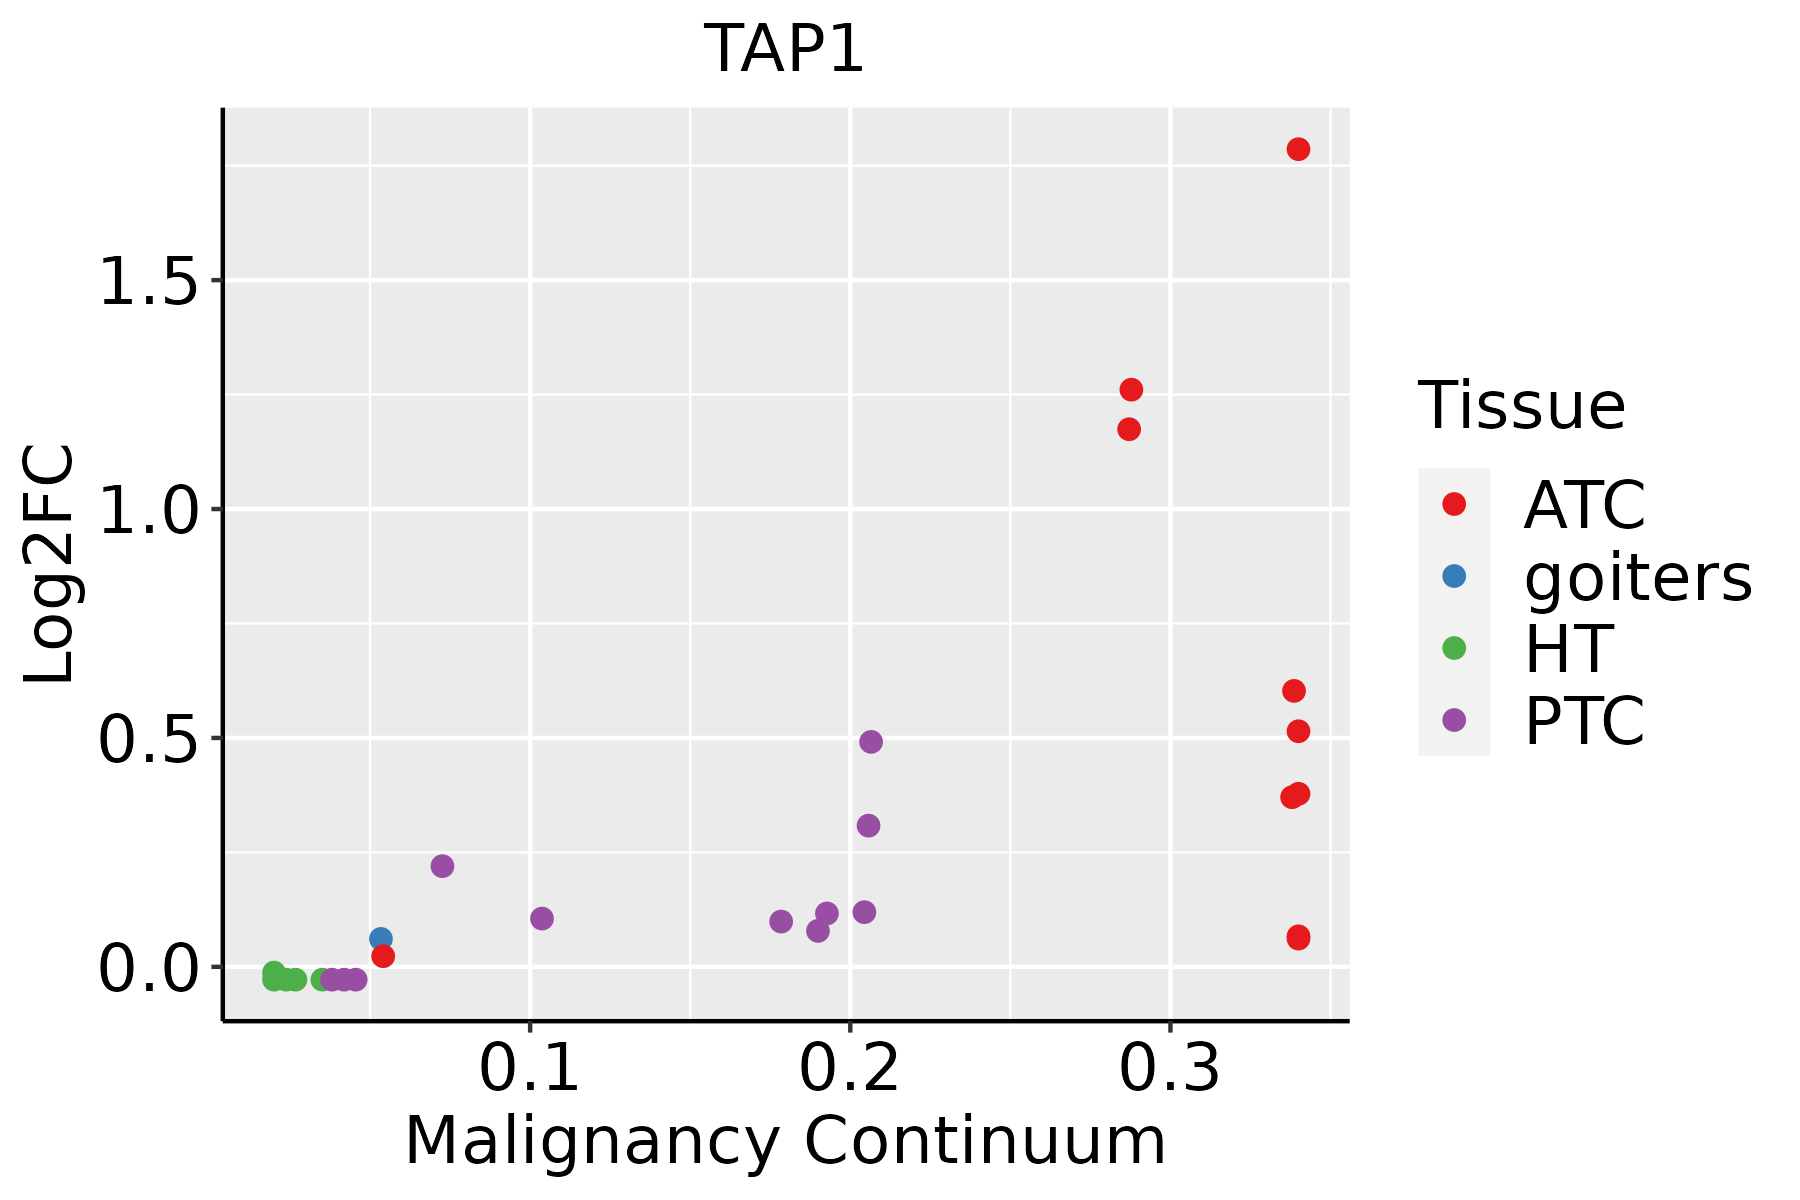 | ATC: Anaplastic thyroid cancer |
| HT: Hashimoto's thyroiditis |
| PTC: Papillary thyroid cancer |
| GO ID | Tissue | Disease Stage | Description | Gene Ratio | Bg Ratio | pvalue | p.adjust | Count |
| GO:004800213 | Breast | IDC | antigen processing and presentation of peptide antigen | 18/1434 | 62/18723 | 5.28e-07 | 2.59e-05 | 18 |
| GO:000247813 | Breast | IDC | antigen processing and presentation of exogenous peptide antigen | 13/1434 | 38/18723 | 2.60e-06 | 1.01e-04 | 13 |
| GO:000248314 | Breast | IDC | antigen processing and presentation of endogenous peptide antigen | 9/1434 | 19/18723 | 4.03e-06 | 1.43e-04 | 9 |
| GO:001988313 | Breast | IDC | antigen processing and presentation of endogenous antigen | 10/1434 | 26/18723 | 1.14e-05 | 3.08e-04 | 10 |
| GO:001988413 | Breast | IDC | antigen processing and presentation of exogenous antigen | 13/1434 | 47/18723 | 3.53e-05 | 8.08e-04 | 13 |
| GO:00198829 | Breast | IDC | antigen processing and presentation | 20/1434 | 106/18723 | 1.41e-04 | 2.49e-03 | 20 |
| GO:001988513 | Breast | IDC | antigen processing and presentation of endogenous peptide antigen via MHC class I | 7/1434 | 17/18723 | 1.49e-04 | 2.61e-03 | 7 |
| GO:000247412 | Breast | IDC | antigen processing and presentation of peptide antigen via MHC class I | 8/1434 | 28/18723 | 9.00e-04 | 1.04e-02 | 8 |
| GO:001583312 | Breast | IDC | peptide transport | 32/1434 | 264/18723 | 6.61e-03 | 4.62e-02 | 32 |
| GO:004800222 | Breast | DCIS | antigen processing and presentation of peptide antigen | 20/1390 | 62/18723 | 1.01e-08 | 7.56e-07 | 20 |
| GO:000247822 | Breast | DCIS | antigen processing and presentation of exogenous peptide antigen | 15/1390 | 38/18723 | 3.22e-08 | 2.09e-06 | 15 |
| GO:001988422 | Breast | DCIS | antigen processing and presentation of exogenous antigen | 15/1390 | 47/18723 | 8.26e-07 | 3.39e-05 | 15 |
| GO:000248323 | Breast | DCIS | antigen processing and presentation of endogenous peptide antigen | 9/1390 | 19/18723 | 3.11e-06 | 1.02e-04 | 9 |
| GO:001988323 | Breast | DCIS | antigen processing and presentation of endogenous antigen | 10/1390 | 26/18723 | 8.68e-06 | 2.37e-04 | 10 |
| GO:001988214 | Breast | DCIS | antigen processing and presentation | 22/1390 | 106/18723 | 8.76e-06 | 2.38e-04 | 22 |
| GO:001988523 | Breast | DCIS | antigen processing and presentation of endogenous peptide antigen via MHC class I | 7/1390 | 17/18723 | 1.23e-04 | 2.12e-03 | 7 |
| GO:000247422 | Breast | DCIS | antigen processing and presentation of peptide antigen via MHC class I | 9/1390 | 28/18723 | 1.26e-04 | 2.18e-03 | 9 |
| GO:000247810 | Cervix | CC | antigen processing and presentation of exogenous peptide antigen | 18/2311 | 38/18723 | 1.20e-07 | 6.06e-06 | 18 |
| GO:004800210 | Cervix | CC | antigen processing and presentation of peptide antigen | 24/2311 | 62/18723 | 1.21e-07 | 6.07e-06 | 24 |
| GO:001988410 | Cervix | CC | antigen processing and presentation of exogenous antigen | 20/2311 | 47/18723 | 2.18e-07 | 9.57e-06 | 20 |
| Pathway ID | Tissue | Disease Stage | Description | Gene Ratio | Bg Ratio | pvalue | p.adjust | qvalue | Count |
| hsa0516922 | Breast | IDC | Epstein-Barr virus infection | 45/867 | 202/8465 | 3.16e-07 | 6.05e-06 | 4.52e-06 | 45 |
| hsa0461223 | Breast | IDC | Antigen processing and presentation | 24/867 | 78/8465 | 4.61e-07 | 8.33e-06 | 6.23e-06 | 24 |
| hsa0414522 | Breast | IDC | Phagosome | 34/867 | 152/8465 | 8.00e-06 | 9.99e-05 | 7.48e-05 | 34 |
| hsa0516324 | Breast | IDC | Human cytomegalovirus infection | 39/867 | 225/8465 | 6.66e-04 | 5.41e-03 | 4.05e-03 | 39 |
| hsa0517014 | Breast | IDC | Human immunodeficiency virus 1 infection | 33/867 | 212/8465 | 9.28e-03 | 4.37e-02 | 3.27e-02 | 33 |
| hsa0516932 | Breast | IDC | Epstein-Barr virus infection | 45/867 | 202/8465 | 3.16e-07 | 6.05e-06 | 4.52e-06 | 45 |
| hsa0461233 | Breast | IDC | Antigen processing and presentation | 24/867 | 78/8465 | 4.61e-07 | 8.33e-06 | 6.23e-06 | 24 |
| hsa0414532 | Breast | IDC | Phagosome | 34/867 | 152/8465 | 8.00e-06 | 9.99e-05 | 7.48e-05 | 34 |
| hsa0516334 | Breast | IDC | Human cytomegalovirus infection | 39/867 | 225/8465 | 6.66e-04 | 5.41e-03 | 4.05e-03 | 39 |
| hsa0517015 | Breast | IDC | Human immunodeficiency virus 1 infection | 33/867 | 212/8465 | 9.28e-03 | 4.37e-02 | 3.27e-02 | 33 |
| hsa0516941 | Breast | DCIS | Epstein-Barr virus infection | 46/846 | 202/8465 | 5.60e-08 | 1.13e-06 | 8.33e-07 | 46 |
| hsa0461242 | Breast | DCIS | Antigen processing and presentation | 25/846 | 78/8465 | 6.75e-08 | 1.28e-06 | 9.45e-07 | 25 |
| hsa0414541 | Breast | DCIS | Phagosome | 35/846 | 152/8465 | 1.67e-06 | 2.45e-05 | 1.81e-05 | 35 |
| hsa0516344 | Breast | DCIS | Human cytomegalovirus infection | 38/846 | 225/8465 | 8.11e-04 | 5.95e-03 | 4.38e-03 | 38 |
| hsa0517024 | Breast | DCIS | Human immunodeficiency virus 1 infection | 33/846 | 212/8465 | 6.49e-03 | 3.22e-02 | 2.37e-02 | 33 |
| hsa0516951 | Breast | DCIS | Epstein-Barr virus infection | 46/846 | 202/8465 | 5.60e-08 | 1.13e-06 | 8.33e-07 | 46 |
| hsa0461252 | Breast | DCIS | Antigen processing and presentation | 25/846 | 78/8465 | 6.75e-08 | 1.28e-06 | 9.45e-07 | 25 |
| hsa0414551 | Breast | DCIS | Phagosome | 35/846 | 152/8465 | 1.67e-06 | 2.45e-05 | 1.81e-05 | 35 |
| hsa0516354 | Breast | DCIS | Human cytomegalovirus infection | 38/846 | 225/8465 | 8.11e-04 | 5.95e-03 | 4.38e-03 | 38 |
| hsa0517034 | Breast | DCIS | Human immunodeficiency virus 1 infection | 33/846 | 212/8465 | 6.49e-03 | 3.22e-02 | 2.37e-02 | 33 |
| Hugo Symbol | Variant Class | Variant Classification | dbSNP RS | HGVSc | HGVSp | HGVSp Short | SWISSPROT | BIOTYPE | SIFT | PolyPhen | Tumor Sample Barcode | Tissue | Histology | Sex | Age | Stage | Therapy Types | Drugs | Outcome |
| TAP1 | SNV | Missense_Mutation | novel | c.516G>C | p.Leu172Phe | p.L172F | Q03518 | protein_coding | tolerated(0.05) | benign(0.261) | TCGA-A2-A0D4-01 | Breast | breast invasive carcinoma | Female | <65 | I/II | Chemotherapy | adriamycin | SD |
| TAP1 | SNV | Missense_Mutation | novel | c.1356A>C | p.Glu452Asp | p.E452D | Q03518 | protein_coding | tolerated(0.21) | benign(0.038) | TCGA-AN-A046-01 | Breast | breast invasive carcinoma | Female | >=65 | I/II | Unknown | Unknown | SD |
| TAP1 | SNV | Missense_Mutation | | c.1601N>A | p.Ser534Tyr | p.S534Y | Q03518 | protein_coding | deleterious(0) | possibly_damaging(0.578) | TCGA-BH-A0HP-01 | Breast | breast invasive carcinoma | Female | >=65 | III/IV | Chemotherapy | doxorubicin | SD |
| TAP1 | insertion | Nonsense_Mutation | novel | c.591_592insCTCCTCTCTTGGTAAGGGGAACGCAGGGCAAGAGGGGAGGAC | p.Pro197_Thr198insLeuLeuSerTrpTerGlyGluArgArgAlaArgGlyGluAsp | p.P197_T198insLLSW*GERRARGED | Q03518 | protein_coding | | | TCGA-A8-A08H-01 | Breast | breast invasive carcinoma | Female | >=65 | I/II | Unknown | Unknown | SD |
| TAP1 | SNV | Missense_Mutation | rs550037204 | c.809G>A | p.Arg270His | p.R270H | Q03518 | protein_coding | tolerated(0.07) | benign(0.115) | TCGA-2W-A8YY-01 | Cervix | cervical & endocervical cancer | Female | <65 | I/II | Chemotherapy | cisplatin | CR |
| TAP1 | SNV | Missense_Mutation | rs777683307 | c.1336N>A | p.Glu446Lys | p.E446K | Q03518 | protein_coding | deleterious(0) | probably_damaging(0.966) | TCGA-C5-A8XK-01 | Cervix | cervical & endocervical cancer | Female | <65 | I/II | Chemotherapy | cisplatin | SD |
| TAP1 | SNV | Missense_Mutation | | c.2200G>A | p.Asp734Asn | p.D734N | Q03518 | protein_coding | deleterious(0.01) | probably_damaging(0.999) | TCGA-Q1-A73O-01 | Cervix | cervical & endocervical cancer | Female | <65 | I/II | Chemotherapy | cisplatin | CR |
| TAP1 | SNV | Missense_Mutation | | c.1099C>A | p.Leu367Met | p.L367M | Q03518 | protein_coding | tolerated(0.56) | benign(0.225) | TCGA-A6-5665-01 | Colorectum | colon adenocarcinoma | Female | >=65 | I/II | Unknown | Unknown | PD |
| TAP1 | SNV | Missense_Mutation | | c.473N>A | p.Pro158Gln | p.P158Q | Q03518 | protein_coding | deleterious(0.02) | possibly_damaging(0.823) | TCGA-A6-6780-01 | Colorectum | colon adenocarcinoma | Male | >=65 | I/II | Unknown | Unknown | SD |
| TAP1 | SNV | Missense_Mutation | | c.1115G>A | p.Arg372Gln | p.R372Q | Q03518 | protein_coding | deleterious(0) | probably_damaging(1) | TCGA-AA-A00N-01 | Colorectum | colon adenocarcinoma | Male | >=65 | I/II | Unknown | Unknown | PD |


