
|
|||||
|
 | |
| |
| |
| |
| |
| |
|
Gene: TAOK3 |
Gene summary for TAOK3 |
| Gene information | Species | Human | Gene symbol | TAOK3 | Gene ID | 51347 |
| Gene name | TAO kinase 3 | |
| Gene Alias | DPK | |
| Cytomap | 12q24.23 | |
| Gene Type | protein-coding | GO ID | GO:0000075 | UniProtAcc | Q9H2K8 |
Top |
Malignant transformation analysis |
| Identification of the aberrant gene expression in precancerous and cancerous lesions by comparing the gene expression of stem-like cells in diseased tissues with normal stem cells |
| Entrez ID | Symbol | Replicates | Species | Organ | Tissue | Adj P-value | Log2FC | Malignancy |
| 51347 | TAOK3 | HTA11_2487_2000001011 | Human | Colorectum | SER | 2.69e-05 | 5.53e-01 | -0.1808 |
| 51347 | TAOK3 | HTA11_347_2000001011 | Human | Colorectum | AD | 3.03e-32 | 1.11e+00 | -0.1954 |
| 51347 | TAOK3 | HTA11_411_2000001011 | Human | Colorectum | SER | 3.16e-09 | 1.19e+00 | -0.2602 |
| 51347 | TAOK3 | HTA11_2112_2000001011 | Human | Colorectum | SER | 1.35e-03 | 7.20e-01 | -0.2196 |
| 51347 | TAOK3 | HTA11_696_2000001011 | Human | Colorectum | AD | 5.52e-06 | 5.33e-01 | -0.1464 |
| 51347 | TAOK3 | HTA11_866_2000001011 | Human | Colorectum | AD | 7.54e-06 | 4.54e-01 | -0.1001 |
| 51347 | TAOK3 | HTA11_1391_2000001011 | Human | Colorectum | AD | 9.20e-04 | 4.87e-01 | -0.059 |
| 51347 | TAOK3 | HTA11_99999965062_69753 | Human | Colorectum | MSI-H | 1.01e-18 | 1.39e+00 | 0.3487 |
| 51347 | TAOK3 | HTA11_99999965104_69814 | Human | Colorectum | MSS | 2.34e-42 | 2.43e+00 | 0.281 |
| 51347 | TAOK3 | HTA11_99999974143_84620 | Human | Colorectum | MSS | 1.88e-08 | -4.69e-01 | 0.3005 |
| 51347 | TAOK3 | F007 | Human | Colorectum | FAP | 3.87e-03 | -3.98e-01 | 0.1176 |
| 51347 | TAOK3 | A002-C-010 | Human | Colorectum | FAP | 2.98e-03 | -3.05e-01 | 0.242 |
| 51347 | TAOK3 | A001-C-207 | Human | Colorectum | FAP | 2.09e-03 | -3.01e-01 | 0.1278 |
| 51347 | TAOK3 | A015-C-203 | Human | Colorectum | FAP | 9.65e-39 | -6.91e-01 | -0.1294 |
| 51347 | TAOK3 | A015-C-204 | Human | Colorectum | FAP | 1.03e-14 | -5.83e-01 | -0.0228 |
| 51347 | TAOK3 | A014-C-040 | Human | Colorectum | FAP | 3.82e-10 | -7.72e-01 | -0.1184 |
| 51347 | TAOK3 | A002-C-201 | Human | Colorectum | FAP | 1.21e-20 | -5.84e-01 | 0.0324 |
| 51347 | TAOK3 | A002-C-203 | Human | Colorectum | FAP | 1.69e-03 | -2.92e-01 | 0.2786 |
| 51347 | TAOK3 | A001-C-119 | Human | Colorectum | FAP | 2.23e-09 | -3.57e-01 | -0.1557 |
| 51347 | TAOK3 | A001-C-108 | Human | Colorectum | FAP | 6.65e-21 | -4.09e-01 | -0.0272 |
| Page: 1 2 3 4 5 6 7 8 9 10 11 |
| Tissue | Expression Dynamics | Abbreviation |
| Colorectum (GSE201348) |  | FAP: Familial adenomatous polyposis |
| CRC: Colorectal cancer | ||
| Colorectum (HTA11) |  | AD: Adenomas |
| SER: Sessile serrated lesions | ||
| MSI-H: Microsatellite-high colorectal cancer | ||
| MSS: Microsatellite stable colorectal cancer | ||
| Esophagus | 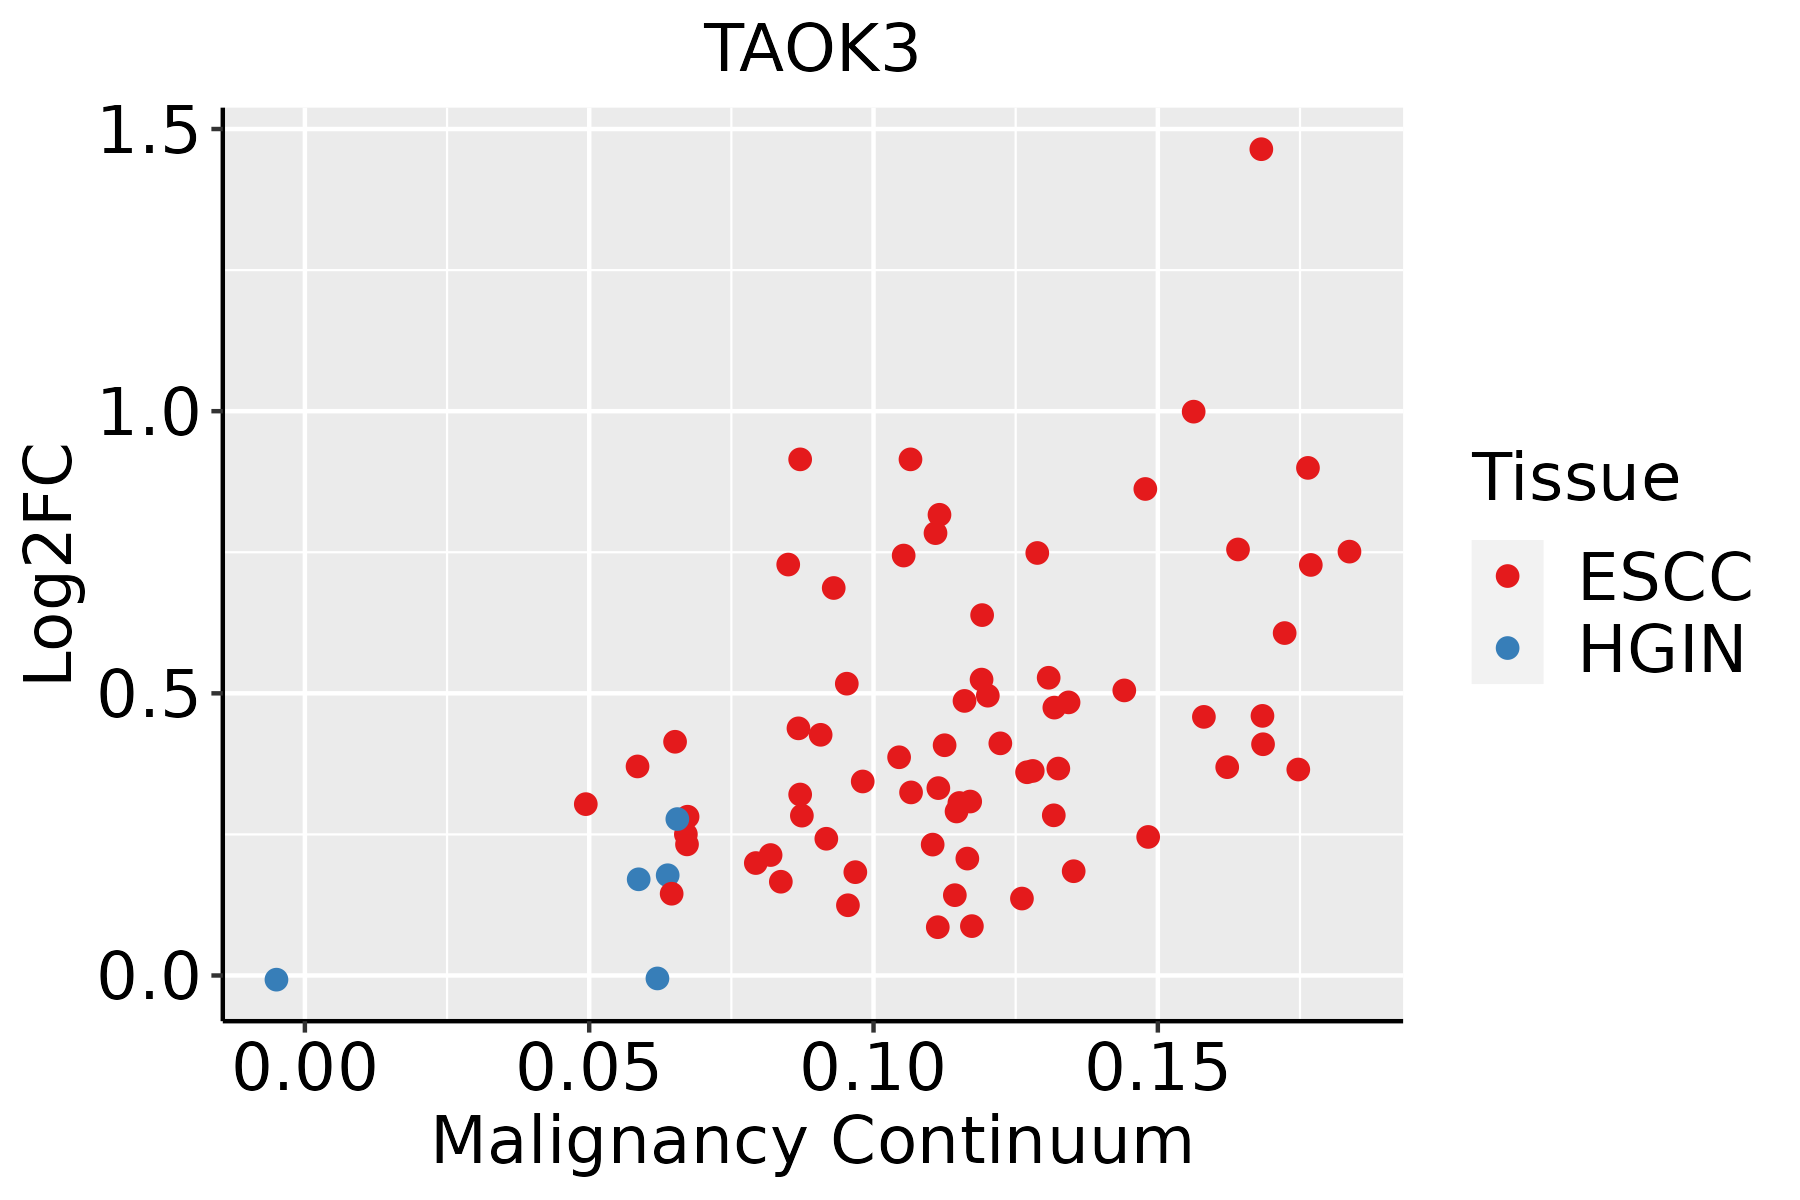 | ESCC: Esophageal squamous cell carcinoma |
| HGIN: High-grade intraepithelial neoplasias | ||
| LGIN: Low-grade intraepithelial neoplasias | ||
| GC | 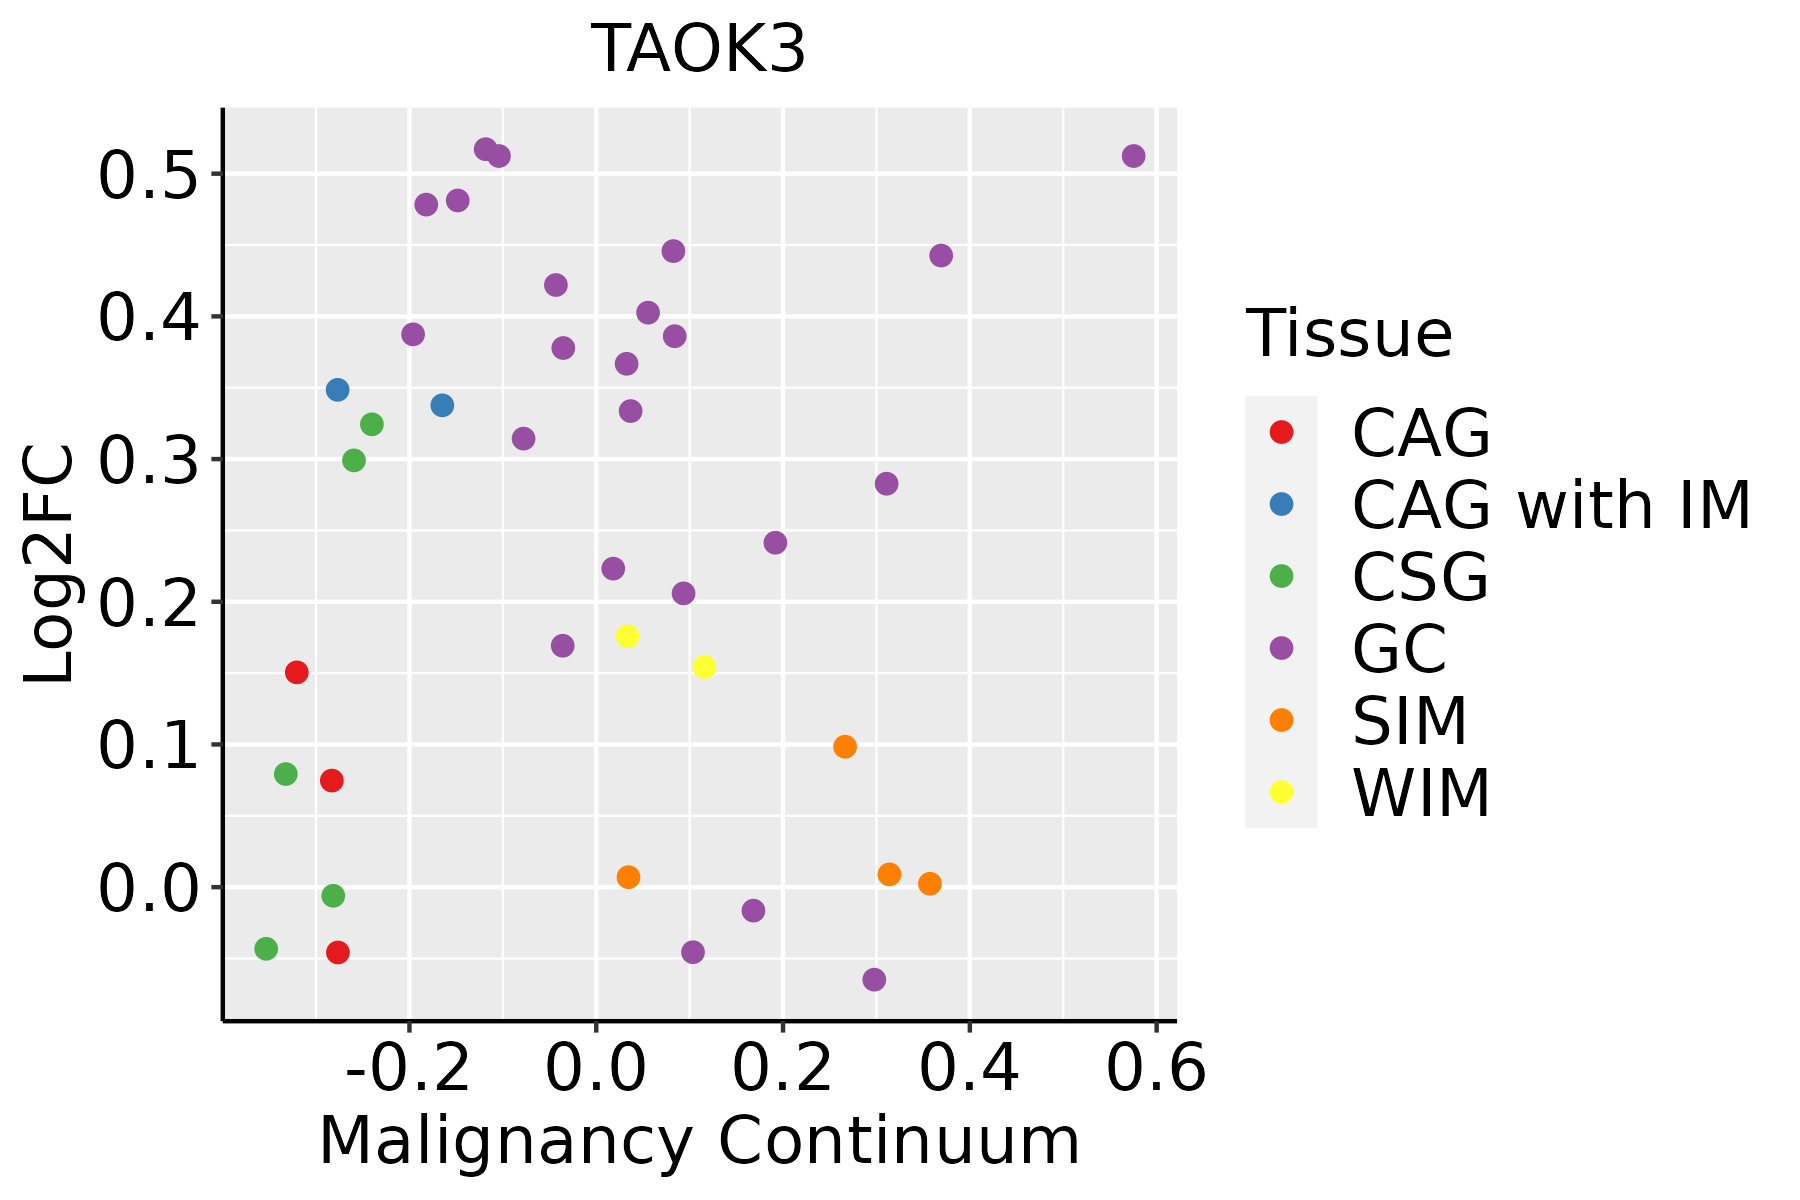 | CAG: Chronic atrophic gastritis |
| CAG with IM: Chronic atrophic gastritis with intestinal metaplasia | ||
| CSG: Chronic superficial gastritis | ||
| GC: Gastric cancer | ||
| SIM: Severe intestinal metaplasia | ||
| WIM: Wild intestinal metaplasia | ||
| Liver |  | HCC: Hepatocellular carcinoma |
| NAFLD: Non-alcoholic fatty liver disease | ||
| Lung | 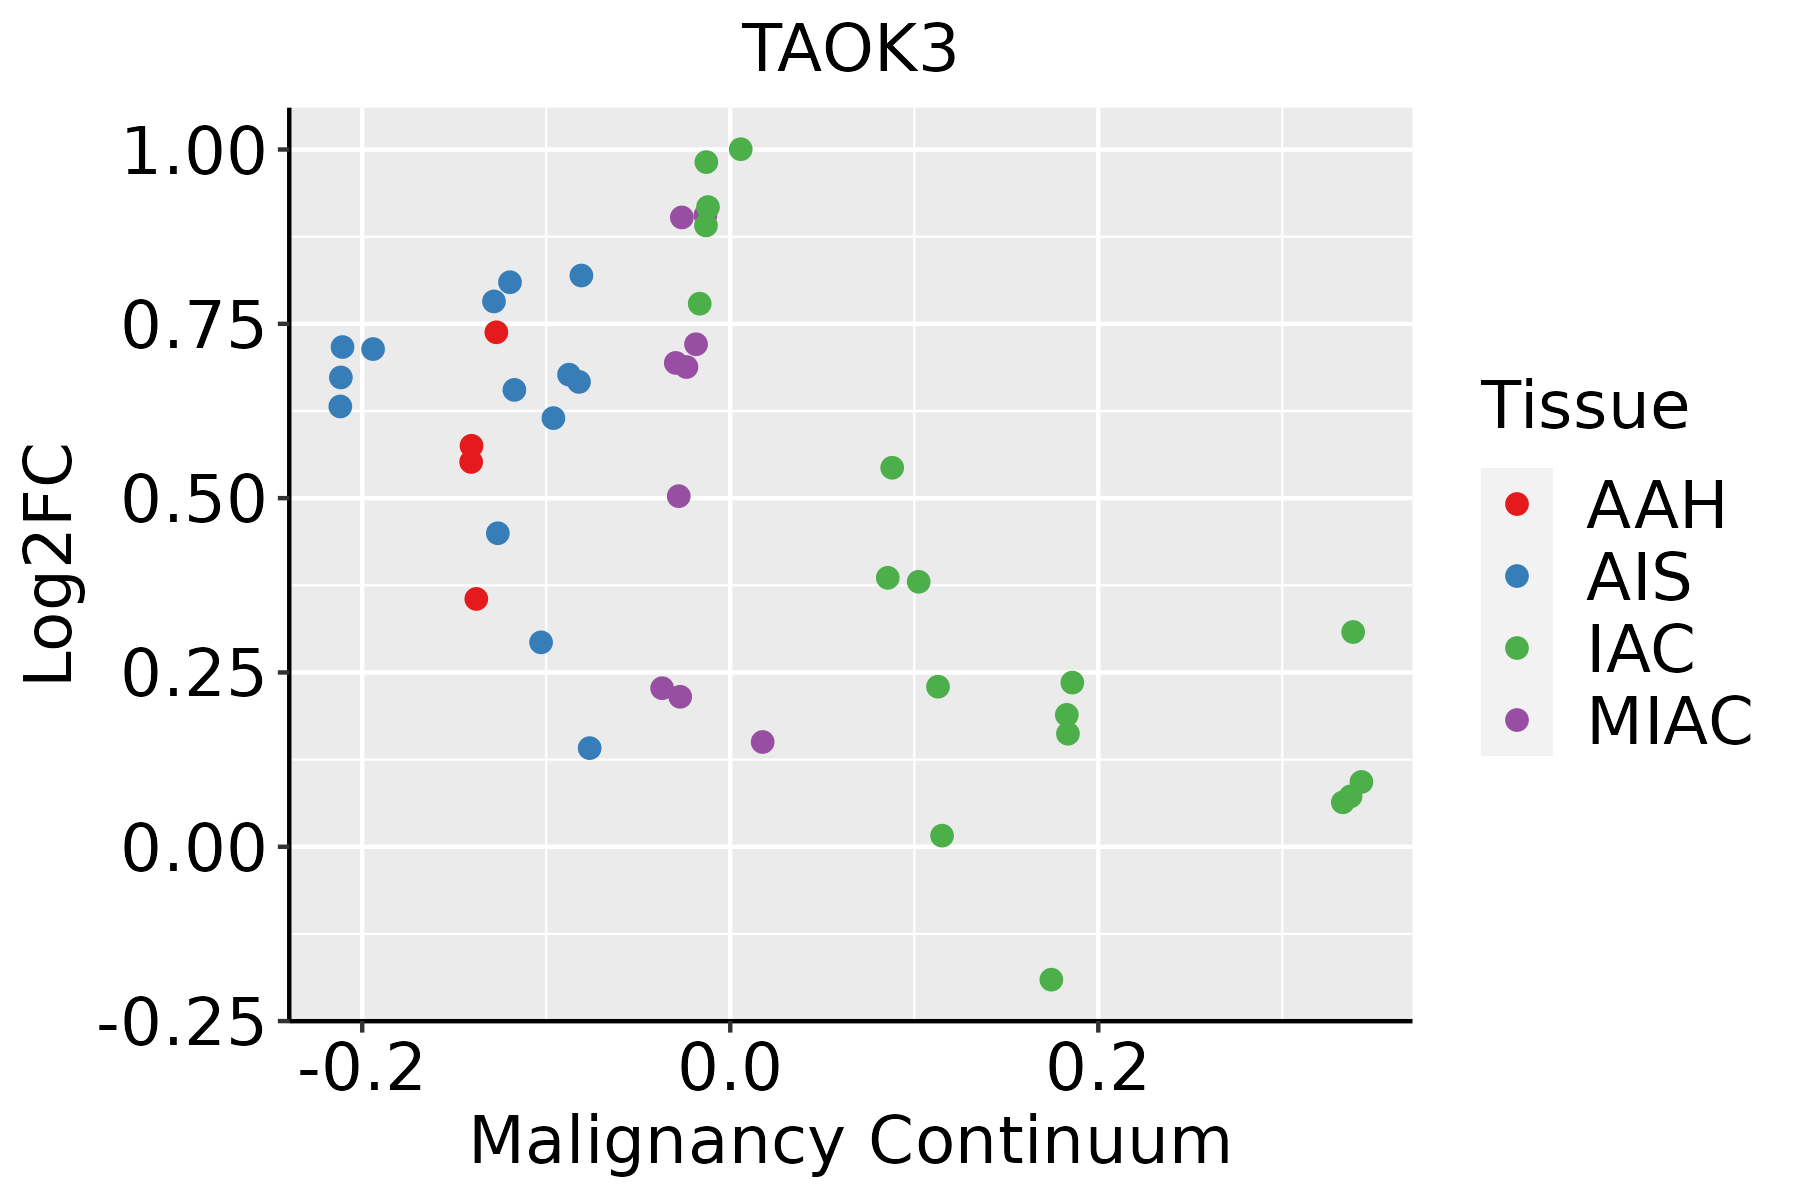 | AAH: Atypical adenomatous hyperplasia |
| AIS: Adenocarcinoma in situ | ||
| IAC: Invasive lung adenocarcinoma | ||
| MIA: Minimally invasive adenocarcinoma | ||
| Oral Cavity |  | EOLP: Erosive Oral lichen planus |
| LP: leukoplakia | ||
| NEOLP: Non-erosive oral lichen planus | ||
| OSCC: Oral squamous cell carcinoma | ||
| Prostate | 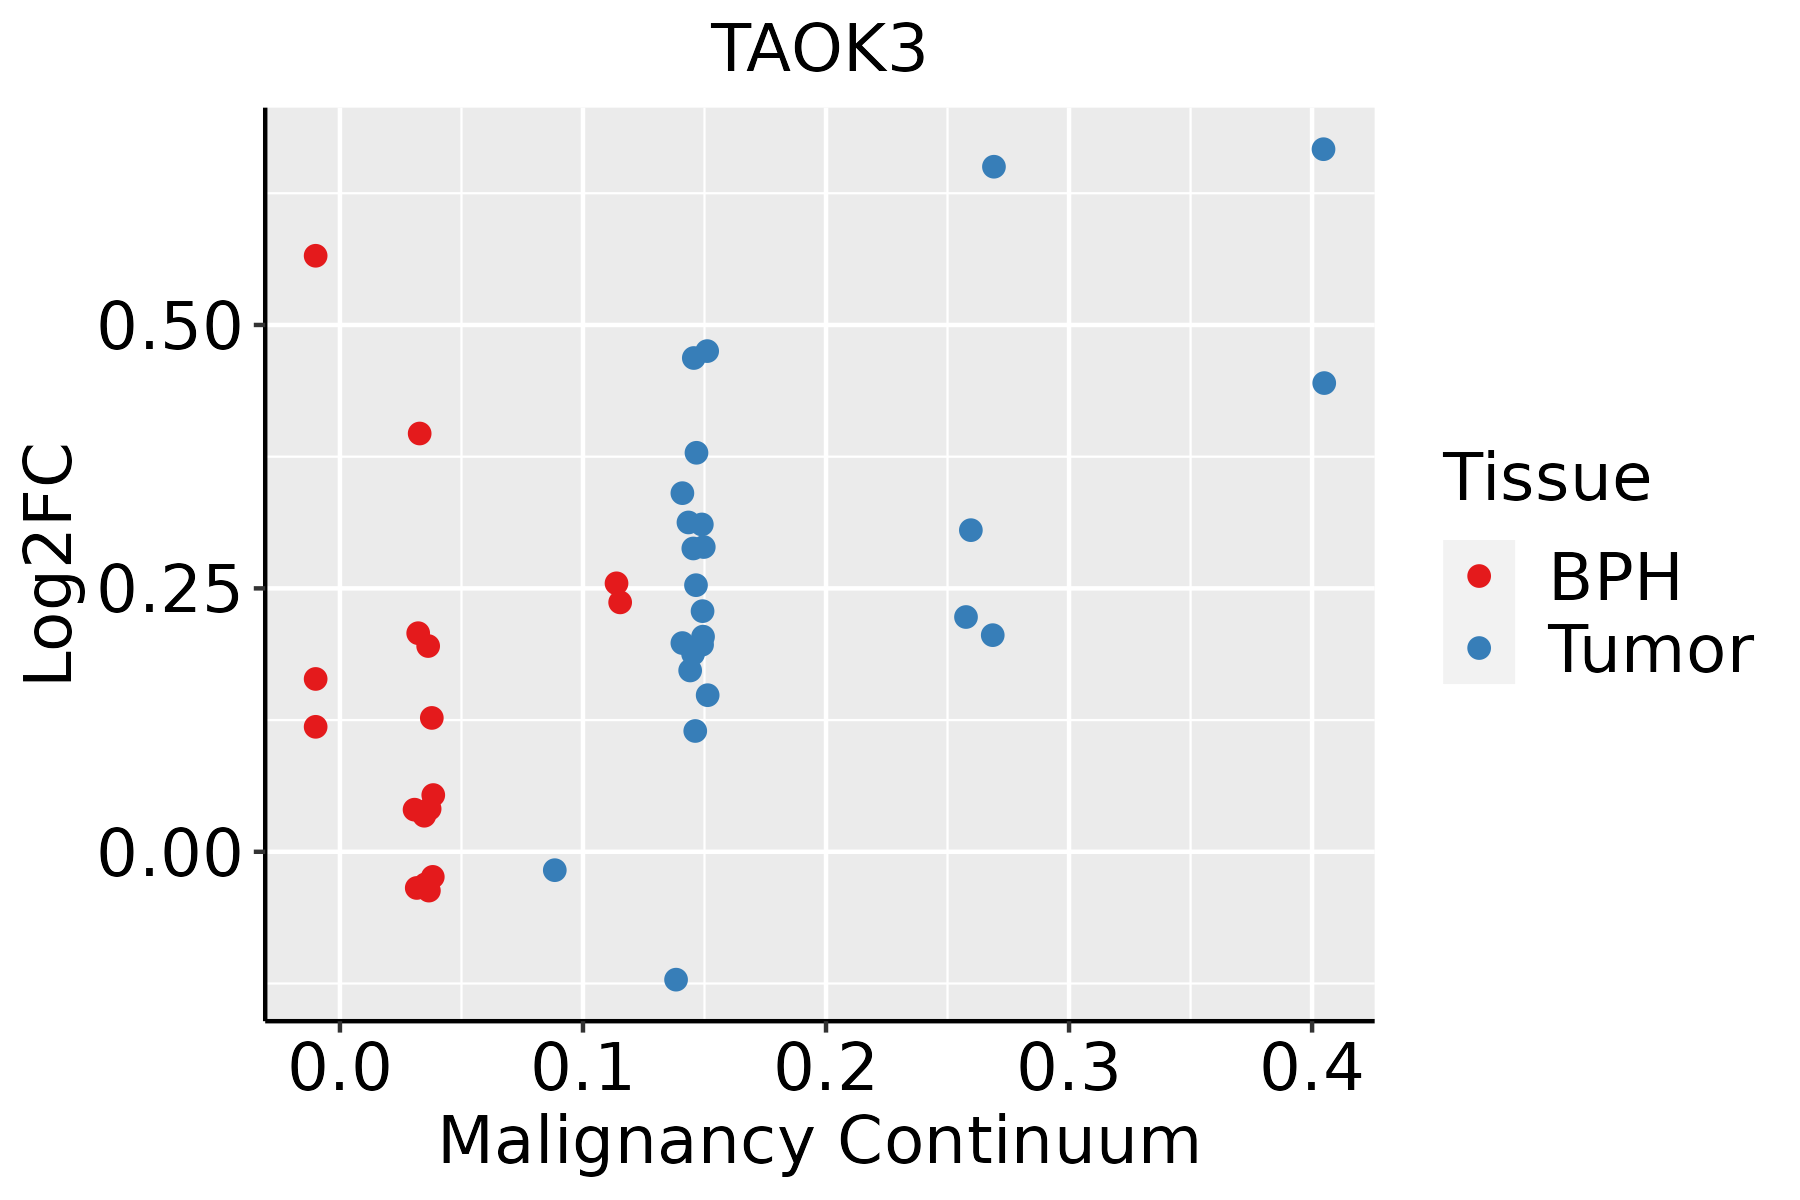 | BPH: Benign Prostatic Hyperplasia |
| Skin |  | AK: Actinic keratosis |
| cSCC: Cutaneous squamous cell carcinoma | ||
| SCCIS:squamous cell carcinoma in situ | ||
| Thyroid | 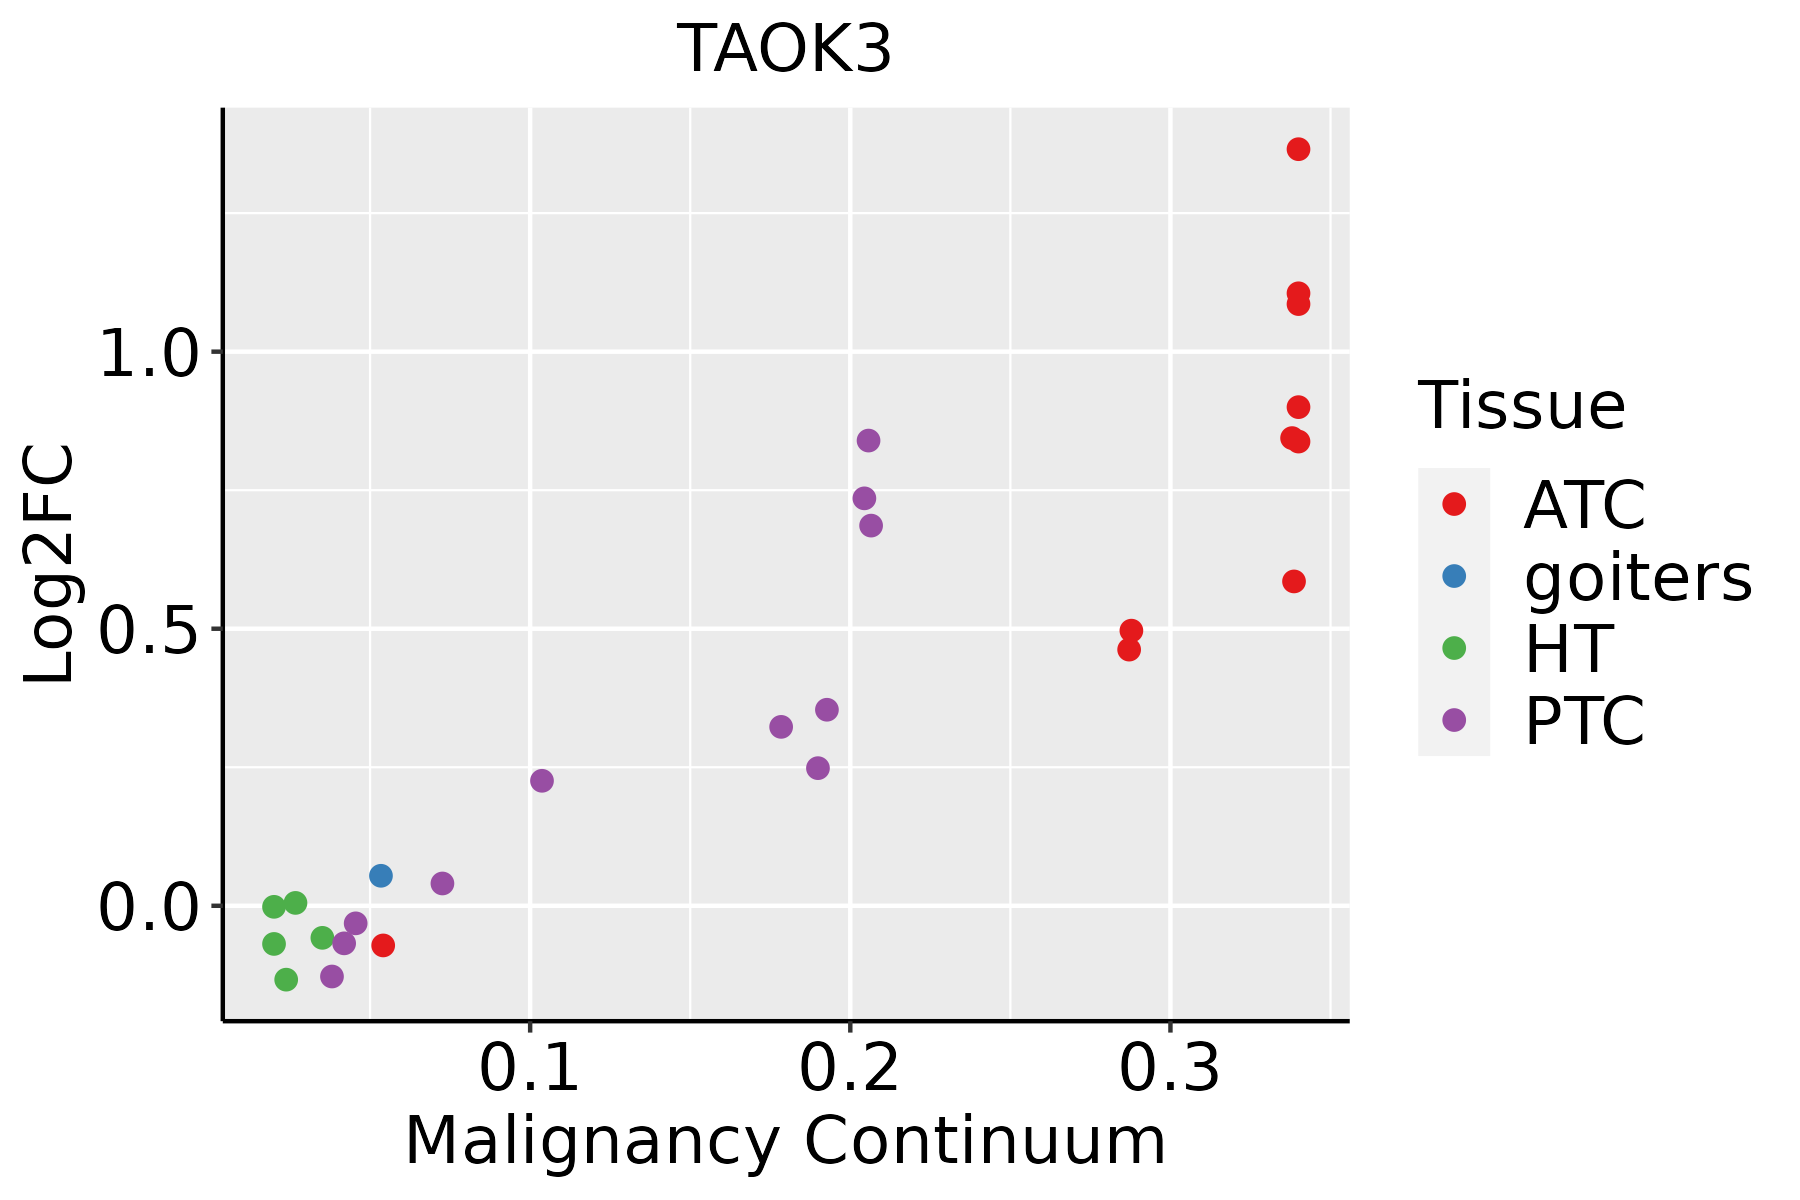 | ATC: Anaplastic thyroid cancer |
| HT: Hashimoto's thyroiditis | ||
| PTC: Papillary thyroid cancer |
| ∗log2FC in expression of this searched gene in stem-like cells from each diseased tissue sample relative to stem-like cells in normal samples in each tissue plotted against the malignancy continuum. Samples are colored based on if they are from different disease stage. |
Top |
Malignant transformation related pathway analysis |
| Find out the enriched GO biological processes and KEGG pathways involved in transition from healthy to precancer to cancer |
| Tissue | Disease Stage | Enriched GO biological Processes |
| Colorectum | AD |  |
| Colorectum | SER |  |
| Colorectum | MSS |  |
| Colorectum | MSI-H |  |
| Colorectum | FAP |  |
| ∗Top 15 enriched GO BP terms are showed in the bar plot of each disease state in each tissue. Each row represents a significant GO biological process which is colored according to the -log10(p.adjust). |
| Page: 1 2 3 4 5 6 7 8 9 |
| GO ID | Tissue | Disease Stage | Description | Gene Ratio | Bg Ratio | pvalue | p.adjust | Count |
| GO:0046777 | Colorectum | AD | protein autophosphorylation | 74/3918 | 227/18723 | 2.48e-05 | 4.76e-04 | 74 |
| GO:0033674 | Colorectum | AD | positive regulation of kinase activity | 131/3918 | 467/18723 | 1.28e-04 | 1.85e-03 | 131 |
| GO:0043409 | Colorectum | AD | negative regulation of MAPK cascade | 57/3918 | 180/18723 | 4.61e-04 | 5.14e-03 | 57 |
| GO:0051403 | Colorectum | AD | stress-activated MAPK cascade | 72/3918 | 239/18723 | 4.77e-04 | 5.25e-03 | 72 |
| GO:0031098 | Colorectum | AD | stress-activated protein kinase signaling cascade | 74/3918 | 247/18723 | 4.80e-04 | 5.27e-03 | 74 |
| GO:0045860 | Colorectum | AD | positive regulation of protein kinase activity | 107/3918 | 386/18723 | 8.01e-04 | 7.92e-03 | 107 |
| GO:0071900 | Colorectum | AD | regulation of protein serine/threonine kinase activity | 98/3918 | 359/18723 | 2.18e-03 | 1.73e-02 | 98 |
| GO:0070302 | Colorectum | AD | regulation of stress-activated protein kinase signaling cascade | 58/3918 | 195/18723 | 2.21e-03 | 1.74e-02 | 58 |
| GO:0032872 | Colorectum | AD | regulation of stress-activated MAPK cascade | 57/3918 | 192/18723 | 2.51e-03 | 1.92e-02 | 57 |
| GO:0071902 | Colorectum | AD | positive regulation of protein serine/threonine kinase activity | 58/3918 | 200/18723 | 4.09e-03 | 2.84e-02 | 58 |
| GO:0007346 | Colorectum | AD | regulation of mitotic cell cycle | 119/3918 | 457/18723 | 4.60e-03 | 3.14e-02 | 119 |
| GO:0032873 | Colorectum | AD | negative regulation of stress-activated MAPK cascade | 19/3918 | 51/18723 | 5.44e-03 | 3.55e-02 | 19 |
| GO:0070303 | Colorectum | AD | negative regulation of stress-activated protein kinase signaling cascade | 19/3918 | 51/18723 | 5.44e-03 | 3.55e-02 | 19 |
| GO:00467771 | Colorectum | SER | protein autophosphorylation | 60/2897 | 227/18723 | 1.36e-05 | 4.25e-04 | 60 |
| GO:00434091 | Colorectum | SER | negative regulation of MAPK cascade | 45/2897 | 180/18723 | 5.81e-04 | 7.98e-03 | 45 |
| GO:00336741 | Colorectum | SER | positive regulation of kinase activity | 95/2897 | 467/18723 | 2.62e-03 | 2.41e-02 | 95 |
| GO:00310981 | Colorectum | SER | stress-activated protein kinase signaling cascade | 54/2897 | 247/18723 | 4.65e-03 | 3.67e-02 | 54 |
| GO:00458601 | Colorectum | SER | positive regulation of protein kinase activity | 79/2897 | 386/18723 | 4.85e-03 | 3.79e-02 | 79 |
| GO:00719001 | Colorectum | SER | regulation of protein serine/threonine kinase activity | 74/2897 | 359/18723 | 5.22e-03 | 3.96e-02 | 74 |
| GO:00514031 | Colorectum | SER | stress-activated MAPK cascade | 52/2897 | 239/18723 | 5.96e-03 | 4.35e-02 | 52 |
| Page: 1 2 3 4 5 6 7 8 9 10 11 12 13 14 15 16 17 18 19 20 21 22 23 24 25 26 27 28 29 |
| Pathway ID | Tissue | Disease Stage | Description | Gene Ratio | Bg Ratio | pvalue | p.adjust | qvalue | Count |
| hsa04010 | Colorectum | FAP | MAPK signaling pathway | 68/1404 | 302/8465 | 4.00e-03 | 1.67e-02 | 1.02e-02 | 68 |
| hsa040101 | Colorectum | FAP | MAPK signaling pathway | 68/1404 | 302/8465 | 4.00e-03 | 1.67e-02 | 1.02e-02 | 68 |
| hsa040102 | Colorectum | CRC | MAPK signaling pathway | 56/1091 | 302/8465 | 2.76e-03 | 1.77e-02 | 1.20e-02 | 56 |
| hsa040103 | Colorectum | CRC | MAPK signaling pathway | 56/1091 | 302/8465 | 2.76e-03 | 1.77e-02 | 1.20e-02 | 56 |
| hsa040108 | Lung | IAC | MAPK signaling pathway | 62/1053 | 302/8465 | 3.54e-05 | 6.38e-04 | 4.24e-04 | 62 |
| hsa0401011 | Lung | IAC | MAPK signaling pathway | 62/1053 | 302/8465 | 3.54e-05 | 6.38e-04 | 4.24e-04 | 62 |
| hsa0401021 | Lung | AIS | MAPK signaling pathway | 57/961 | 302/8465 | 6.41e-05 | 9.43e-04 | 6.03e-04 | 57 |
| hsa0401031 | Lung | AIS | MAPK signaling pathway | 57/961 | 302/8465 | 6.41e-05 | 9.43e-04 | 6.03e-04 | 57 |
| hsa040104 | Lung | AAH | MAPK signaling pathway | 27/348 | 302/8465 | 1.13e-04 | 6.32e-03 | 5.08e-03 | 27 |
| hsa040105 | Lung | AAH | MAPK signaling pathway | 27/348 | 302/8465 | 1.13e-04 | 6.32e-03 | 5.08e-03 | 27 |
| hsa0401014 | Oral cavity | OSCC | MAPK signaling pathway | 165/3704 | 302/8465 | 7.11e-05 | 2.74e-04 | 1.40e-04 | 165 |
| hsa0401015 | Oral cavity | OSCC | MAPK signaling pathway | 165/3704 | 302/8465 | 7.11e-05 | 2.74e-04 | 1.40e-04 | 165 |
| hsa0401023 | Oral cavity | EOLP | MAPK signaling pathway | 68/1218 | 302/8465 | 7.48e-05 | 3.40e-04 | 2.01e-04 | 68 |
| hsa0401033 | Oral cavity | EOLP | MAPK signaling pathway | 68/1218 | 302/8465 | 7.48e-05 | 3.40e-04 | 2.01e-04 | 68 |
| hsa0401041 | Oral cavity | NEOLP | MAPK signaling pathway | 59/1112 | 302/8465 | 9.40e-04 | 4.67e-03 | 2.94e-03 | 59 |
| hsa0401051 | Oral cavity | NEOLP | MAPK signaling pathway | 59/1112 | 302/8465 | 9.40e-04 | 4.67e-03 | 2.94e-03 | 59 |
| hsa0401010 | Prostate | BPH | MAPK signaling pathway | 87/1718 | 302/8465 | 2.05e-04 | 1.13e-03 | 6.98e-04 | 87 |
| hsa0401013 | Prostate | BPH | MAPK signaling pathway | 87/1718 | 302/8465 | 2.05e-04 | 1.13e-03 | 6.98e-04 | 87 |
| hsa0401022 | Prostate | Tumor | MAPK signaling pathway | 87/1791 | 302/8465 | 8.46e-04 | 3.94e-03 | 2.45e-03 | 87 |
| hsa0401032 | Prostate | Tumor | MAPK signaling pathway | 87/1791 | 302/8465 | 8.46e-04 | 3.94e-03 | 2.45e-03 | 87 |
| Page: 1 |
Top |
Cell-cell communication analysis |
| Identification of potential cell-cell interactions between two cell types and their ligand-receptor pairs for different disease states |
| Ligand | Receptor | LRpair | Pathway | Tissue | Disease Stage |
| Page: 1 |
Top |
Single-cell gene regulatory network inference analysis |
| Find out the significant the regulons (TFs) and the target genes of each regulon across cell types for different disease states |
| TF | Cell Type | Tissue | Disease Stage | Target Gene | RSS | Regulon Activity |
| ∗The dot plots of a searched regulon are shown for all cell subpopulations in each disease state of each tissue based on the regulon specific score inferred using pySCENIC and by calculating the average expression. |
| Page: 1 |
Top |
Somatic mutation of malignant transformation related genes |
| Annotation of somatic variants for genes involved in malignant transformation |
| Hugo Symbol | Variant Class | Variant Classification | dbSNP RS | HGVSc | HGVSp | HGVSp Short | SWISSPROT | BIOTYPE | SIFT | PolyPhen | Tumor Sample Barcode | Tissue | Histology | Sex | Age | Stage | Therapy Types | Drugs | Outcome |
| TAOK3 | SNV | Missense_Mutation | novel | c.2532G>C | p.Gln844His | p.Q844H | Q9H2K8 | protein_coding | deleterious(0.02) | benign(0.03) | TCGA-5L-AAT1-01 | Breast | breast invasive carcinoma | Female | <65 | III/IV | Hormone Therapy | letrozol | SD |
| TAOK3 | SNV | Missense_Mutation | novel | c.326C>T | p.Ser109Phe | p.S109F | Q9H2K8 | protein_coding | deleterious(0) | possibly_damaging(0.761) | TCGA-A8-A09B-01 | Breast | breast invasive carcinoma | Female | <65 | III/IV | Chemotherapy | 5-fluorouracil | SD |
| TAOK3 | SNV | Missense_Mutation | novel | c.440N>G | p.Asp147Gly | p.D147G | Q9H2K8 | protein_coding | deleterious(0) | probably_damaging(0.999) | TCGA-BH-A0DI-01 | Breast | breast invasive carcinoma | Female | <65 | I/II | Chemotherapy | adriamycin | CR |
| TAOK3 | SNV | Missense_Mutation | c.1485N>T | p.Lys495Asn | p.K495N | Q9H2K8 | protein_coding | deleterious(0) | probably_damaging(0.938) | TCGA-BH-A18S-01 | Breast | breast invasive carcinoma | Female | >=65 | I/II | Unknown | Unknown | SD | |
| TAOK3 | SNV | Missense_Mutation | c.1603C>A | p.Gln535Lys | p.Q535K | Q9H2K8 | protein_coding | tolerated(0.72) | benign(0.109) | TCGA-D8-A1JL-01 | Breast | breast invasive carcinoma | Female | >=65 | I/II | Unknown | Unknown | SD | |
| TAOK3 | SNV | Missense_Mutation | c.2423N>C | p.Leu808Pro | p.L808P | Q9H2K8 | protein_coding | deleterious(0) | probably_damaging(0.973) | TCGA-E2-A15G-01 | Breast | breast invasive carcinoma | Female | >=65 | I/II | Hormone Therapy | arimidex | SD | |
| TAOK3 | SNV | Missense_Mutation | c.2117N>A | p.Arg706Gln | p.R706Q | Q9H2K8 | protein_coding | deleterious(0) | possibly_damaging(0.573) | TCGA-E2-A1B5-01 | Breast | breast invasive carcinoma | Female | <65 | I/II | Hormone Therapy | tamoxiphen | SD | |
| TAOK3 | SNV | Missense_Mutation | novel | c.1310N>A | p.Thr437Lys | p.T437K | Q9H2K8 | protein_coding | deleterious(0) | probably_damaging(0.962) | TCGA-LP-A4AW-01 | Cervix | cervical & endocervical cancer | Female | <65 | I/II | Unknown | Unknown | SD |
| TAOK3 | SNV | Missense_Mutation | c.564G>T | p.Glu188Asp | p.E188D | Q9H2K8 | protein_coding | deleterious(0) | probably_damaging(0.966) | TCGA-AA-3492-01 | Colorectum | colon adenocarcinoma | Female | >=65 | I/II | Unknown | Unknown | SD | |
| TAOK3 | SNV | Missense_Mutation | c.989N>G | p.Asp330Gly | p.D330G | Q9H2K8 | protein_coding | deleterious(0.03) | benign(0.027) | TCGA-AA-3977-01 | Colorectum | colon adenocarcinoma | Male | >=65 | I/II | Unknown | Unknown | SD |
| Page: 1 2 3 4 5 6 7 8 9 |
Top |
Related drugs of malignant transformation related genes |
| Identification of chemicals and drugs interact with genes involved in malignant transfromation |
| (DGIdb 4.0) |
| Entrez ID | Symbol | Category | Interaction Types | Drug Claim Name | Drug Name | PMIDs |
| 51347 | TAOK3 | DNA REPAIR, SERINE THREONINE KINASE, KINASE, DRUGGABLE GENOME, ENZYME | inhibitor | 249565794 | ||
| 51347 | TAOK3 | DNA REPAIR, SERINE THREONINE KINASE, KINASE, DRUGGABLE GENOME, ENZYME | morphine | MORPHINE | ||
| 51347 | TAOK3 | DNA REPAIR, SERINE THREONINE KINASE, KINASE, DRUGGABLE GENOME, ENZYME | opioids | 30031856 | ||
| 51347 | TAOK3 | DNA REPAIR, SERINE THREONINE KINASE, KINASE, DRUGGABLE GENOME, ENZYME | inhibitor | 249565898 |
| Page: 1 |

Copyright 2023-Present -The University of Texas Health Science Center at Houston |