
|
|||||
|
 | |
| |
| |
| |
| |
| |
|
Gene: TANK |
Gene summary for TANK |
| Gene information | Species | Human | Gene symbol | TANK | Gene ID | 10010 |
| Gene name | TRAF family member associated NFKB activator | |
| Gene Alias | I-TRAF | |
| Cytomap | 2q24.2 | |
| Gene Type | protein-coding | GO ID | GO:0006464 | UniProtAcc | B2R7S3 |
Top |
Malignant transformation analysis |
| Identification of the aberrant gene expression in precancerous and cancerous lesions by comparing the gene expression of stem-like cells in diseased tissues with normal stem cells |
| Entrez ID | Symbol | Replicates | Species | Organ | Tissue | Adj P-value | Log2FC | Malignancy |
| 10010 | TANK | HTA11_3410_2000001011 | Human | Colorectum | AD | 5.70e-15 | -5.95e-01 | 0.0155 |
| 10010 | TANK | HTA11_2487_2000001011 | Human | Colorectum | SER | 6.20e-03 | -4.80e-01 | -0.1808 |
| 10010 | TANK | HTA11_3361_2000001011 | Human | Colorectum | AD | 2.93e-04 | -5.56e-01 | -0.1207 |
| 10010 | TANK | HTA11_83_2000001011 | Human | Colorectum | SER | 2.17e-02 | -5.08e-01 | -0.1526 |
| 10010 | TANK | HTA11_696_2000001011 | Human | Colorectum | AD | 8.29e-11 | -4.66e-01 | -0.1464 |
| 10010 | TANK | HTA11_866_2000001011 | Human | Colorectum | AD | 4.37e-08 | -4.27e-01 | -0.1001 |
| 10010 | TANK | HTA11_5212_2000001011 | Human | Colorectum | AD | 3.41e-02 | -6.13e-01 | -0.2061 |
| 10010 | TANK | HTA11_866_3004761011 | Human | Colorectum | AD | 1.32e-07 | -4.90e-01 | 0.096 |
| 10010 | TANK | HTA11_10711_2000001011 | Human | Colorectum | AD | 4.10e-05 | -5.49e-01 | 0.0338 |
| 10010 | TANK | HTA11_7696_3000711011 | Human | Colorectum | AD | 9.50e-21 | -5.80e-01 | 0.0674 |
| 10010 | TANK | HTA11_99999970781_79442 | Human | Colorectum | MSS | 3.23e-07 | -3.53e-01 | 0.294 |
| 10010 | TANK | HTA11_99999971662_82457 | Human | Colorectum | MSS | 1.45e-10 | -4.44e-01 | 0.3859 |
| 10010 | TANK | HTA11_99999973899_84307 | Human | Colorectum | MSS | 1.25e-02 | -5.43e-01 | 0.2585 |
| 10010 | TANK | HTA11_99999974143_84620 | Human | Colorectum | MSS | 2.01e-15 | -5.11e-01 | 0.3005 |
| 10010 | TANK | F007 | Human | Colorectum | FAP | 7.98e-06 | -5.25e-01 | 0.1176 |
| 10010 | TANK | A001-C-207 | Human | Colorectum | FAP | 1.54e-03 | -3.45e-01 | 0.1278 |
| 10010 | TANK | A015-C-203 | Human | Colorectum | FAP | 1.83e-33 | -5.16e-01 | -0.1294 |
| 10010 | TANK | A015-C-204 | Human | Colorectum | FAP | 1.72e-07 | -3.55e-01 | -0.0228 |
| 10010 | TANK | A014-C-040 | Human | Colorectum | FAP | 6.43e-05 | -5.76e-01 | -0.1184 |
| 10010 | TANK | A002-C-201 | Human | Colorectum | FAP | 4.25e-15 | -4.63e-01 | 0.0324 |
| Page: 1 2 3 4 5 6 7 8 9 |
| Tissue | Expression Dynamics | Abbreviation |
| Colorectum (GSE201348) |  | FAP: Familial adenomatous polyposis |
| CRC: Colorectal cancer | ||
| Colorectum (HTA11) |  | AD: Adenomas |
| SER: Sessile serrated lesions | ||
| MSI-H: Microsatellite-high colorectal cancer | ||
| MSS: Microsatellite stable colorectal cancer | ||
| Esophagus | 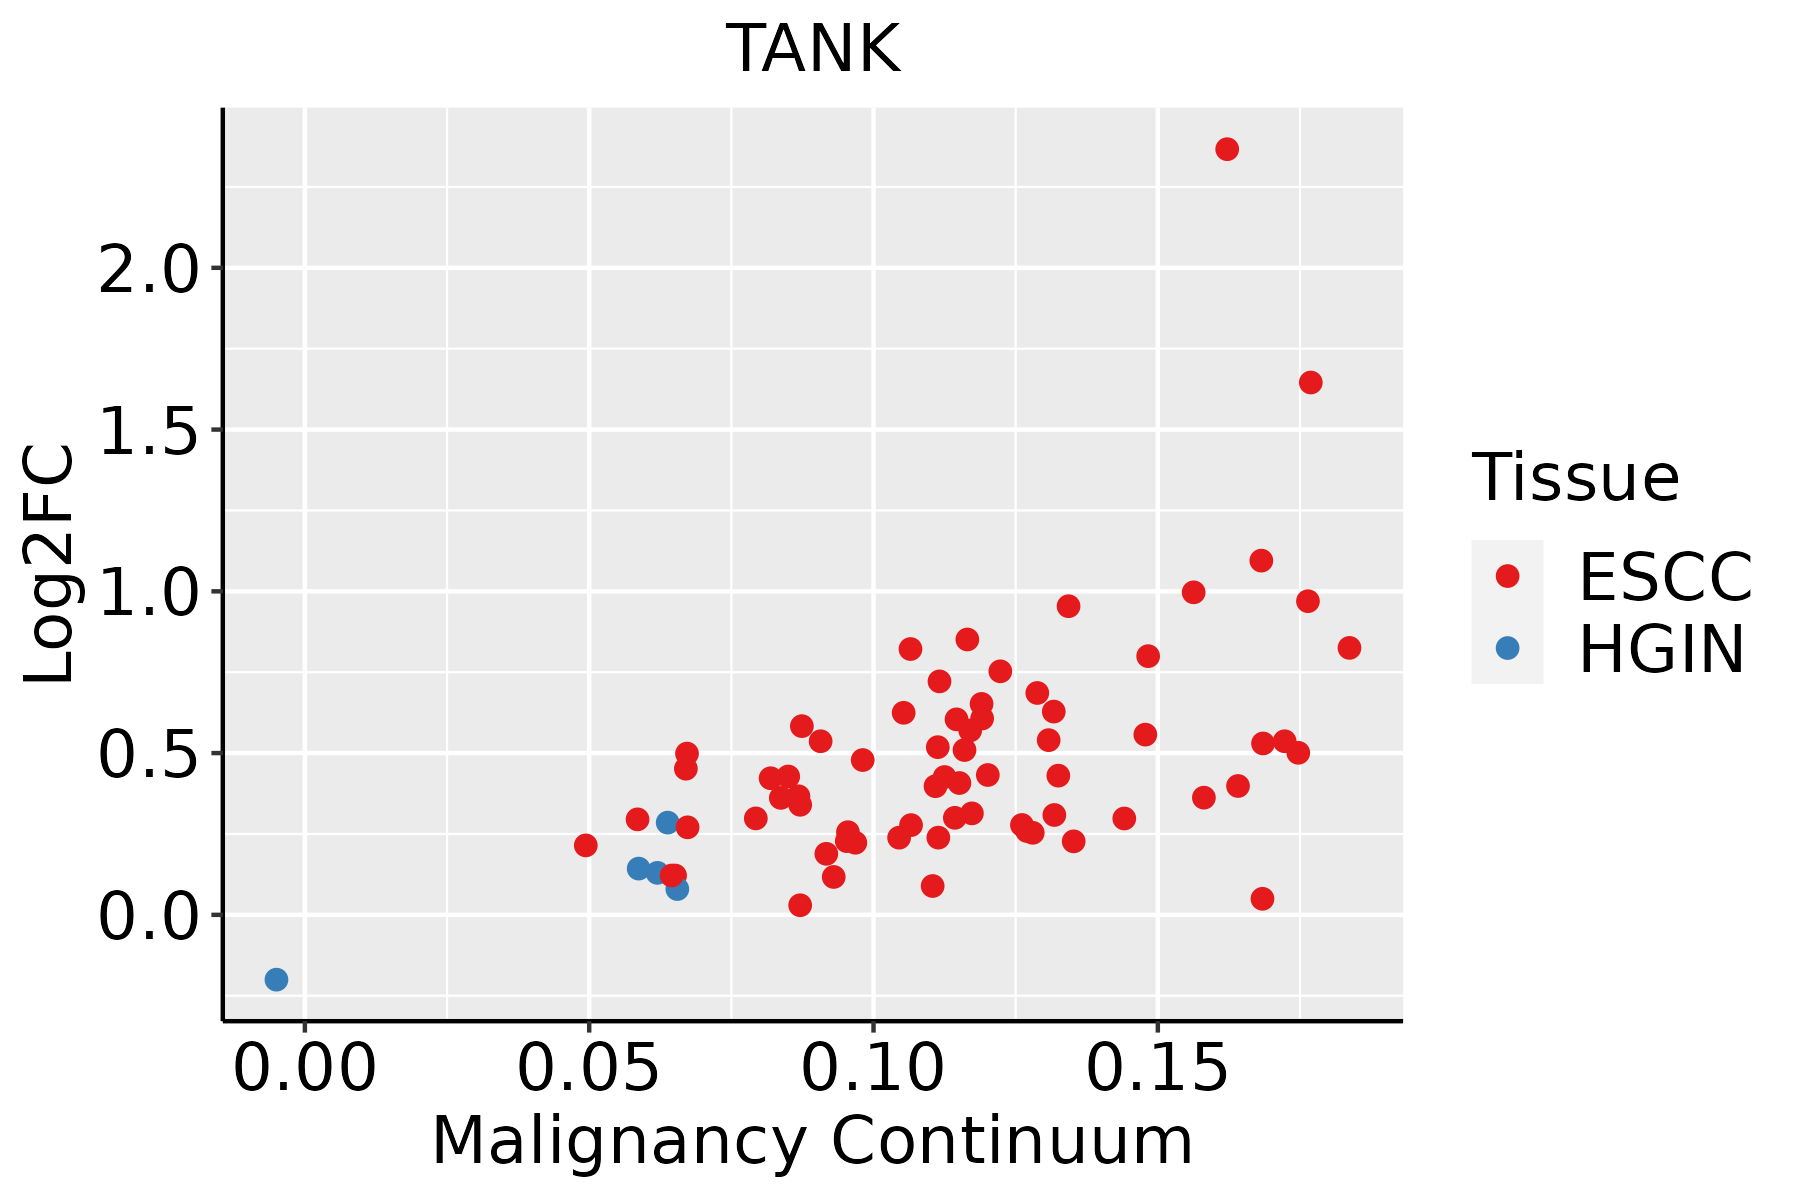 | ESCC: Esophageal squamous cell carcinoma |
| HGIN: High-grade intraepithelial neoplasias | ||
| LGIN: Low-grade intraepithelial neoplasias | ||
| Liver | 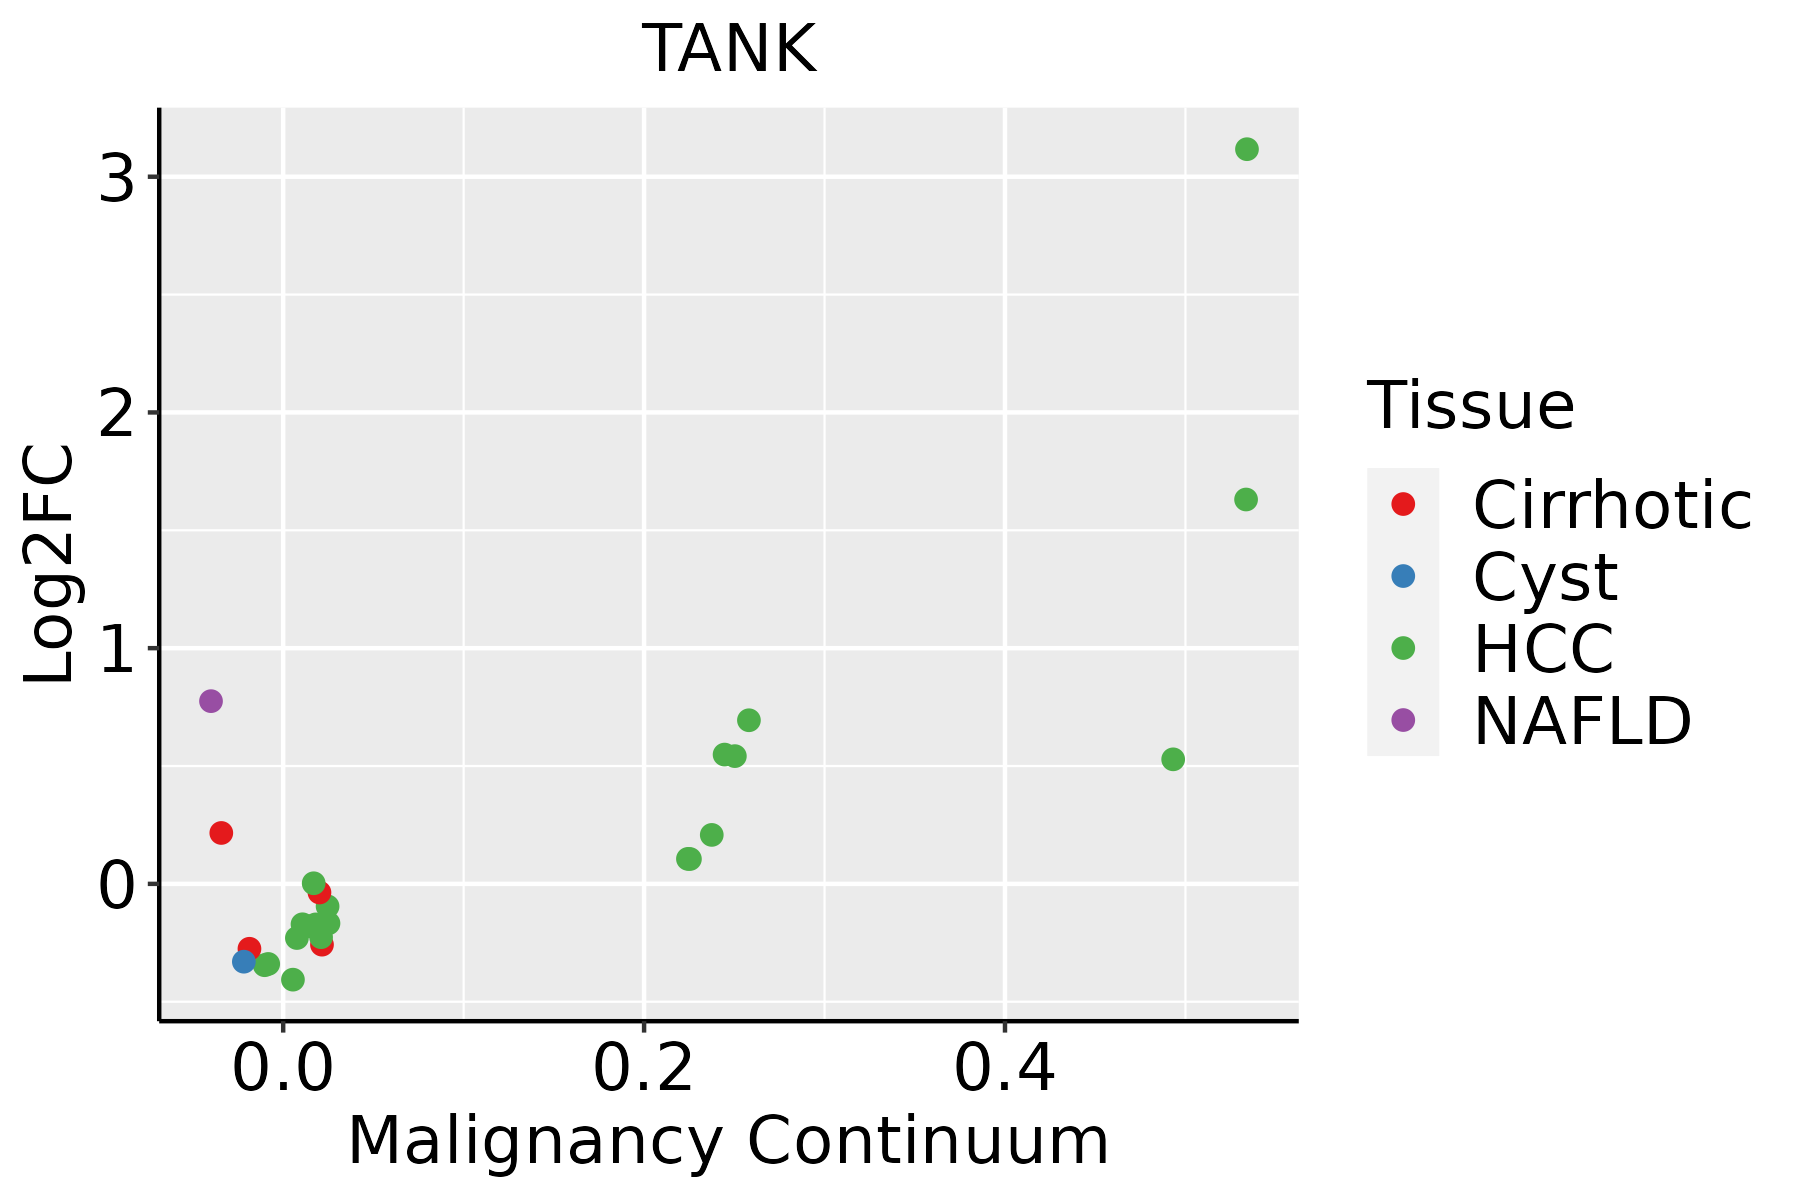 | HCC: Hepatocellular carcinoma |
| NAFLD: Non-alcoholic fatty liver disease | ||
| Lung | 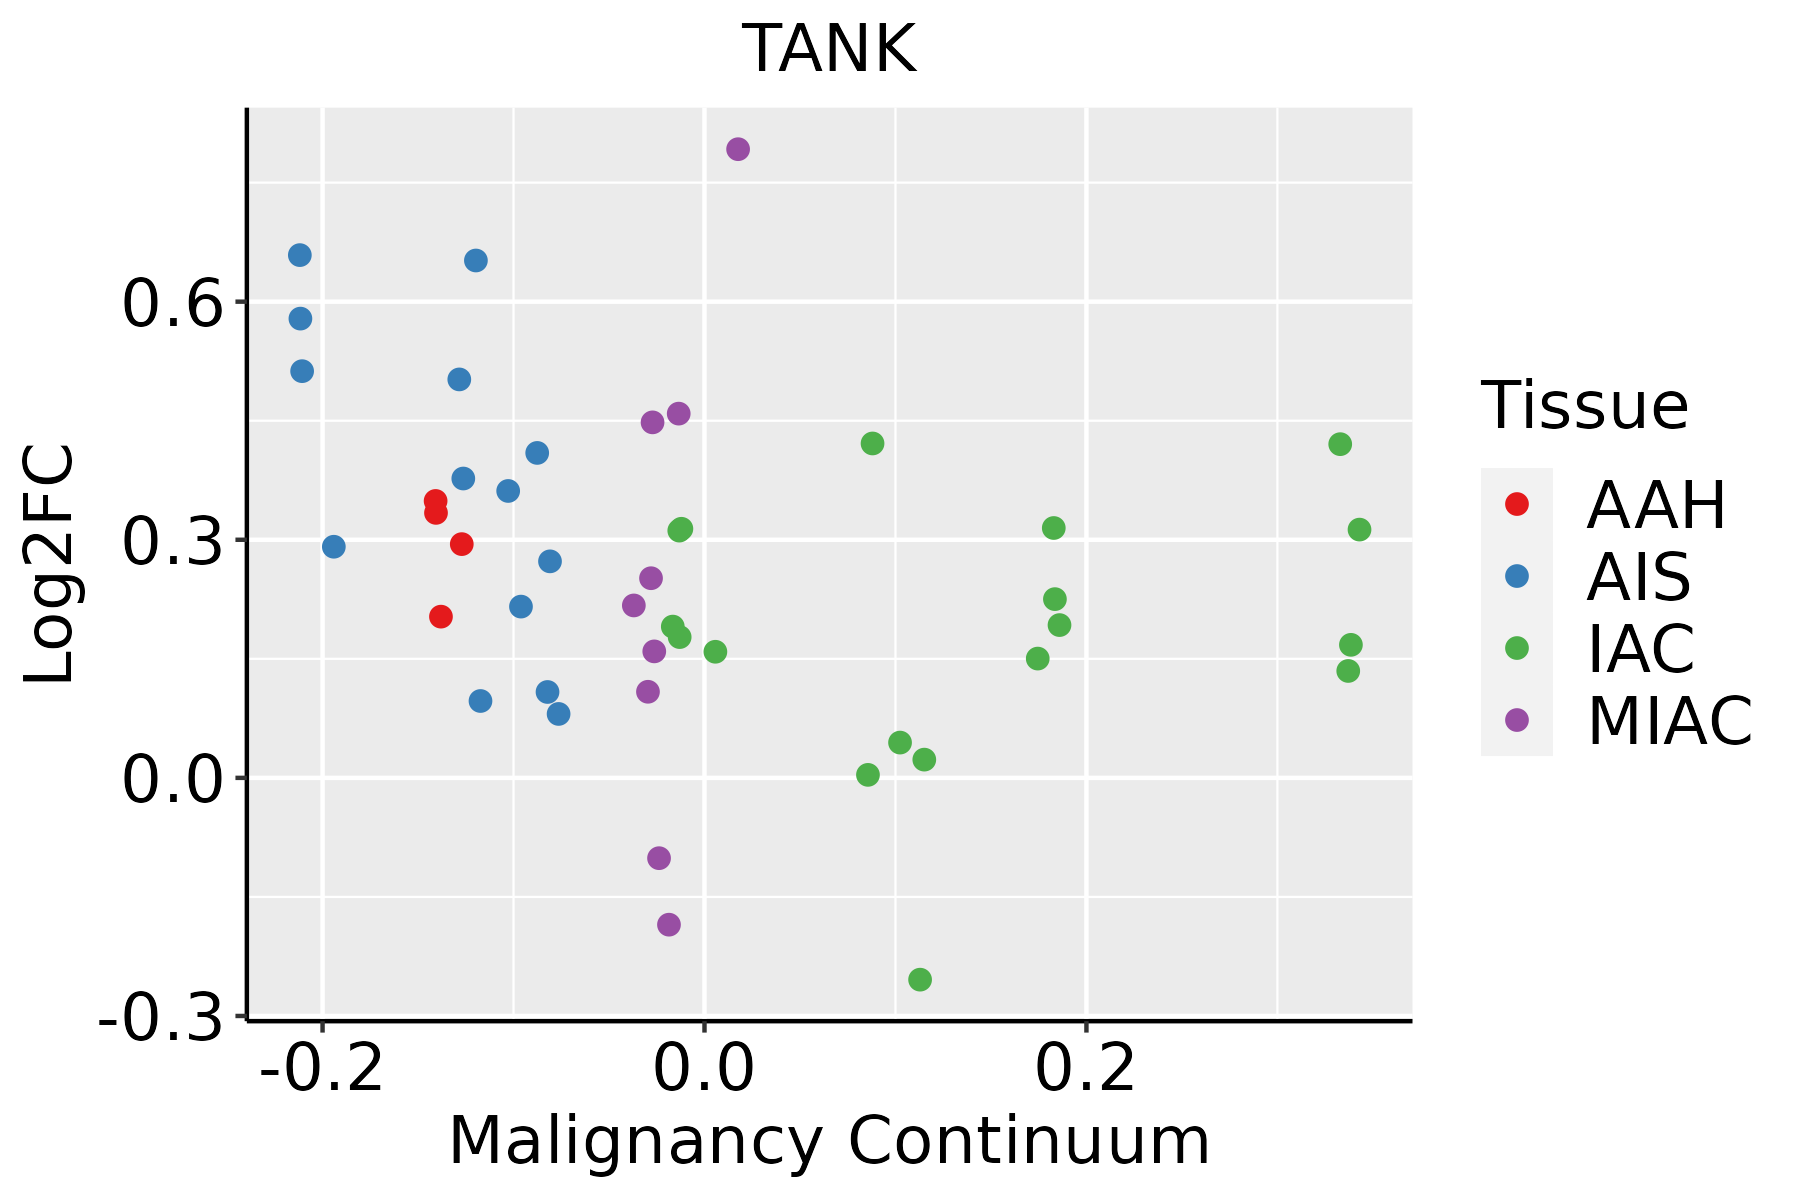 | AAH: Atypical adenomatous hyperplasia |
| AIS: Adenocarcinoma in situ | ||
| IAC: Invasive lung adenocarcinoma | ||
| MIA: Minimally invasive adenocarcinoma | ||
| Oral Cavity | 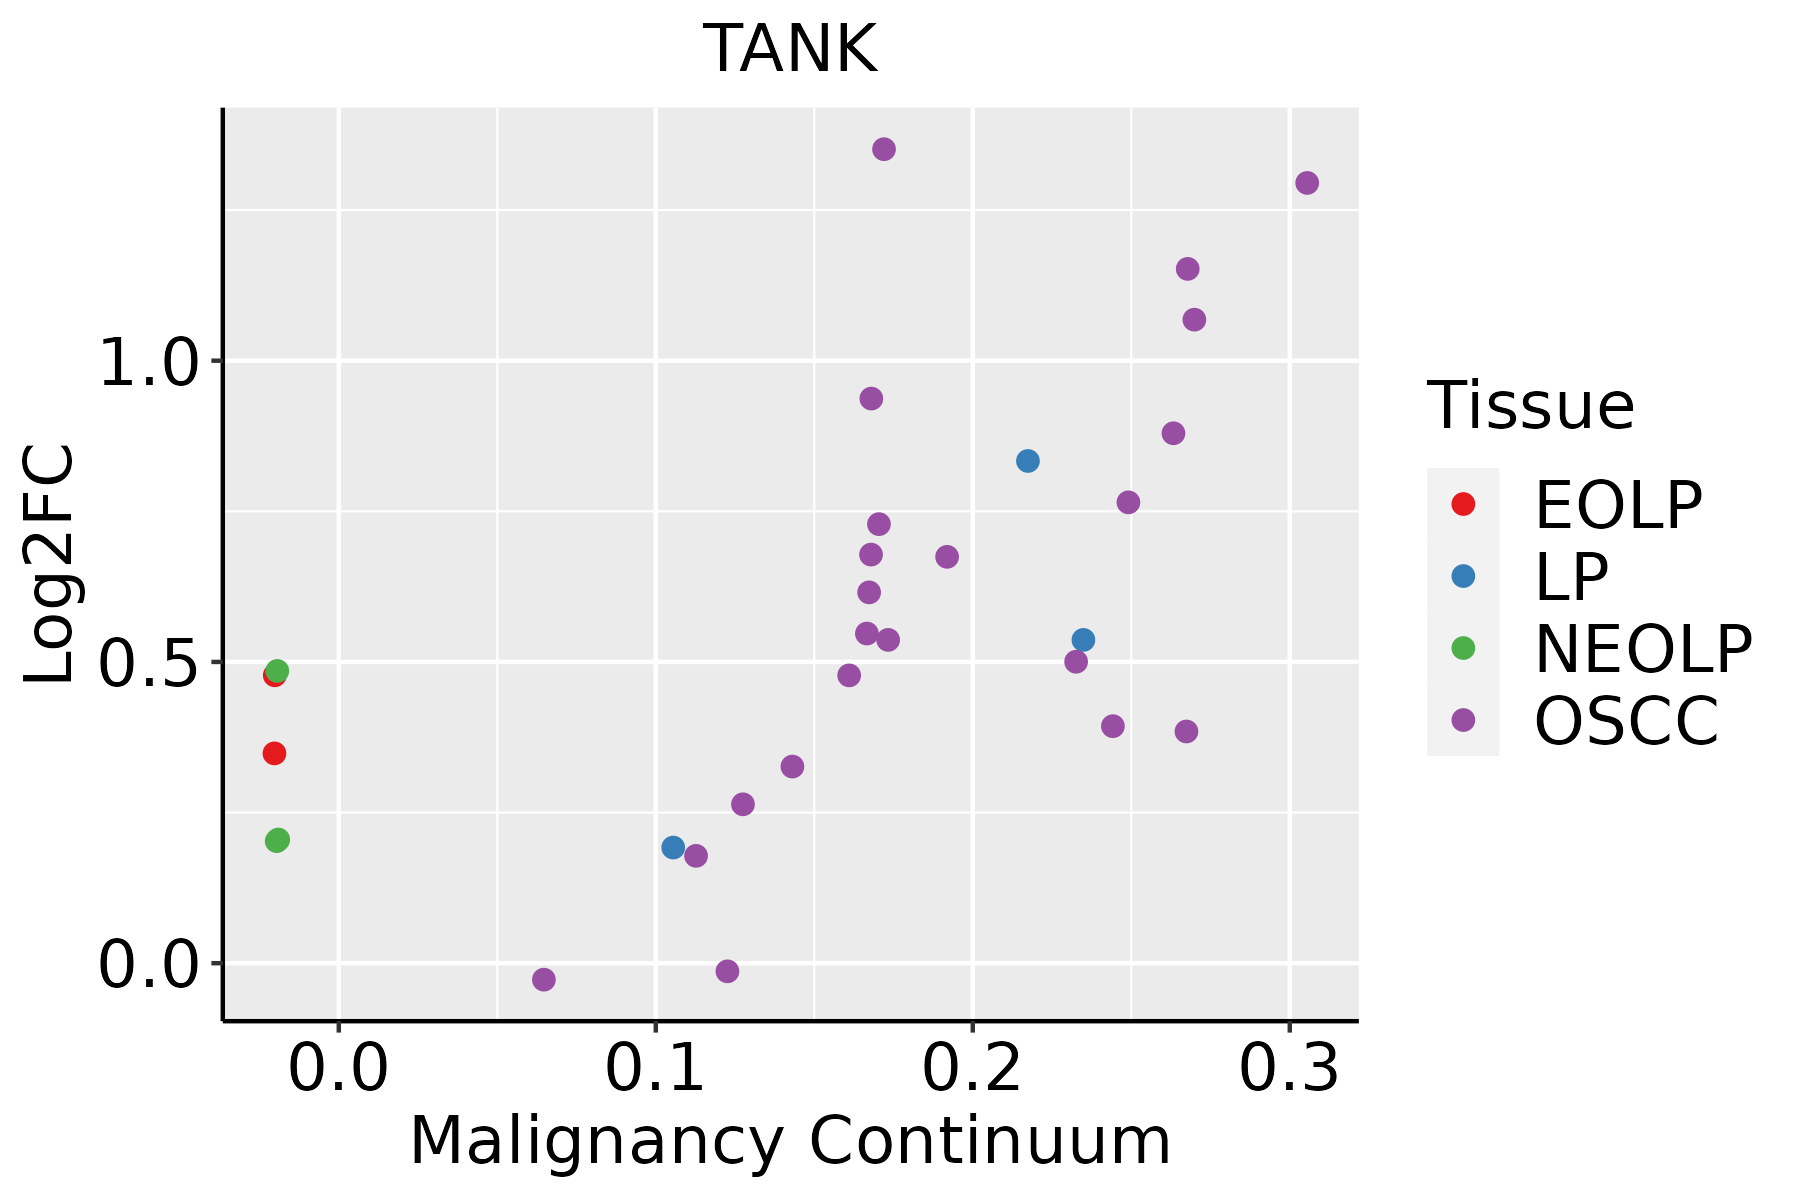 | EOLP: Erosive Oral lichen planus |
| LP: leukoplakia | ||
| NEOLP: Non-erosive oral lichen planus | ||
| OSCC: Oral squamous cell carcinoma | ||
| Skin | 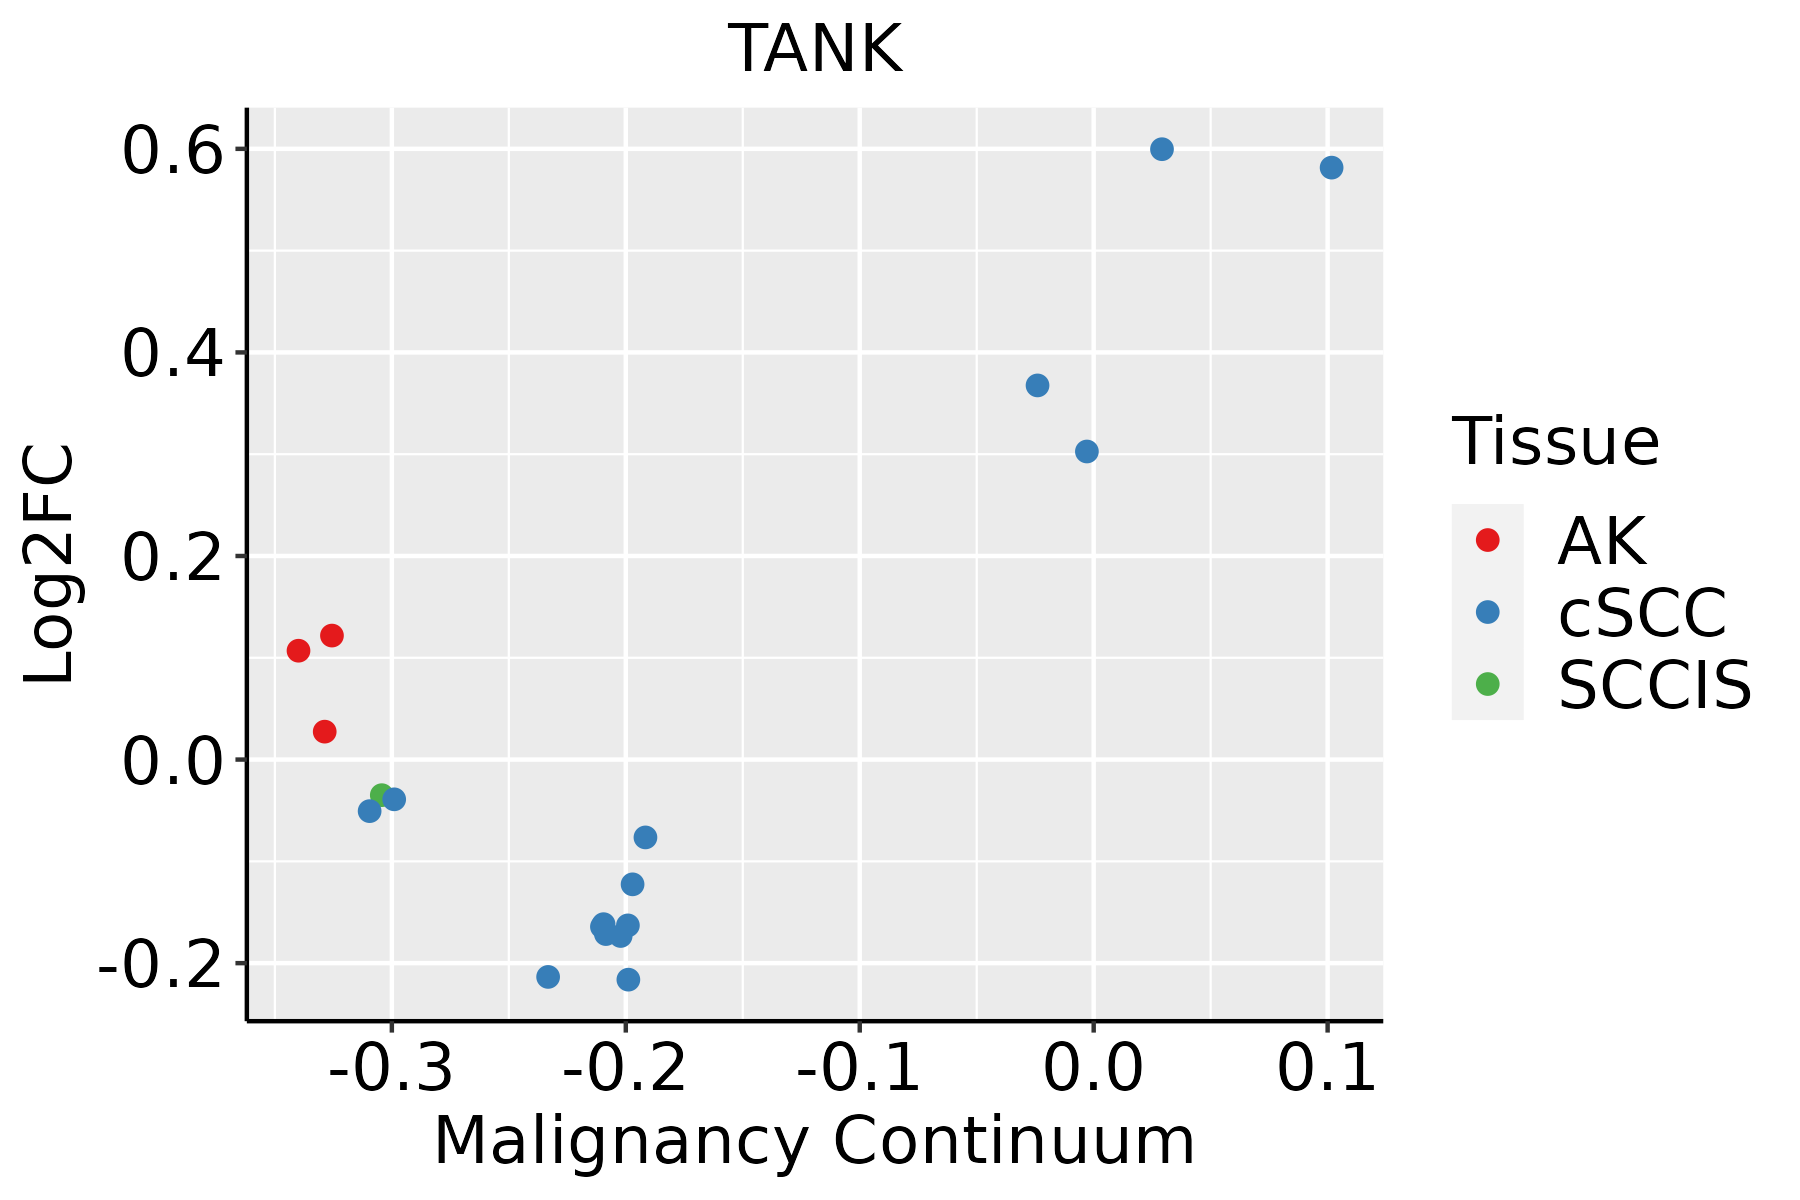 | AK: Actinic keratosis |
| cSCC: Cutaneous squamous cell carcinoma | ||
| SCCIS:squamous cell carcinoma in situ | ||
| Thyroid |  | ATC: Anaplastic thyroid cancer |
| HT: Hashimoto's thyroiditis | ||
| PTC: Papillary thyroid cancer |
| ∗log2FC in expression of this searched gene in stem-like cells from each diseased tissue sample relative to stem-like cells in normal samples in each tissue plotted against the malignancy continuum. Samples are colored based on if they are from different disease stage. |
Top |
Malignant transformation related pathway analysis |
| Find out the enriched GO biological processes and KEGG pathways involved in transition from healthy to precancer to cancer |
| Tissue | Disease Stage | Enriched GO biological Processes |
| Colorectum | AD |  |
| Colorectum | SER |  |
| Colorectum | MSS |  |
| Colorectum | MSI-H |  |
| Colorectum | FAP |  |
| ∗Top 15 enriched GO BP terms are showed in the bar plot of each disease state in each tissue. Each row represents a significant GO biological process which is colored according to the -log10(p.adjust). |
| Page: 1 2 3 4 5 6 7 8 9 |
| GO ID | Tissue | Disease Stage | Description | Gene Ratio | Bg Ratio | pvalue | p.adjust | Count |
| GO:0045862 | Colorectum | AD | positive regulation of proteolysis | 129/3918 | 372/18723 | 4.04e-10 | 3.46e-08 | 129 |
| GO:1903320 | Colorectum | AD | regulation of protein modification by small protein conjugation or removal | 86/3918 | 242/18723 | 9.43e-08 | 4.65e-06 | 86 |
| GO:0052547 | Colorectum | AD | regulation of peptidase activity | 137/3918 | 461/18723 | 4.12e-06 | 1.12e-04 | 137 |
| GO:0010952 | Colorectum | AD | positive regulation of peptidase activity | 68/3918 | 197/18723 | 6.30e-06 | 1.59e-04 | 68 |
| GO:0043122 | Colorectum | AD | regulation of I-kappaB kinase/NF-kappaB signaling | 76/3918 | 249/18723 | 2.17e-04 | 2.85e-03 | 76 |
| GO:0007249 | Colorectum | AD | I-kappaB kinase/NF-kappaB signaling | 82/3918 | 281/18723 | 6.09e-04 | 6.40e-03 | 82 |
| GO:00458621 | Colorectum | SER | positive regulation of proteolysis | 106/2897 | 372/18723 | 8.40e-11 | 1.20e-08 | 106 |
| GO:19033201 | Colorectum | SER | regulation of protein modification by small protein conjugation or removal | 70/2897 | 242/18723 | 6.84e-08 | 4.42e-06 | 70 |
| GO:00525471 | Colorectum | SER | regulation of peptidase activity | 114/2897 | 461/18723 | 1.18e-07 | 7.17e-06 | 114 |
| GO:00109521 | Colorectum | SER | positive regulation of peptidase activity | 55/2897 | 197/18723 | 5.44e-06 | 2.00e-04 | 55 |
| GO:1903322 | Colorectum | SER | positive regulation of protein modification by small protein conjugation or removal | 34/2897 | 138/18723 | 3.30e-03 | 2.83e-02 | 34 |
| GO:00458622 | Colorectum | MSS | positive regulation of proteolysis | 119/3467 | 372/18723 | 2.14e-10 | 2.09e-08 | 119 |
| GO:19033202 | Colorectum | MSS | regulation of protein modification by small protein conjugation or removal | 82/3467 | 242/18723 | 7.49e-09 | 4.63e-07 | 82 |
| GO:00525472 | Colorectum | MSS | regulation of peptidase activity | 130/3467 | 461/18723 | 1.81e-07 | 8.13e-06 | 130 |
| GO:00109522 | Colorectum | MSS | positive regulation of peptidase activity | 63/3467 | 197/18723 | 3.65e-06 | 1.06e-04 | 63 |
| GO:00431221 | Colorectum | MSS | regulation of I-kappaB kinase/NF-kappaB signaling | 71/3467 | 249/18723 | 7.12e-05 | 1.21e-03 | 71 |
| GO:00072491 | Colorectum | MSS | I-kappaB kinase/NF-kappaB signaling | 77/3467 | 281/18723 | 1.51e-04 | 2.19e-03 | 77 |
| GO:19033204 | Colorectum | FAP | regulation of protein modification by small protein conjugation or removal | 61/2622 | 242/18723 | 2.36e-06 | 9.21e-05 | 61 |
| GO:00458624 | Colorectum | FAP | positive regulation of proteolysis | 81/2622 | 372/18723 | 2.64e-05 | 6.08e-04 | 81 |
| GO:00431222 | Colorectum | FAP | regulation of I-kappaB kinase/NF-kappaB signaling | 56/2622 | 249/18723 | 1.82e-04 | 2.69e-03 | 56 |
| Page: 1 2 3 4 5 6 7 8 9 10 11 12 13 |
| Pathway ID | Tissue | Disease Stage | Description | Gene Ratio | Bg Ratio | pvalue | p.adjust | qvalue | Count |
| hsa05014 | Colorectum | AD | Amyotrophic lateral sclerosis | 164/2092 | 364/8465 | 4.28e-18 | 1.27e-16 | 8.09e-17 | 164 |
| hsa05022 | Colorectum | AD | Pathways of neurodegeneration - multiple diseases | 201/2092 | 476/8465 | 4.54e-18 | 1.27e-16 | 8.09e-17 | 201 |
| hsa05417 | Colorectum | AD | Lipid and atherosclerosis | 73/2092 | 215/8465 | 1.31e-03 | 8.27e-03 | 5.27e-03 | 73 |
| hsa04140 | Colorectum | AD | Autophagy - animal | 49/2092 | 141/8465 | 4.58e-03 | 2.20e-02 | 1.40e-02 | 49 |
| hsa050141 | Colorectum | AD | Amyotrophic lateral sclerosis | 164/2092 | 364/8465 | 4.28e-18 | 1.27e-16 | 8.09e-17 | 164 |
| hsa050221 | Colorectum | AD | Pathways of neurodegeneration - multiple diseases | 201/2092 | 476/8465 | 4.54e-18 | 1.27e-16 | 8.09e-17 | 201 |
| hsa054171 | Colorectum | AD | Lipid and atherosclerosis | 73/2092 | 215/8465 | 1.31e-03 | 8.27e-03 | 5.27e-03 | 73 |
| hsa041401 | Colorectum | AD | Autophagy - animal | 49/2092 | 141/8465 | 4.58e-03 | 2.20e-02 | 1.40e-02 | 49 |
| hsa050222 | Colorectum | SER | Pathways of neurodegeneration - multiple diseases | 168/1580 | 476/8465 | 6.23e-19 | 2.07e-17 | 1.50e-17 | 168 |
| hsa050142 | Colorectum | SER | Amyotrophic lateral sclerosis | 138/1580 | 364/8465 | 9.89e-19 | 2.99e-17 | 2.17e-17 | 138 |
| hsa041402 | Colorectum | SER | Autophagy - animal | 39/1580 | 141/8465 | 5.43e-03 | 3.28e-02 | 2.38e-02 | 39 |
| hsa054172 | Colorectum | SER | Lipid and atherosclerosis | 55/1580 | 215/8465 | 6.83e-03 | 3.77e-02 | 2.74e-02 | 55 |
| hsa050223 | Colorectum | SER | Pathways of neurodegeneration - multiple diseases | 168/1580 | 476/8465 | 6.23e-19 | 2.07e-17 | 1.50e-17 | 168 |
| hsa050143 | Colorectum | SER | Amyotrophic lateral sclerosis | 138/1580 | 364/8465 | 9.89e-19 | 2.99e-17 | 2.17e-17 | 138 |
| hsa041403 | Colorectum | SER | Autophagy - animal | 39/1580 | 141/8465 | 5.43e-03 | 3.28e-02 | 2.38e-02 | 39 |
| hsa054173 | Colorectum | SER | Lipid and atherosclerosis | 55/1580 | 215/8465 | 6.83e-03 | 3.77e-02 | 2.74e-02 | 55 |
| hsa050224 | Colorectum | MSS | Pathways of neurodegeneration - multiple diseases | 192/1875 | 476/8465 | 2.79e-20 | 1.04e-18 | 6.36e-19 | 192 |
| hsa050144 | Colorectum | MSS | Amyotrophic lateral sclerosis | 156/1875 | 364/8465 | 1.43e-19 | 4.62e-18 | 2.83e-18 | 156 |
| hsa054174 | Colorectum | MSS | Lipid and atherosclerosis | 70/1875 | 215/8465 | 2.38e-04 | 1.81e-03 | 1.11e-03 | 70 |
| hsa041404 | Colorectum | MSS | Autophagy - animal | 45/1875 | 141/8465 | 4.42e-03 | 1.90e-02 | 1.16e-02 | 45 |
| Page: 1 2 3 4 5 6 |
Top |
Cell-cell communication analysis |
| Identification of potential cell-cell interactions between two cell types and their ligand-receptor pairs for different disease states |
| Ligand | Receptor | LRpair | Pathway | Tissue | Disease Stage |
| Page: 1 |
Top |
Single-cell gene regulatory network inference analysis |
| Find out the significant the regulons (TFs) and the target genes of each regulon across cell types for different disease states |
| TF | Cell Type | Tissue | Disease Stage | Target Gene | RSS | Regulon Activity |
| ∗The dot plots of a searched regulon are shown for all cell subpopulations in each disease state of each tissue based on the regulon specific score inferred using pySCENIC and by calculating the average expression. |
| Page: 1 |
Top |
Somatic mutation of malignant transformation related genes |
| Annotation of somatic variants for genes involved in malignant transformation |
| Hugo Symbol | Variant Class | Variant Classification | dbSNP RS | HGVSc | HGVSp | HGVSp Short | SWISSPROT | BIOTYPE | SIFT | PolyPhen | Tumor Sample Barcode | Tissue | Histology | Sex | Age | Stage | Therapy Types | Drugs | Outcome |
| TANK | SNV | Missense_Mutation | novel | c.726N>G | p.Asp242Glu | p.D242E | Q92844 | protein_coding | tolerated(0.21) | probably_damaging(0.991) | TCGA-A7-A4SE-01 | Breast | breast invasive carcinoma | Female | <65 | I/II | Chemotherapy | adriamycin | CR |
| TANK | SNV | Missense_Mutation | rs762974211 | c.575C>T | p.Ala192Val | p.A192V | Q92844 | protein_coding | tolerated(0.27) | benign(0.001) | TCGA-EW-A1J3-01 | Breast | breast invasive carcinoma | Female | <65 | I/II | Chemotherapy | carboplatin | SD |
| TANK | insertion | Frame_Shift_Ins | novel | c.939_940insACACATACCCAAACAGAAAAAAATATATTGGAATGTGCTGTGG | p.Leu314ThrfsTer26 | p.L314Tfs*26 | Q92844 | protein_coding | TCGA-BH-A0HF-01 | Breast | breast invasive carcinoma | Female | >=65 | I/II | Hormone Therapy | arimidex | SD | ||
| TANK | deletion | Frame_Shift_Del | novel | c.1056delT | p.Ser354HisfsTer30 | p.S354Hfs*30 | Q92844 | protein_coding | TCGA-D8-A27V-01 | Breast | breast invasive carcinoma | Female | <65 | I/II | Hormone Therapy | tamoxiphen | SD | ||
| TANK | SNV | Missense_Mutation | novel | c.350N>G | p.Ser117Cys | p.S117C | Q92844 | protein_coding | tolerated(0.05) | possibly_damaging(0.781) | TCGA-C5-A2LZ-01 | Cervix | cervical & endocervical cancer | Female | >=65 | III/IV | Unknown | Unknown | PD |
| TANK | SNV | Missense_Mutation | c.967C>G | p.Leu323Val | p.L323V | Q92844 | protein_coding | tolerated(0.58) | benign(0) | TCGA-EA-A43B-01 | Cervix | cervical & endocervical cancer | Female | <65 | I/II | Chemotherapy | cisplatin | CR | |
| TANK | SNV | Missense_Mutation | c.238N>C | p.Glu80Gln | p.E80Q | Q92844 | protein_coding | deleterious(0.04) | possibly_damaging(0.71) | TCGA-EK-A2PL-01 | Cervix | cervical & endocervical cancer | Female | <65 | III/IV | Unknown | Unknown | SD | |
| TANK | SNV | Missense_Mutation | novel | c.741T>A | p.His247Gln | p.H247Q | Q92844 | protein_coding | tolerated(0.72) | possibly_damaging(0.475) | TCGA-AA-3521-01 | Colorectum | colon adenocarcinoma | Male | >=65 | I/II | Unknown | Unknown | SD |
| TANK | SNV | Missense_Mutation | c.37T>C | p.Tyr13His | p.Y13H | Q92844 | protein_coding | deleterious(0) | probably_damaging(0.997) | TCGA-AA-3710-01 | Colorectum | colon adenocarcinoma | Female | >=65 | I/II | Unknown | Unknown | SD | |
| TANK | SNV | Missense_Mutation | c.64G>A | p.Asp22Asn | p.D22N | Q92844 | protein_coding | deleterious(0) | probably_damaging(0.998) | TCGA-AA-3833-01 | Colorectum | colon adenocarcinoma | Female | <65 | I/II | Unknown | Unknown | SD |
| Page: 1 2 3 4 5 |
Top |
Related drugs of malignant transformation related genes |
| Identification of chemicals and drugs interact with genes involved in malignant transfromation |
| (DGIdb 4.0) |
| Entrez ID | Symbol | Category | Interaction Types | Drug Claim Name | Drug Name | PMIDs |
| Page: 1 |

Copyright 2023-Present -The University of Texas Health Science Center at Houston |