| Tissue | Expression Dynamics | Abbreviation |
| Cervix | 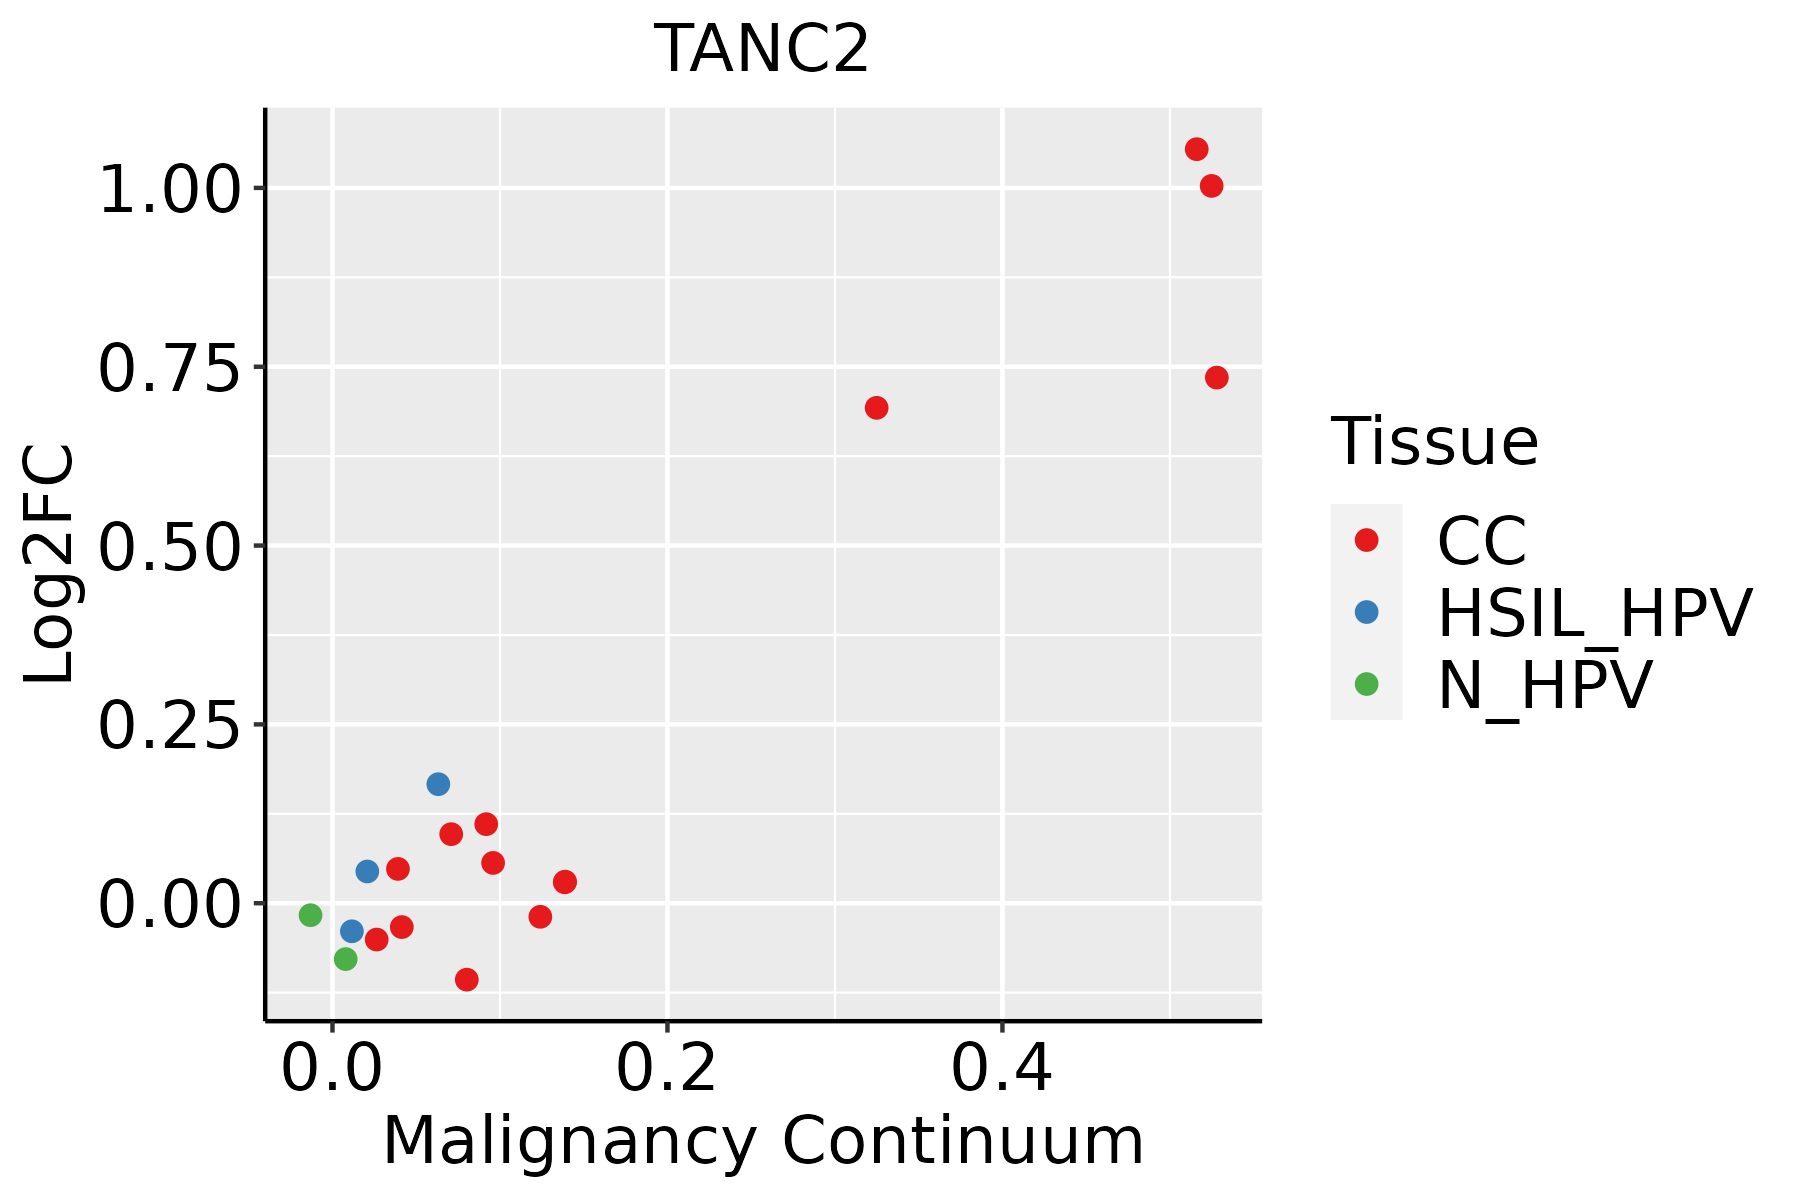 | CC: Cervix cancer |
| HSIL_HPV: HPV-infected high-grade squamous intraepithelial lesions |
| N_HPV: HPV-infected normal cervix |
| Esophagus |  | ESCC: Esophageal squamous cell carcinoma |
| HGIN: High-grade intraepithelial neoplasias |
| LGIN: Low-grade intraepithelial neoplasias |
| Lung | 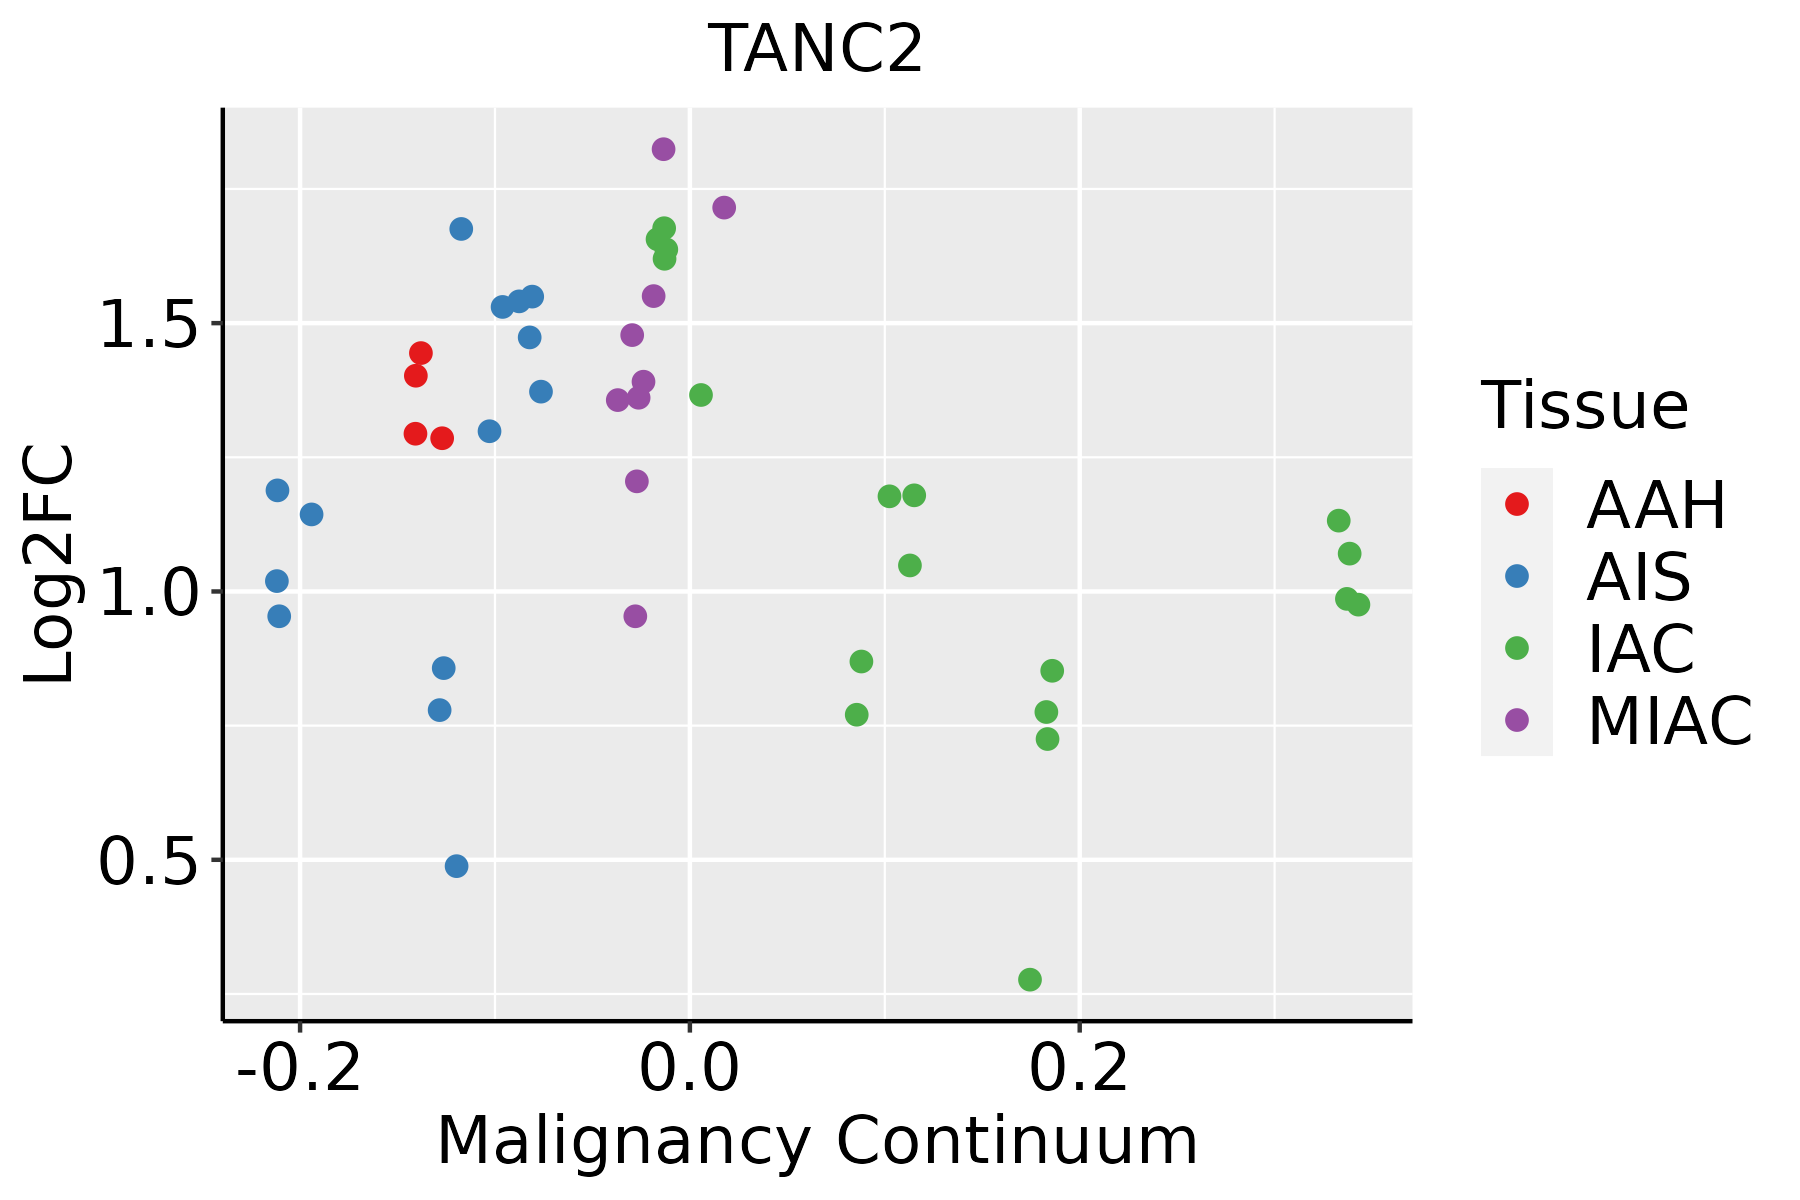 | AAH: Atypical adenomatous hyperplasia |
| AIS: Adenocarcinoma in situ |
| IAC: Invasive lung adenocarcinoma |
| MIA: Minimally invasive adenocarcinoma |
| Oral Cavity | 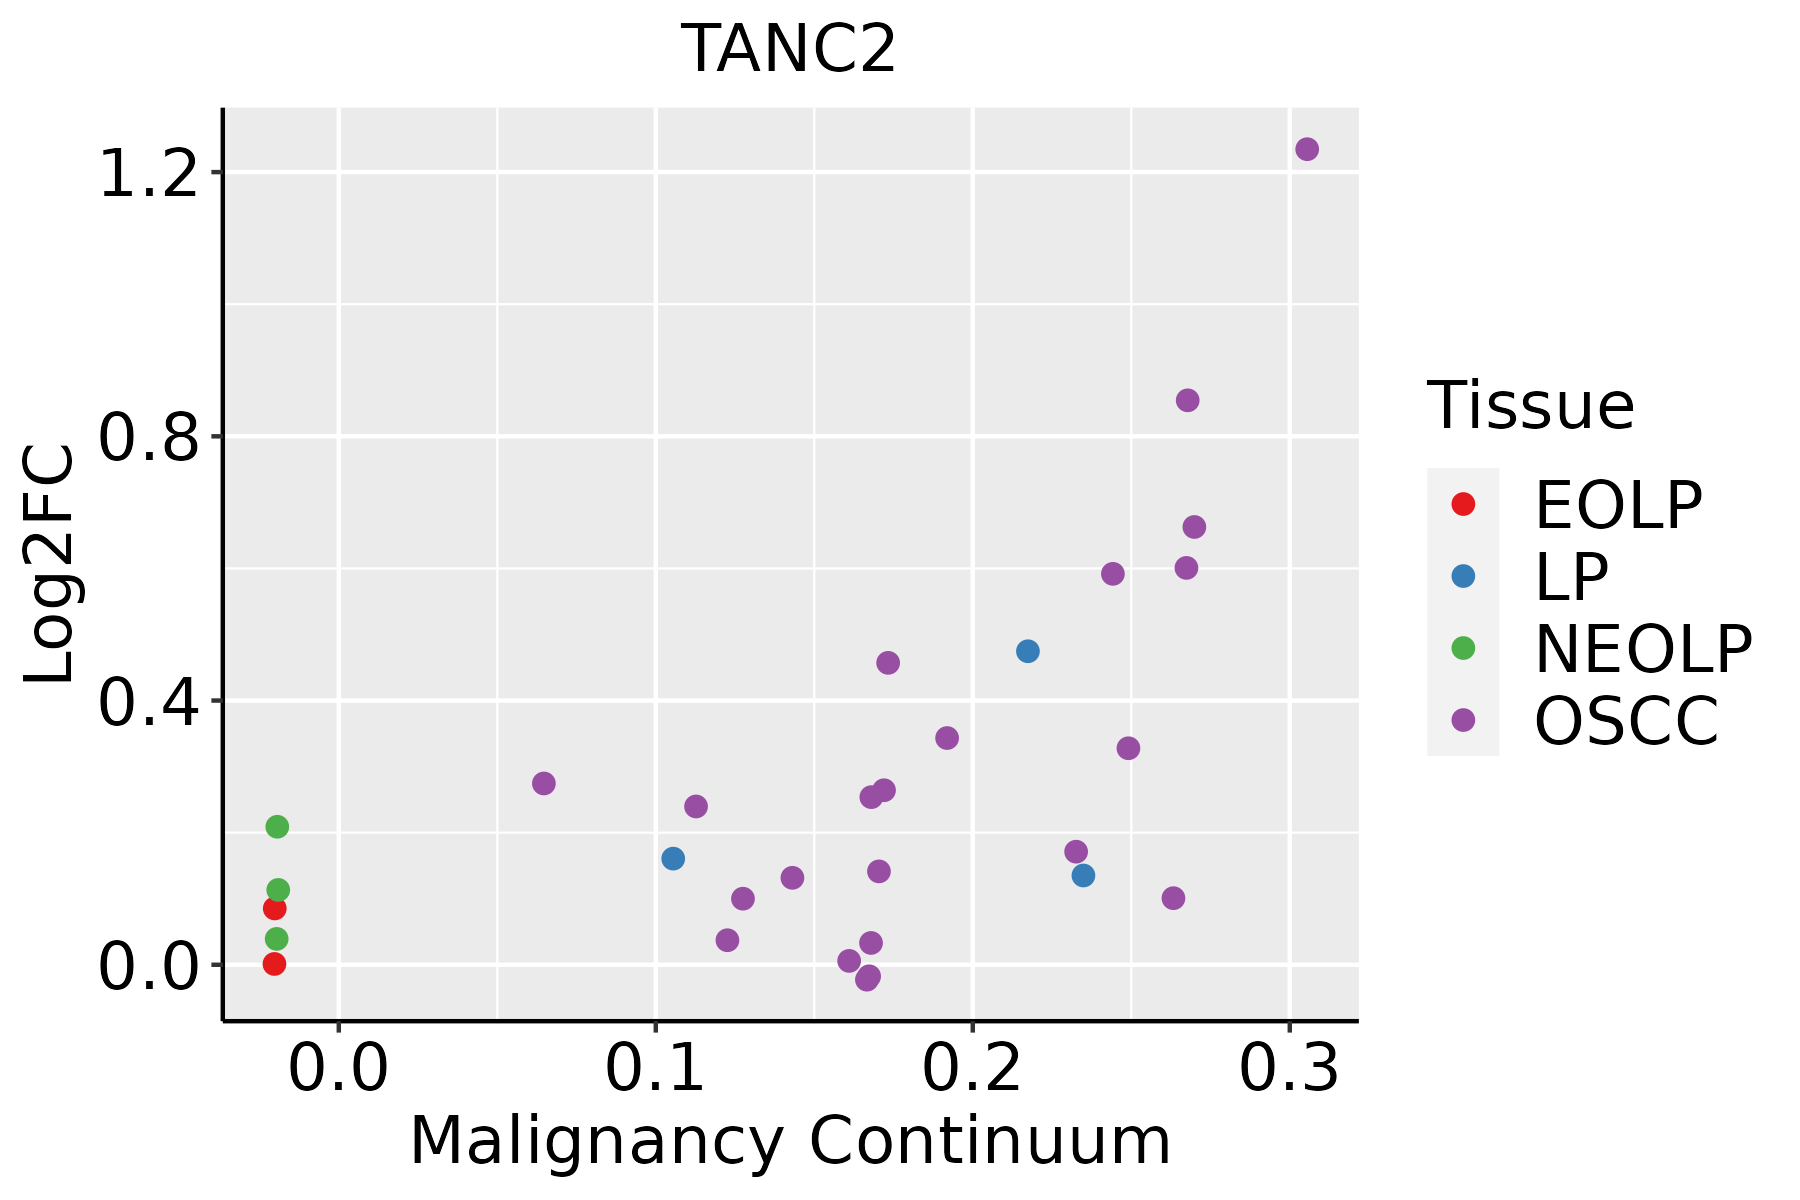 | EOLP: Erosive Oral lichen planus |
| LP: leukoplakia |
| NEOLP: Non-erosive oral lichen planus |
| OSCC: Oral squamous cell carcinoma |
| Prostate | 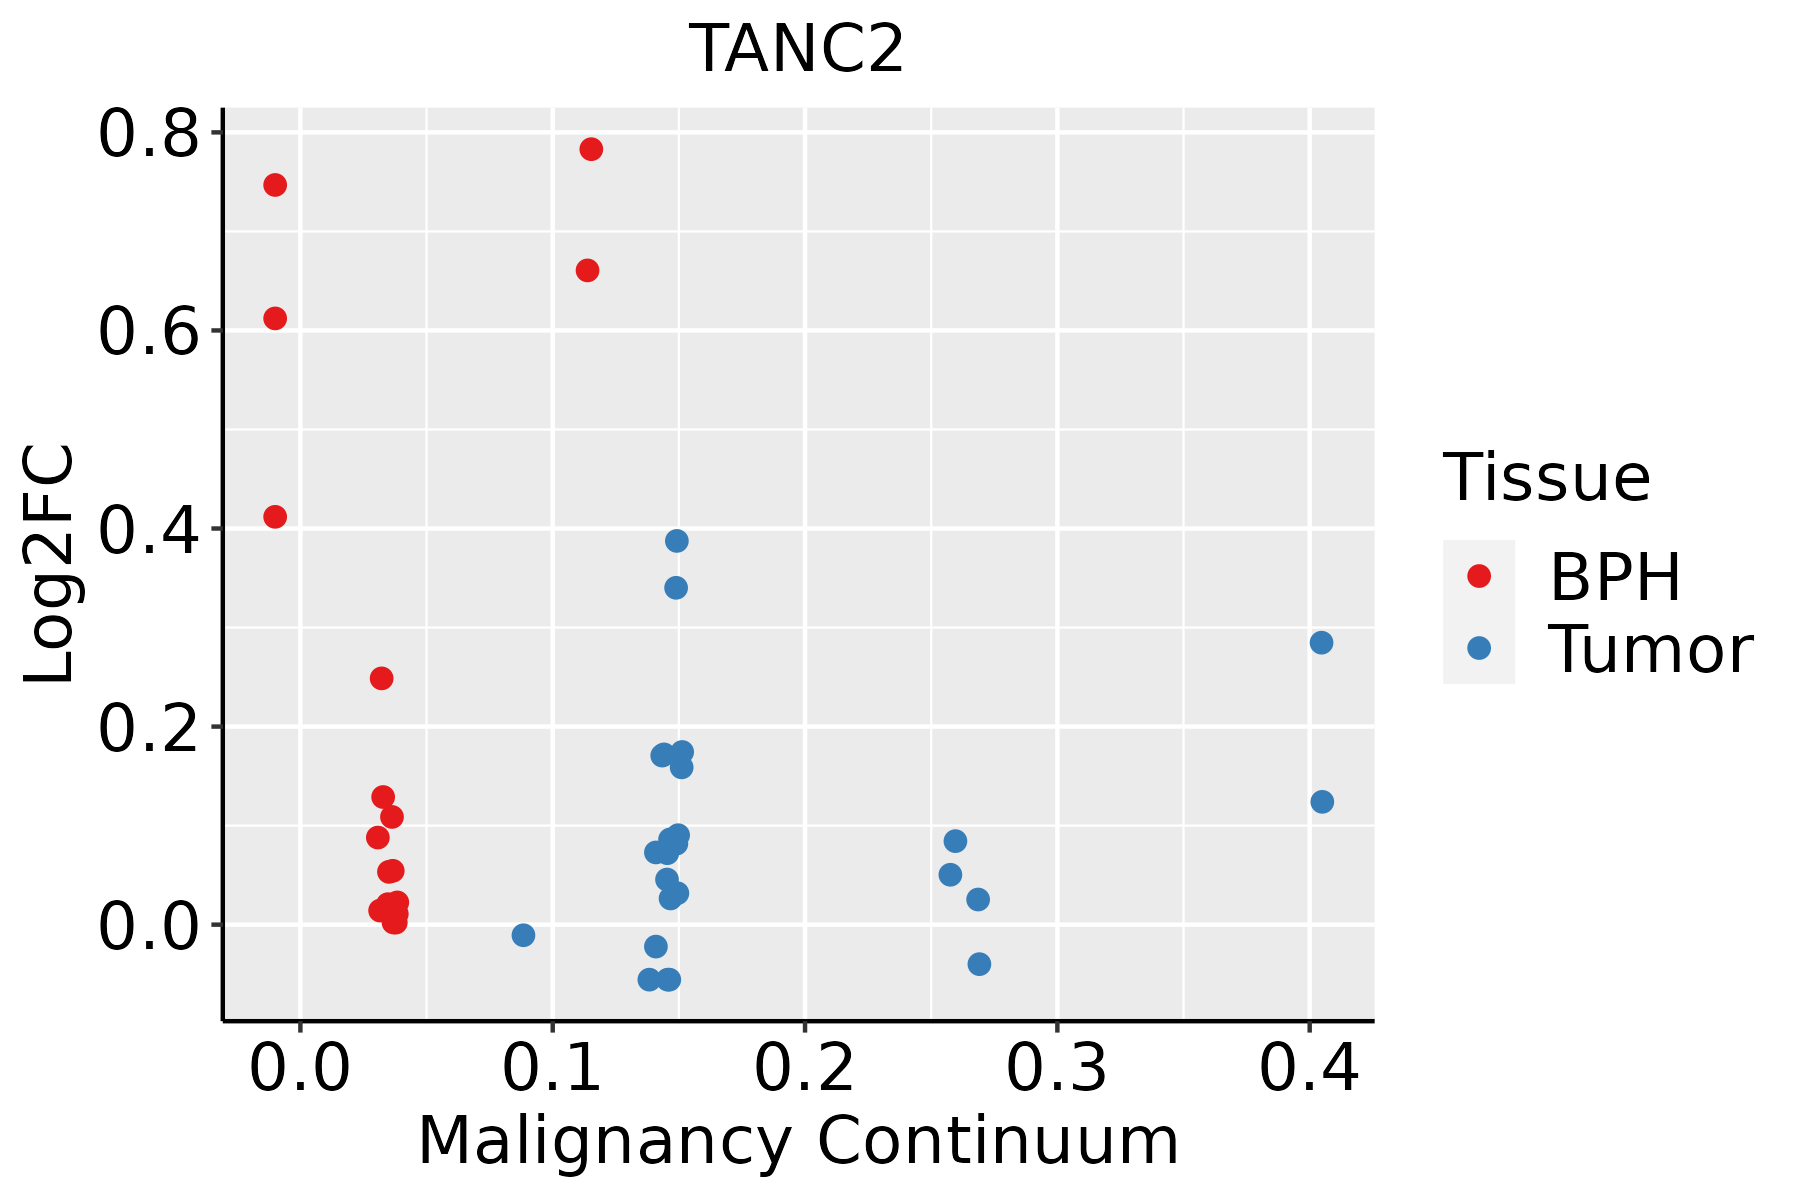 | BPH: Benign Prostatic Hyperplasia |
| Skin | 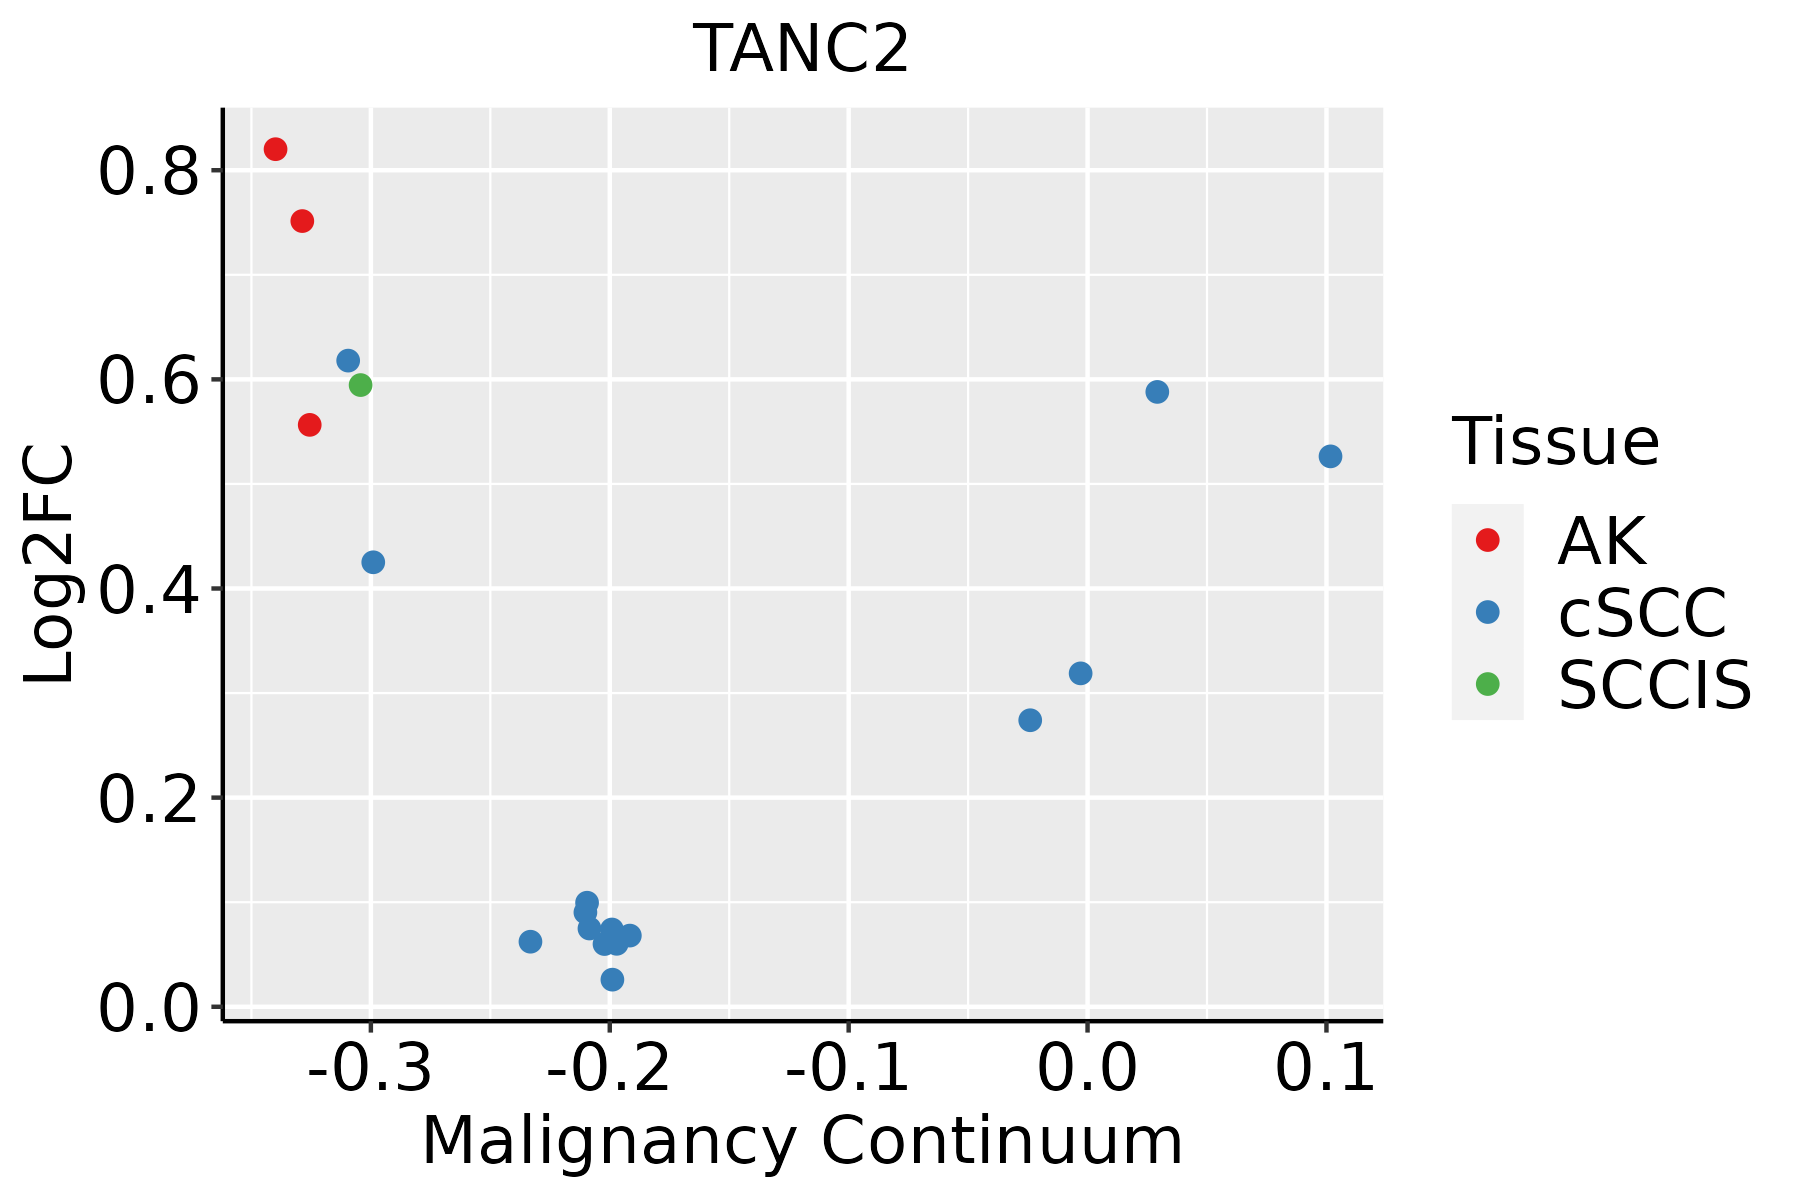 | AK: Actinic keratosis |
| cSCC: Cutaneous squamous cell carcinoma |
| SCCIS:squamous cell carcinoma in situ |
| Thyroid | 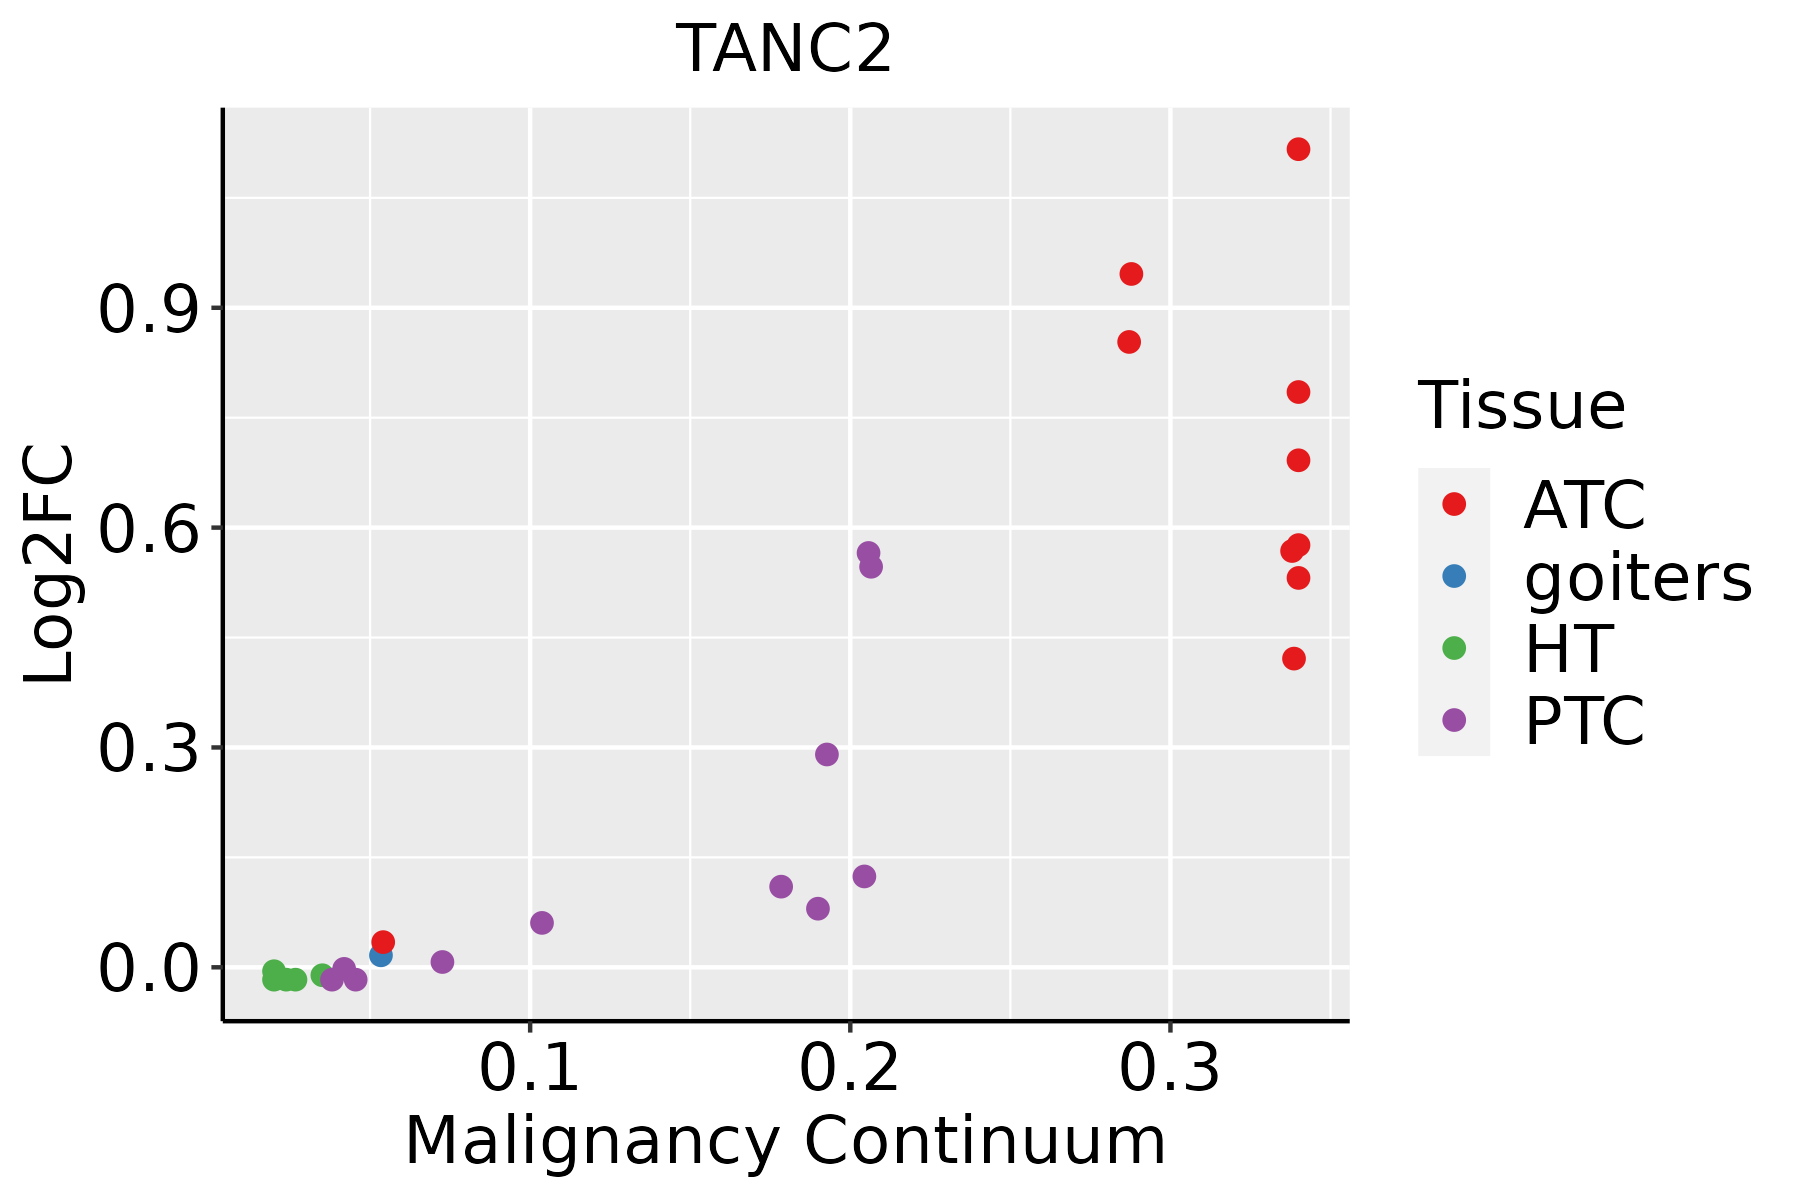 | ATC: Anaplastic thyroid cancer |
| HT: Hashimoto's thyroiditis |
| PTC: Papillary thyroid cancer |
| GO ID | Tissue | Disease Stage | Description | Gene Ratio | Bg Ratio | pvalue | p.adjust | Count |
| GO:00163587 | Cervix | CC | dendrite development | 58/2311 | 243/18723 | 4.52e-07 | 1.76e-05 | 58 |
| GO:00109757 | Cervix | CC | regulation of neuron projection development | 88/2311 | 445/18723 | 4.26e-06 | 1.09e-04 | 88 |
| GO:00609965 | Cervix | CC | dendritic spine development | 28/2311 | 99/18723 | 1.61e-05 | 3.15e-04 | 28 |
| GO:00516567 | Cervix | CC | establishment of organelle localization | 76/2311 | 390/18723 | 3.17e-05 | 5.21e-04 | 76 |
| GO:00017018 | Cervix | CC | in utero embryonic development | 71/2311 | 367/18723 | 7.21e-05 | 1.00e-03 | 71 |
| GO:00609984 | Cervix | CC | regulation of dendritic spine development | 18/2311 | 61/18723 | 2.84e-04 | 3.07e-03 | 18 |
| GO:00307057 | Cervix | CC | cytoskeleton-dependent intracellular transport | 40/2311 | 195/18723 | 7.92e-04 | 6.99e-03 | 40 |
| GO:00488135 | Cervix | CC | dendrite morphogenesis | 30/2311 | 146/18723 | 3.27e-03 | 2.13e-02 | 30 |
| GO:01060277 | Cervix | CC | neuron projection organization | 21/2311 | 93/18723 | 4.10e-03 | 2.54e-02 | 21 |
| GO:00164827 | Cervix | CC | cytosolic transport | 33/2311 | 168/18723 | 4.43e-03 | 2.70e-02 | 33 |
| GO:00610014 | Cervix | CC | regulation of dendritic spine morphogenesis | 12/2311 | 47/18723 | 1.01e-02 | 4.91e-02 | 12 |
| GO:005165617 | Esophagus | ESCC | establishment of organelle localization | 273/8552 | 390/18723 | 9.13e-23 | 1.81e-20 | 273 |
| GO:000170119 | Esophagus | ESCC | in utero embryonic development | 243/8552 | 367/18723 | 1.00e-15 | 6.86e-14 | 243 |
| GO:001648210 | Esophagus | ESCC | cytosolic transport | 124/8552 | 168/18723 | 9.69e-14 | 4.69e-12 | 124 |
| GO:005165016 | Esophagus | ESCC | establishment of vesicle localization | 114/8552 | 161/18723 | 8.20e-11 | 2.53e-09 | 114 |
| GO:003070518 | Esophagus | ESCC | cytoskeleton-dependent intracellular transport | 133/8552 | 195/18723 | 1.48e-10 | 4.27e-09 | 133 |
| GO:005164815 | Esophagus | ESCC | vesicle localization | 119/8552 | 177/18723 | 5.16e-09 | 1.08e-07 | 119 |
| GO:00995185 | Esophagus | ESCC | vesicle cytoskeletal trafficking | 50/8552 | 73/18723 | 6.75e-05 | 5.12e-04 | 50 |
| GO:001097516 | Esophagus | ESCC | regulation of neuron projection development | 240/8552 | 445/18723 | 2.48e-04 | 1.53e-03 | 240 |
| GO:001635816 | Esophagus | ESCC | dendrite development | 130/8552 | 243/18723 | 8.33e-03 | 2.95e-02 | 130 |
| Hugo Symbol | Variant Class | Variant Classification | dbSNP RS | HGVSc | HGVSp | HGVSp Short | SWISSPROT | BIOTYPE | SIFT | PolyPhen | Tumor Sample Barcode | Tissue | Histology | Sex | Age | Stage | Therapy Types | Drugs | Outcome |
| TANC2 | SNV | Missense_Mutation | | c.2858G>T | p.Cys953Phe | p.C953F | Q9HCD6 | protein_coding | deleterious(0) | probably_damaging(0.996) | TCGA-A2-A0D2-01 | Breast | breast invasive carcinoma | Female | <65 | I/II | Chemotherapy | adriamycin | SD |
| TANC2 | SNV | Missense_Mutation | rs568898605 | c.2705N>G | p.Ala902Gly | p.A902G | Q9HCD6 | protein_coding | tolerated(0.13) | benign(0.029) | TCGA-A8-A06R-01 | Breast | breast invasive carcinoma | Female | >=65 | I/II | Chemotherapy | 5-fluorouracil | CR |
| TANC2 | SNV | Missense_Mutation | | c.5449N>A | p.Glu1817Lys | p.E1817K | Q9HCD6 | protein_coding | tolerated_low_confidence(0.07) | benign(0.01) | TCGA-AC-A23H-01 | Breast | breast invasive carcinoma | Female | >=65 | I/II | Unknown | Unknown | PD |
| TANC2 | SNV | Missense_Mutation | novel | c.4835N>C | p.Ile1612Thr | p.I1612T | Q9HCD6 | protein_coding | deleterious_low_confidence(0) | benign(0.188) | TCGA-AN-A046-01 | Breast | breast invasive carcinoma | Female | >=65 | I/II | Unknown | Unknown | SD |
| TANC2 | SNV | Missense_Mutation | novel | c.4787T>C | p.Val1596Ala | p.V1596A | Q9HCD6 | protein_coding | tolerated_low_confidence(0.28) | benign(0.024) | TCGA-AN-A04D-01 | Breast | breast invasive carcinoma | Female | <65 | I/II | Unknown | Unknown | SD |
| TANC2 | SNV | Missense_Mutation | | c.2979N>T | p.Gln993His | p.Q993H | Q9HCD6 | protein_coding | deleterious(0) | probably_damaging(1) | TCGA-AN-A0AK-01 | Breast | breast invasive carcinoma | Female | >=65 | I/II | Unknown | Unknown | SD |
| TANC2 | SNV | Missense_Mutation | | c.5311N>T | p.Pro1771Ser | p.P1771S | Q9HCD6 | protein_coding | tolerated_low_confidence(0.09) | probably_damaging(0.994) | TCGA-AR-A0TY-01 | Breast | breast invasive carcinoma | Female | <65 | I/II | Unspecific | Paclitaxel | PD |
| TANC2 | SNV | Missense_Mutation | rs568898605 | c.2705N>G | p.Ala902Gly | p.A902G | Q9HCD6 | protein_coding | tolerated(0.13) | benign(0.029) | TCGA-B6-A0I8-01 | Breast | breast invasive carcinoma | Female | <65 | I/II | Unknown | Unknown | PD |
| TANC2 | SNV | Missense_Mutation | | c.5350C>T | p.Pro1784Ser | p.P1784S | Q9HCD6 | protein_coding | tolerated_low_confidence(0.38) | possibly_damaging(0.508) | TCGA-B6-A0IH-01 | Breast | breast invasive carcinoma | Female | >=65 | III/IV | Unknown | Unknown | SD |
| TANC2 | SNV | Missense_Mutation | | c.3544G>A | p.Val1182Ile | p.V1182I | Q9HCD6 | protein_coding | deleterious(0.02) | possibly_damaging(0.565) | TCGA-B6-A0WS-01 | Breast | breast invasive carcinoma | Female | <65 | I/II | Unknown | Unknown | SD |


