| Tissue | Expression Dynamics | Abbreviation |
| Cervix | 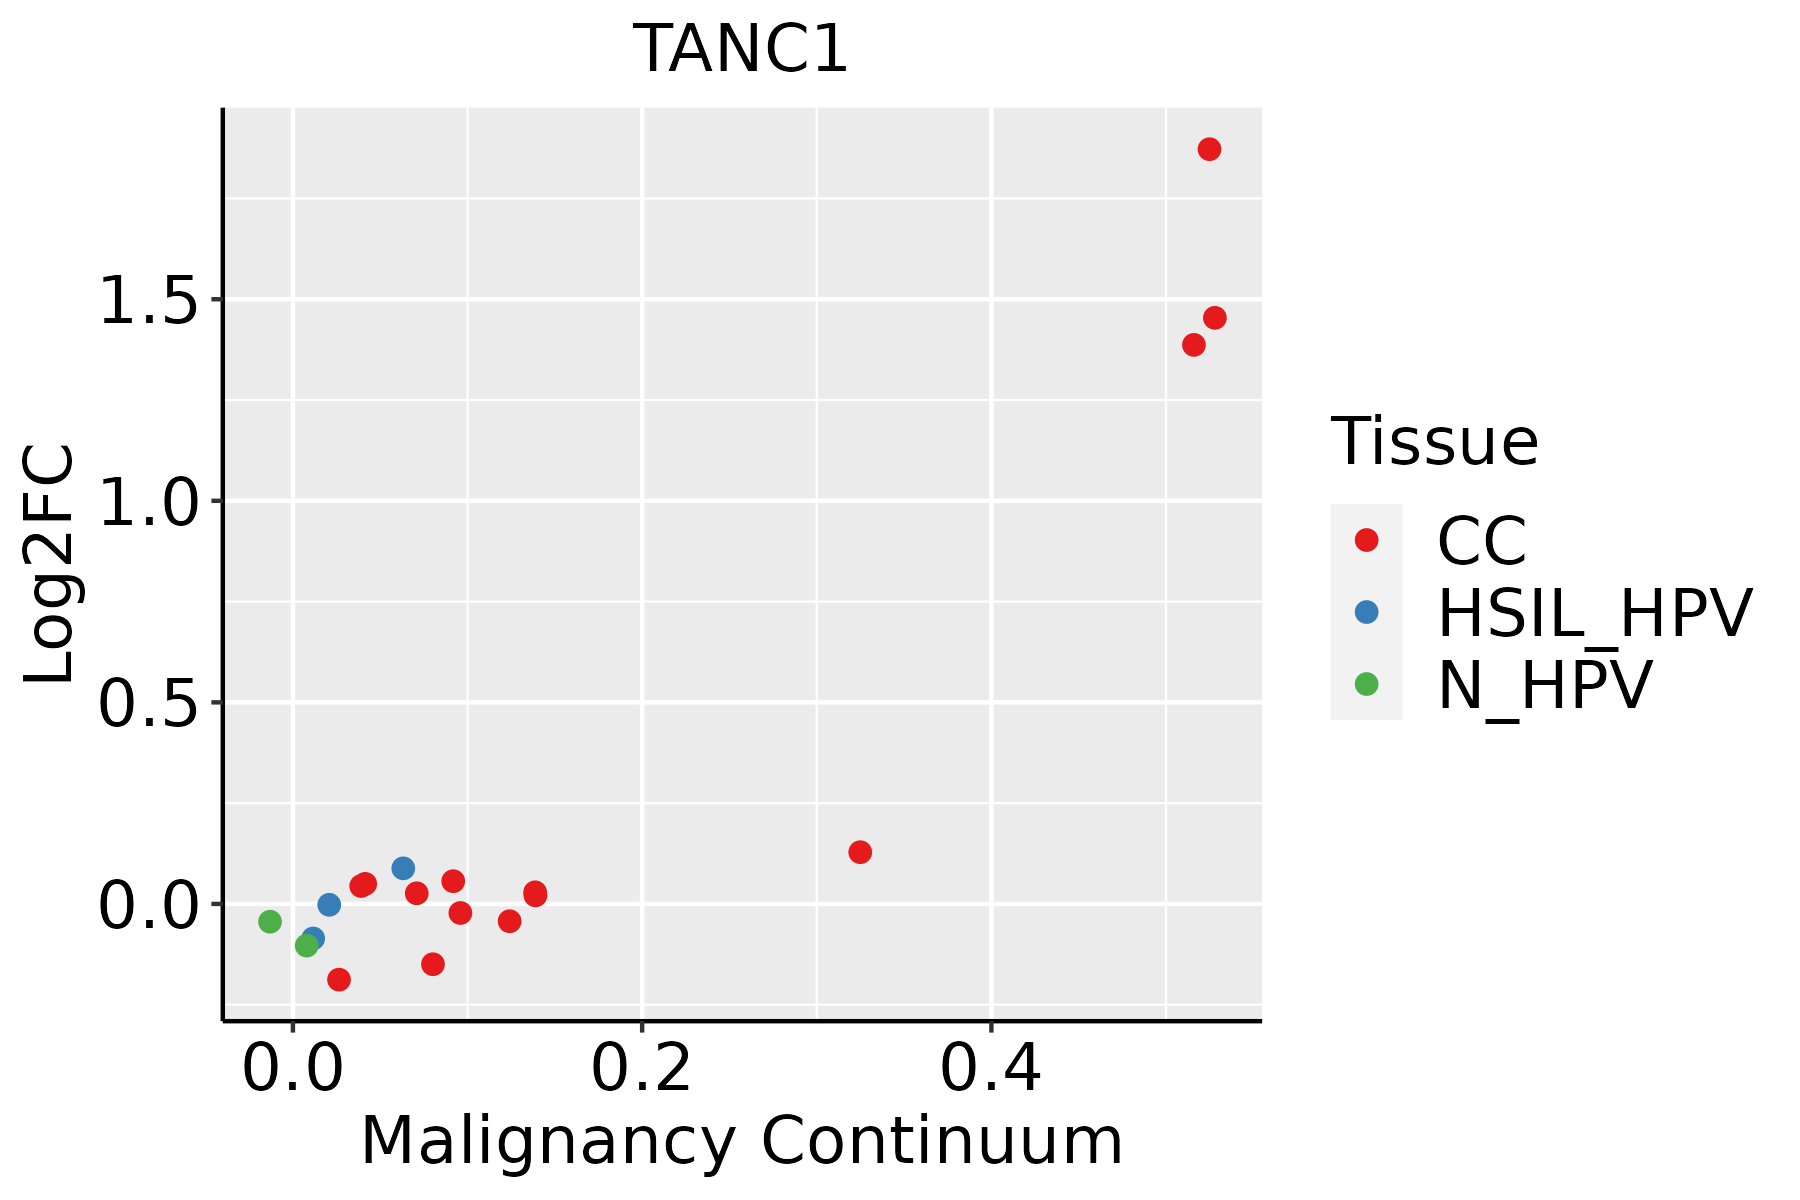 | CC: Cervix cancer |
| HSIL_HPV: HPV-infected high-grade squamous intraepithelial lesions |
| N_HPV: HPV-infected normal cervix |
| Colorectum (GSE201348) |  | FAP: Familial adenomatous polyposis |
| CRC: Colorectal cancer |
| Colorectum (HTA11) |  | AD: Adenomas |
| SER: Sessile serrated lesions |
| MSI-H: Microsatellite-high colorectal cancer |
| MSS: Microsatellite stable colorectal cancer |
| Endometrium |  | AEH: Atypical endometrial hyperplasia |
| EEC: Endometrioid Cancer |
| Esophagus | 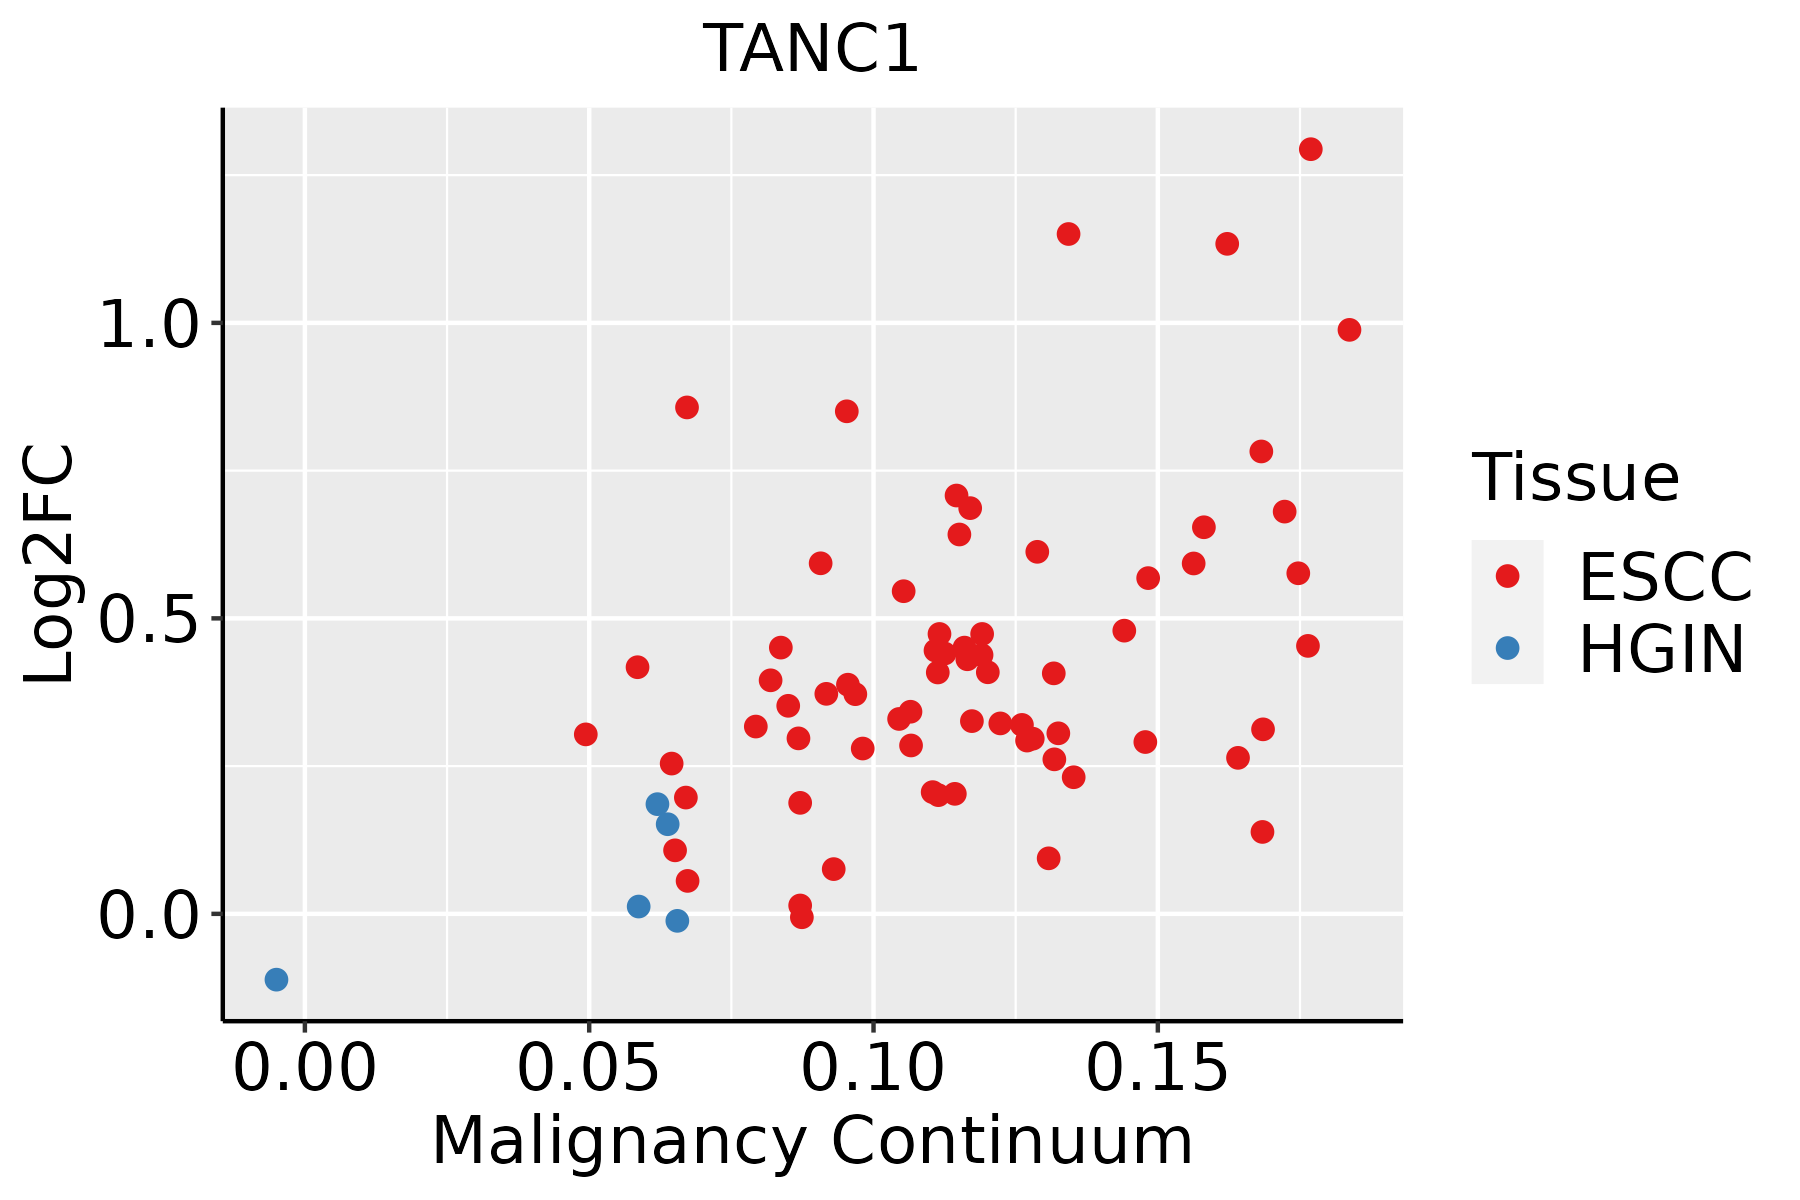 | ESCC: Esophageal squamous cell carcinoma |
| HGIN: High-grade intraepithelial neoplasias |
| LGIN: Low-grade intraepithelial neoplasias |
| Liver | 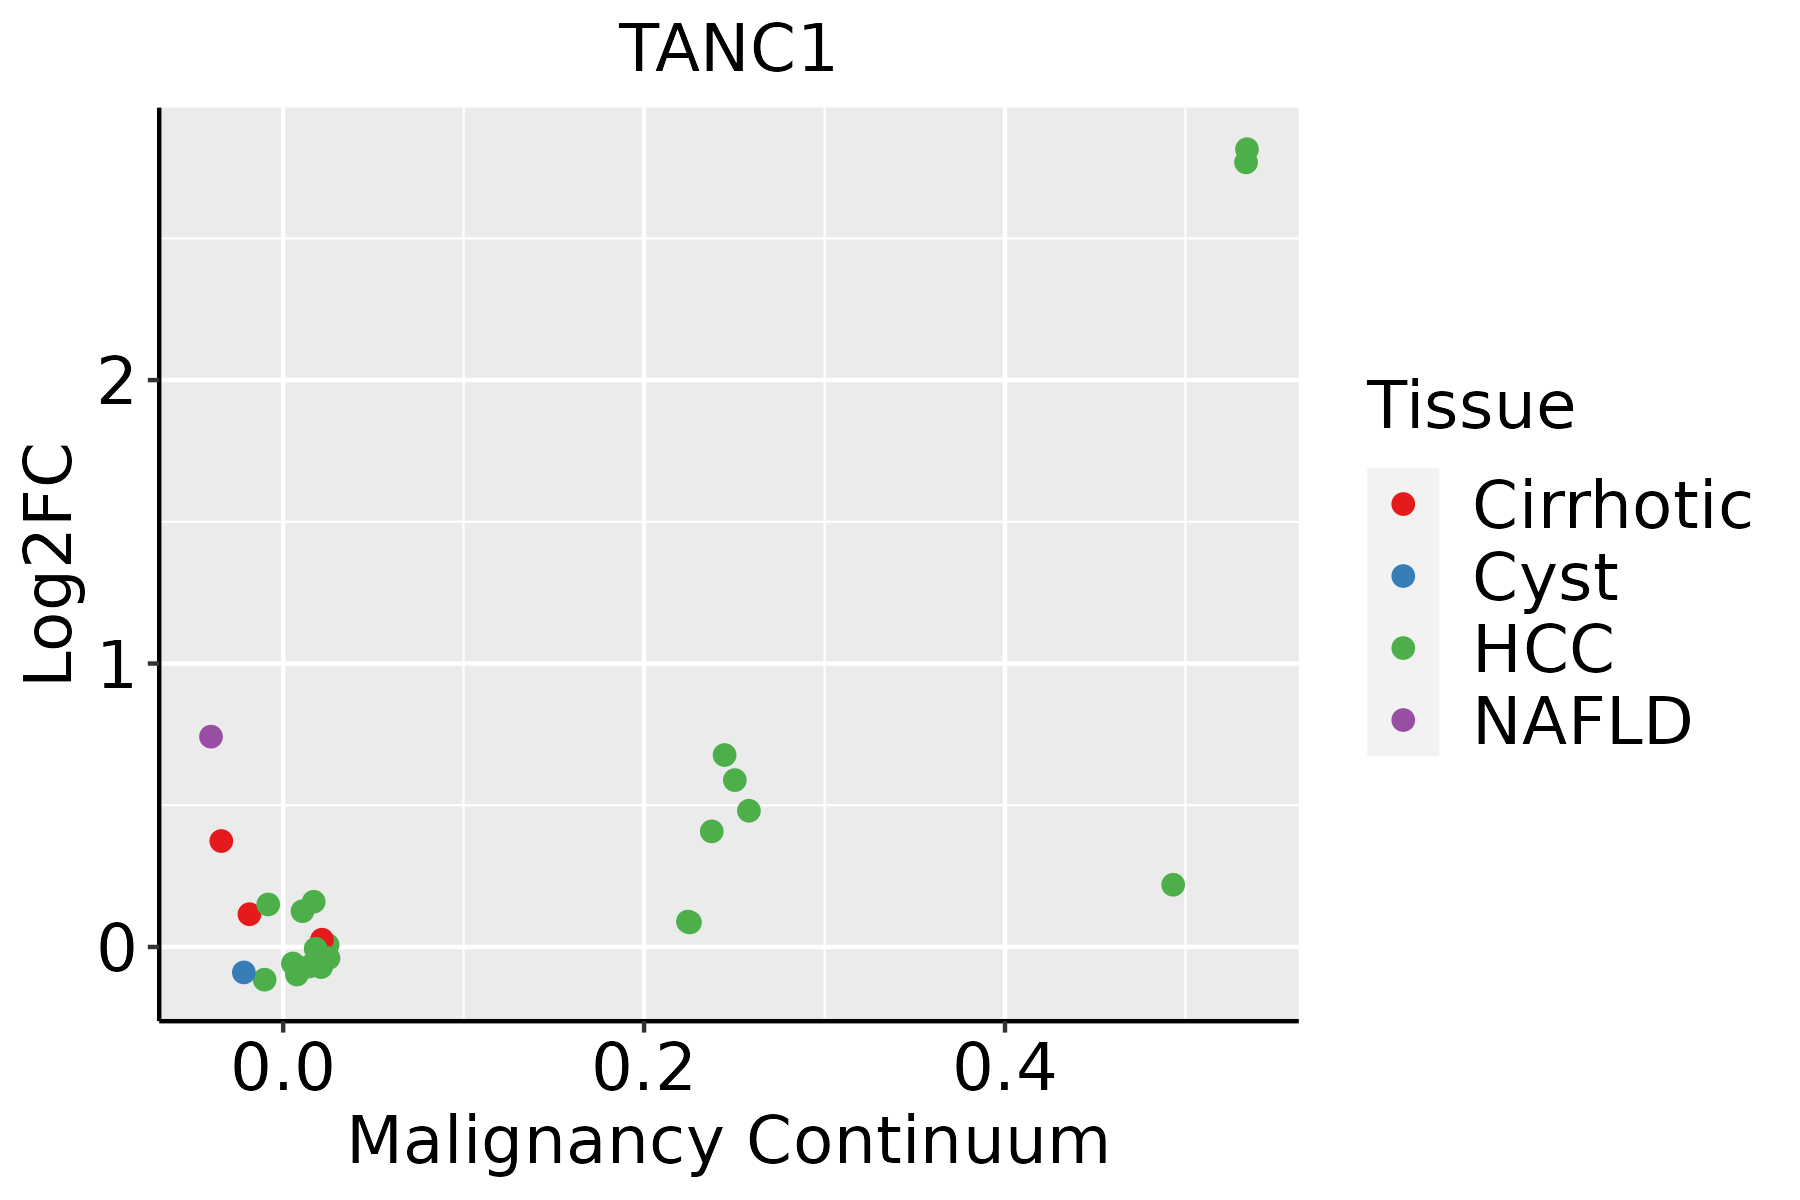 | HCC: Hepatocellular carcinoma |
| NAFLD: Non-alcoholic fatty liver disease |
| Lung | 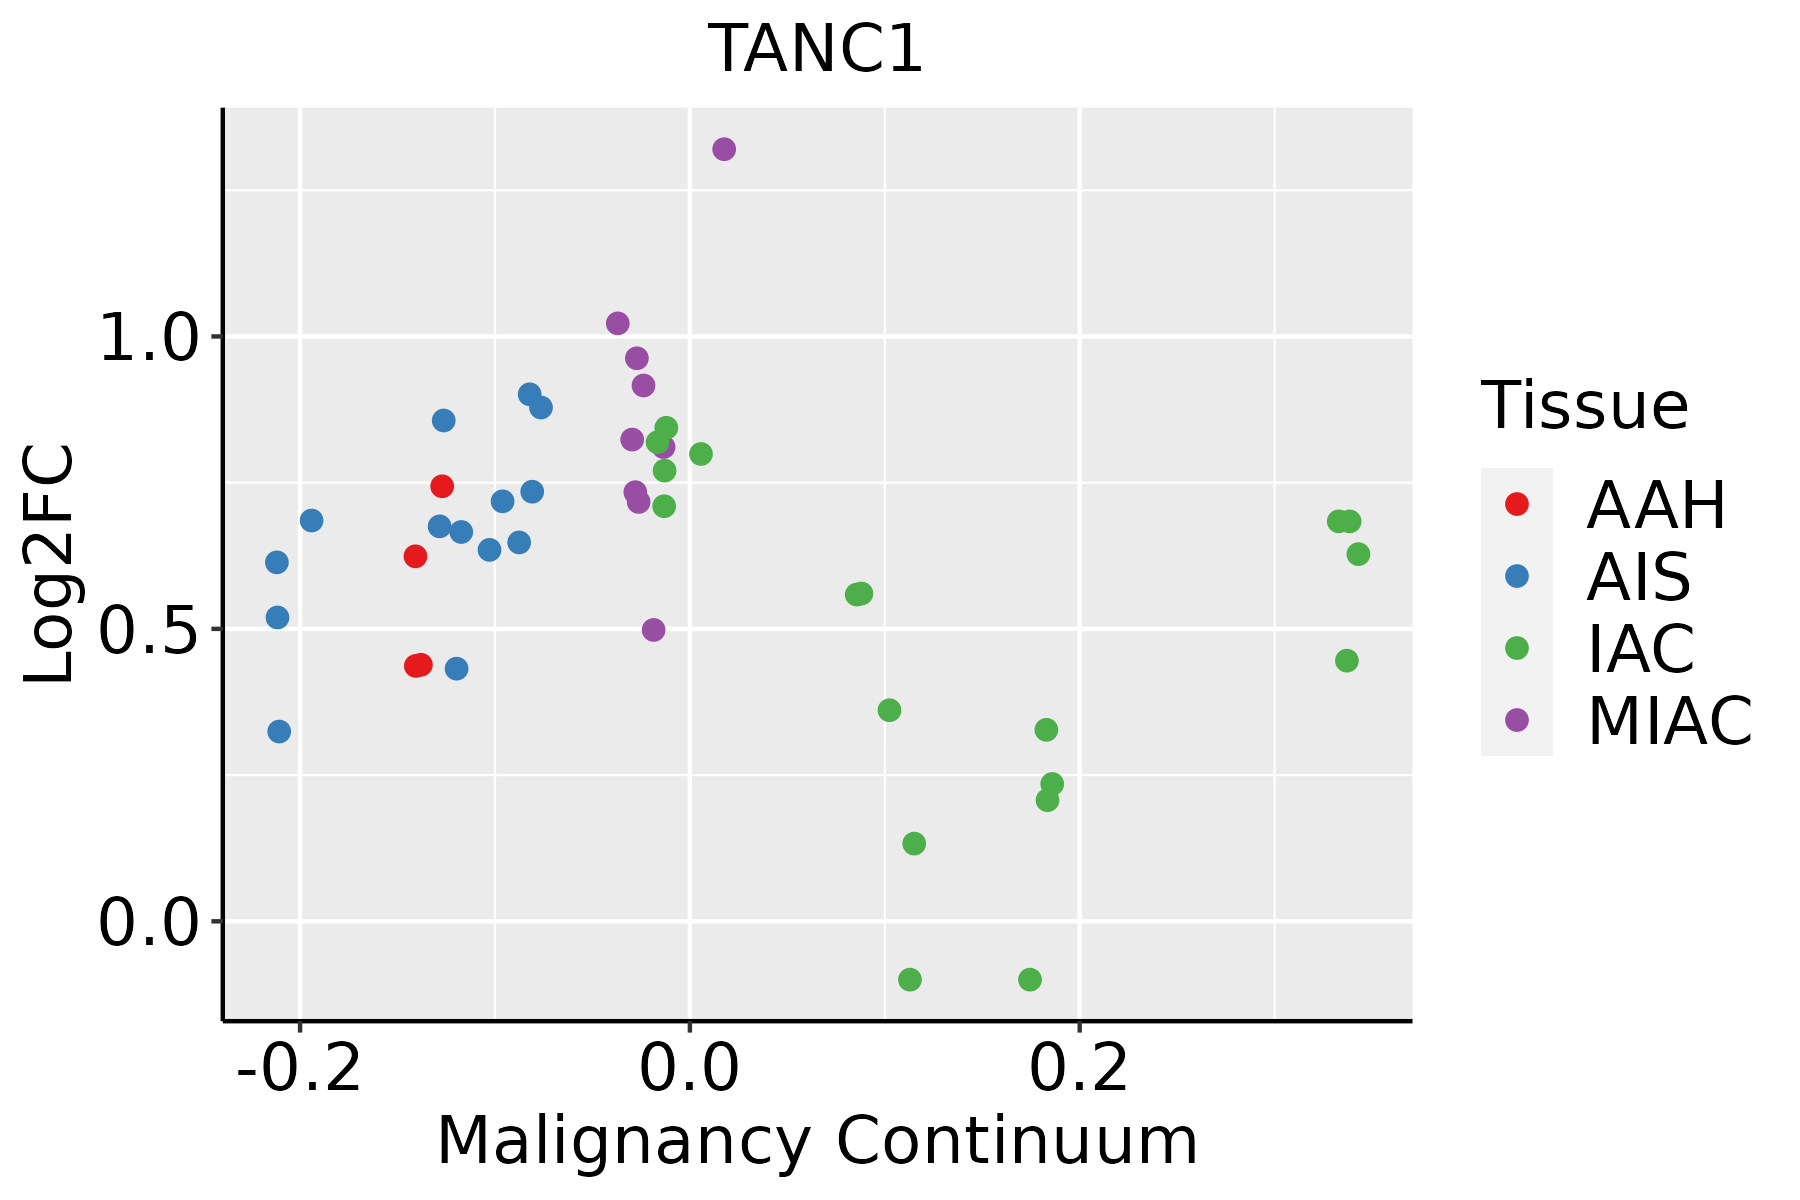 | AAH: Atypical adenomatous hyperplasia |
| AIS: Adenocarcinoma in situ |
| IAC: Invasive lung adenocarcinoma |
| MIA: Minimally invasive adenocarcinoma |
| Oral Cavity | 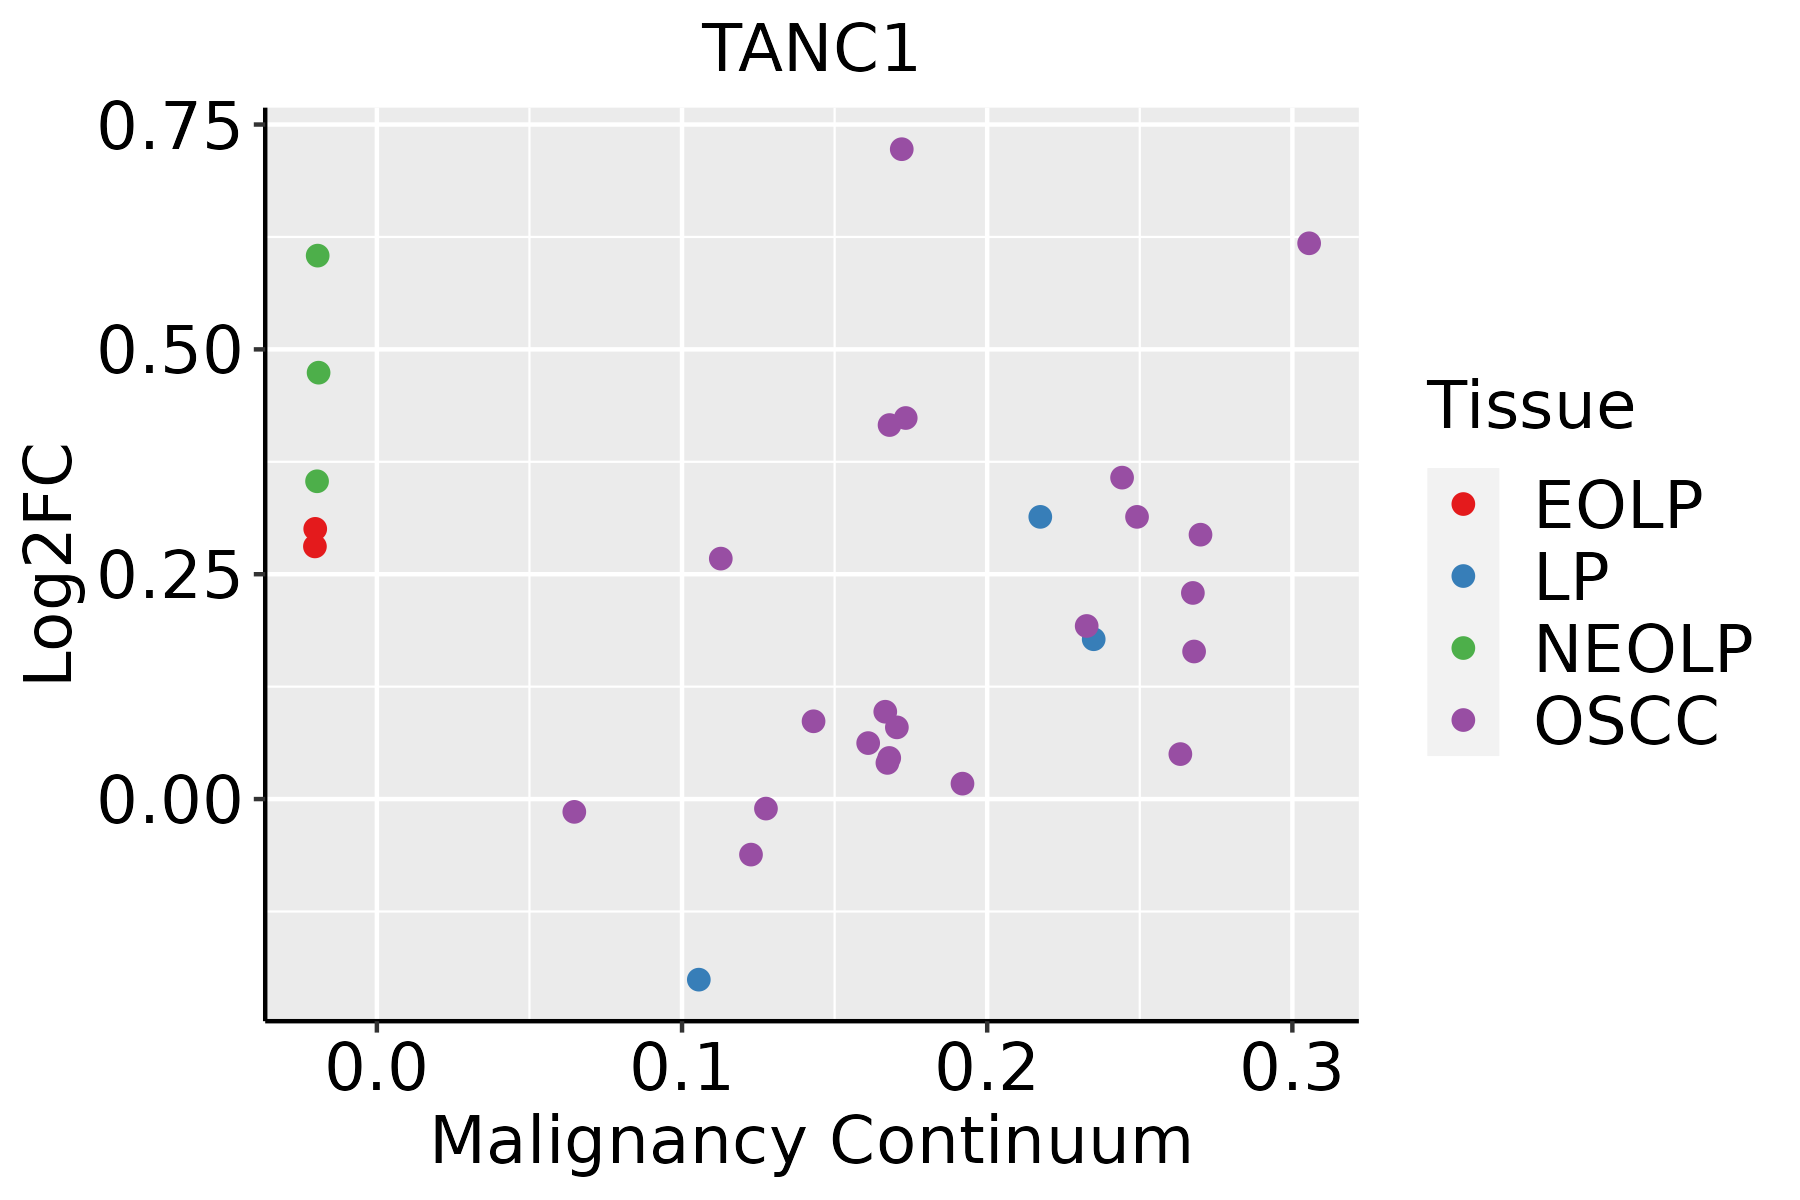 | EOLP: Erosive Oral lichen planus |
| LP: leukoplakia |
| NEOLP: Non-erosive oral lichen planus |
| OSCC: Oral squamous cell carcinoma |
| Prostate | 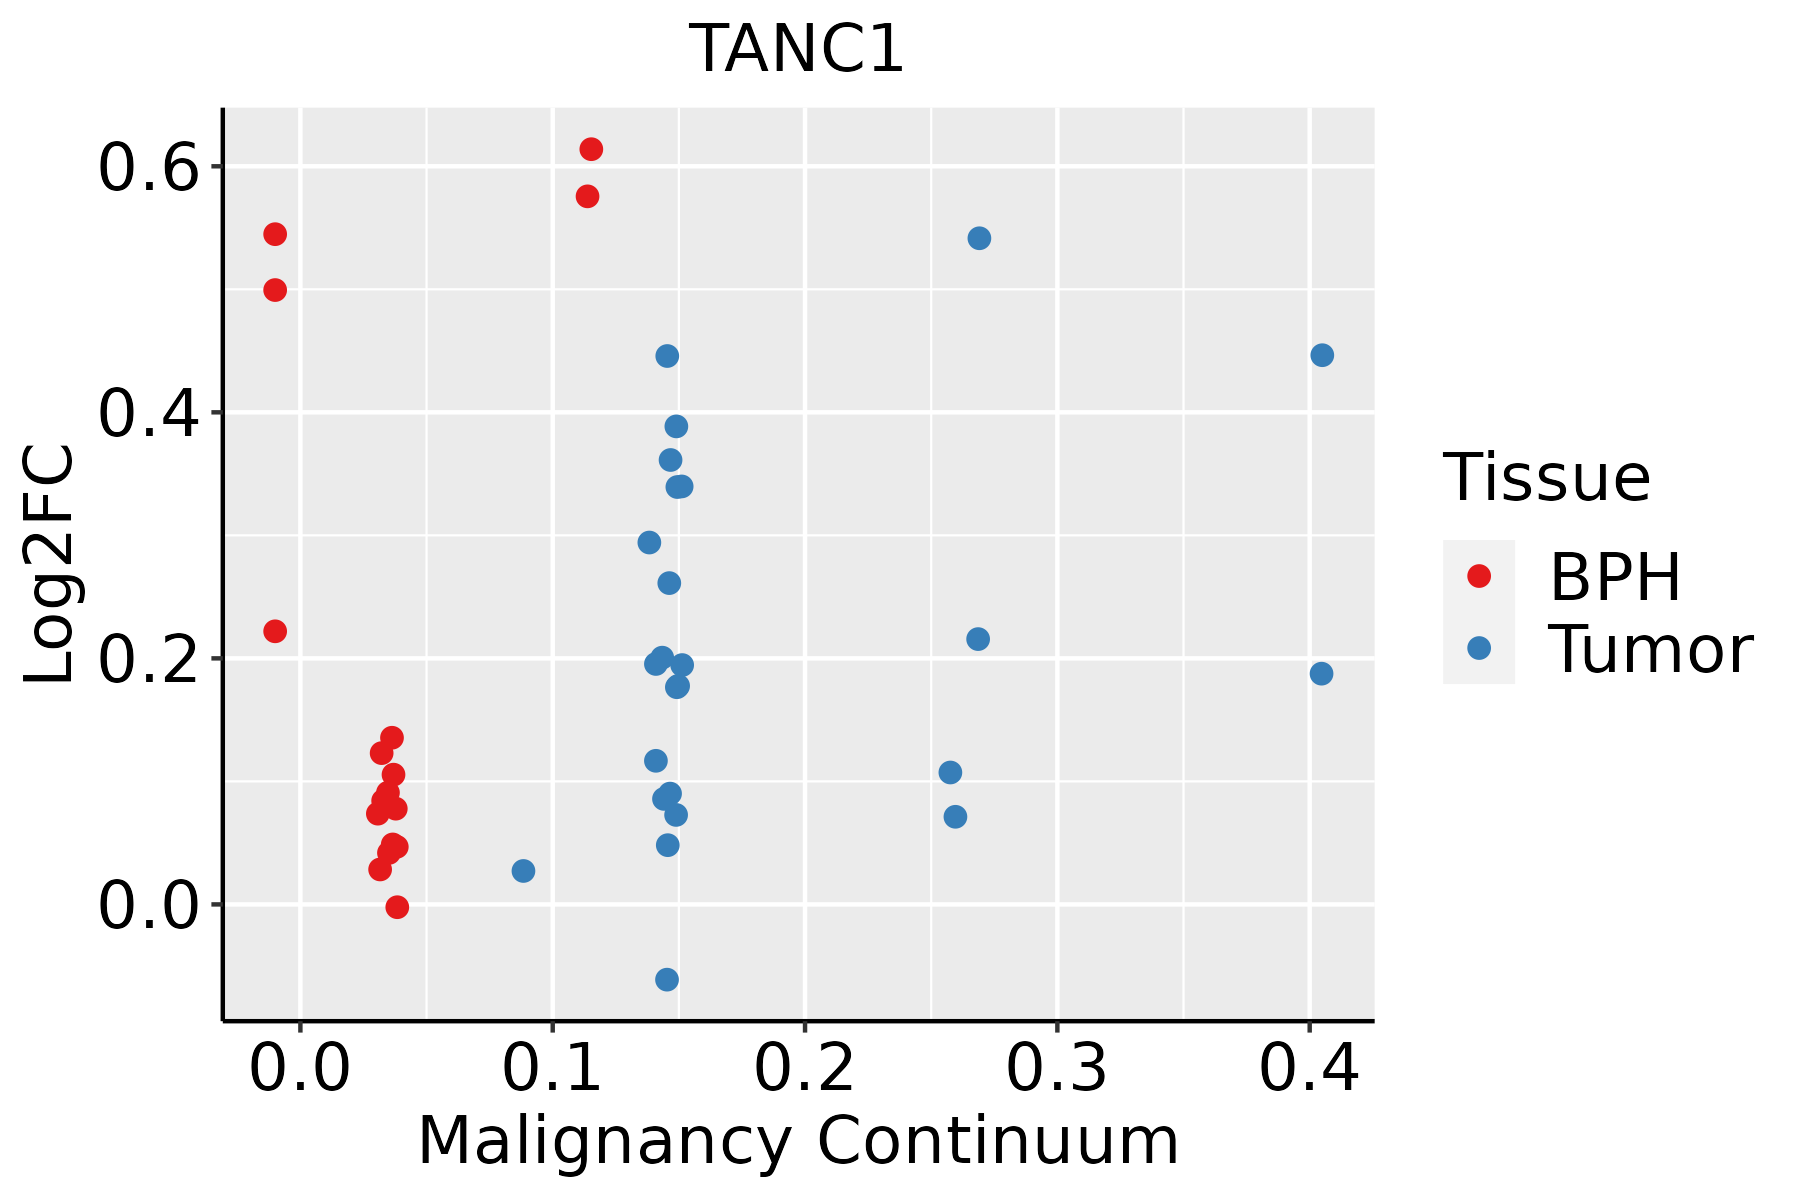 | BPH: Benign Prostatic Hyperplasia |
| Skin |  | AK: Actinic keratosis |
| cSCC: Cutaneous squamous cell carcinoma |
| SCCIS:squamous cell carcinoma in situ |
| Thyroid | 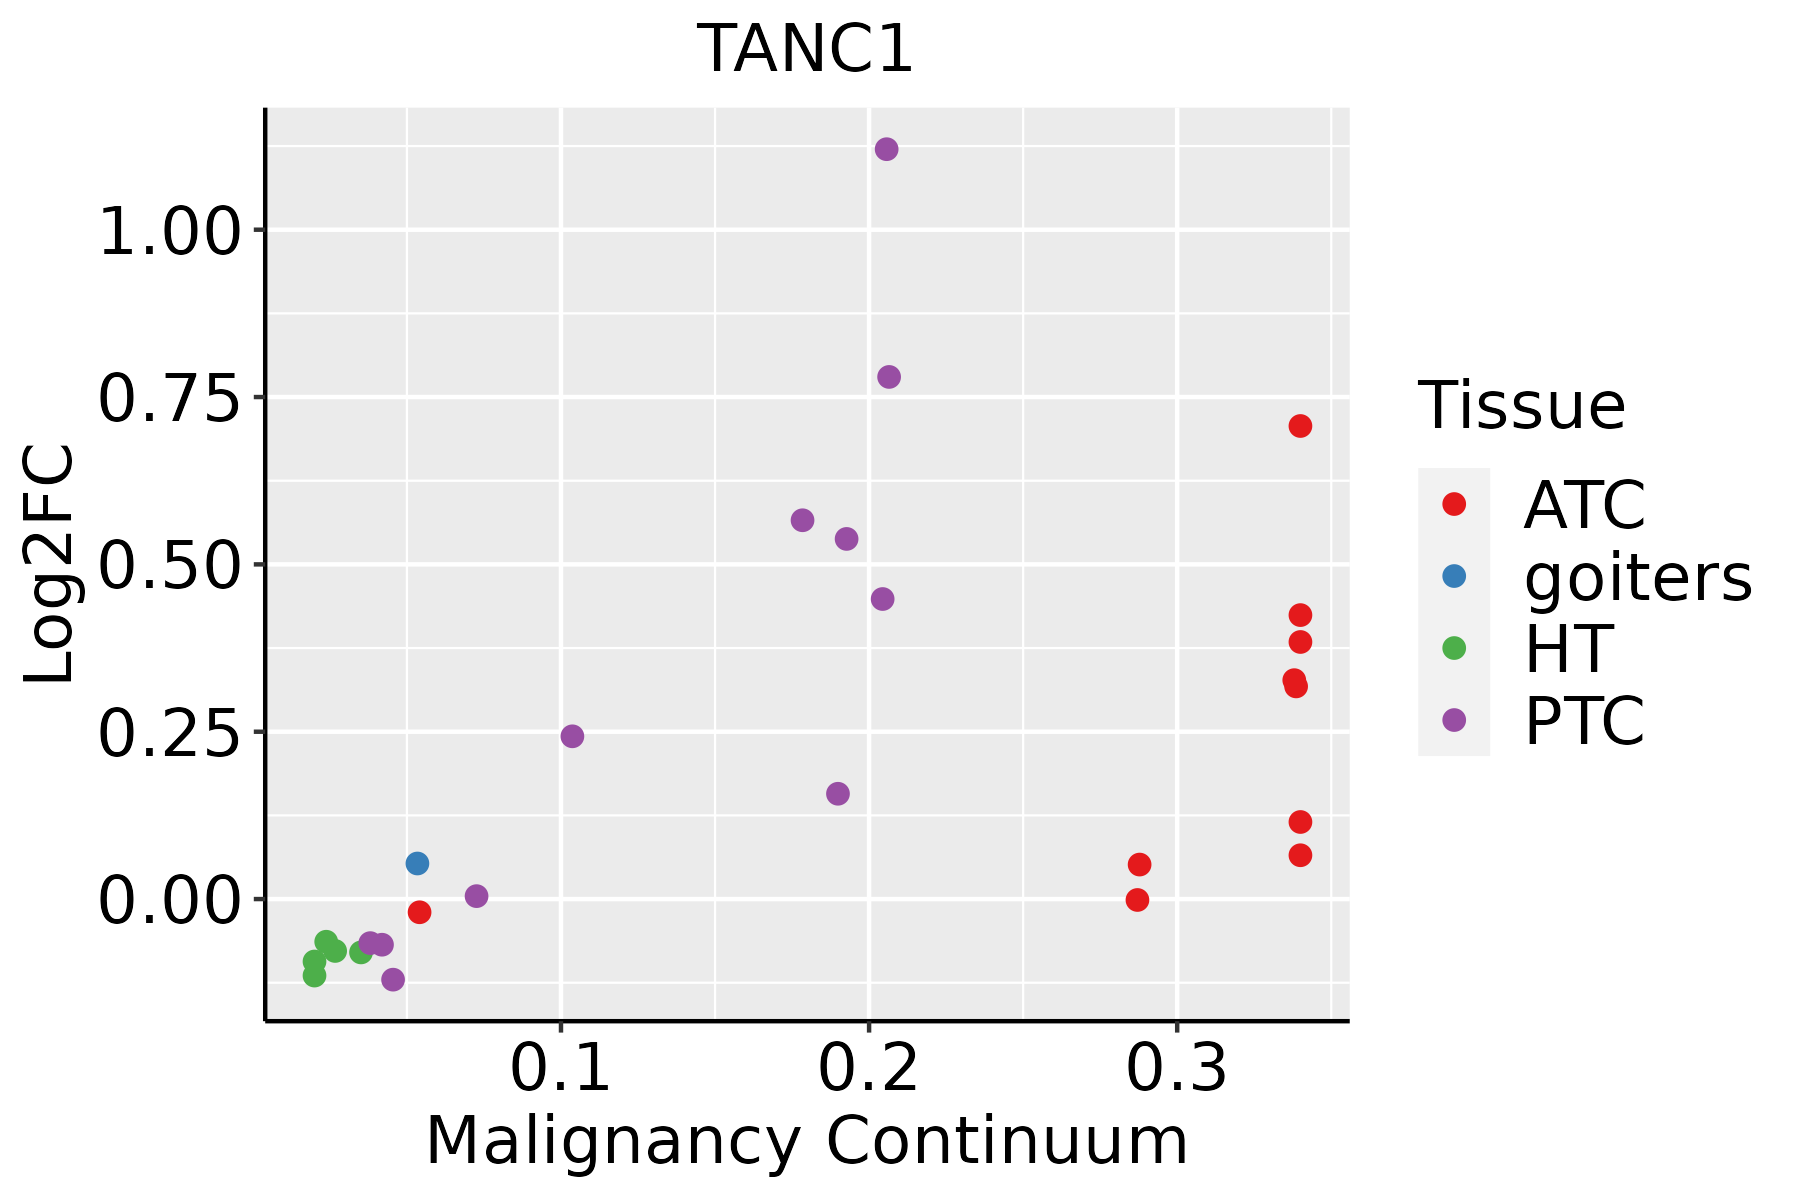 | ATC: Anaplastic thyroid cancer |
| HT: Hashimoto's thyroiditis |
| PTC: Papillary thyroid cancer |
| GO ID | Tissue | Disease Stage | Description | Gene Ratio | Bg Ratio | pvalue | p.adjust | Count |
| GO:00093149 | Cervix | CC | response to radiation | 86/2311 | 456/18723 | 3.50e-05 | 5.63e-04 | 86 |
| GO:00426924 | Cervix | CC | muscle cell differentiation | 69/2311 | 384/18723 | 8.12e-04 | 7.09e-03 | 69 |
| GO:0000768 | Cervix | CC | syncytium formation by plasma membrane fusion | 15/2311 | 55/18723 | 2.14e-03 | 1.54e-02 | 15 |
| GO:0140253 | Cervix | CC | cell-cell fusion | 15/2311 | 55/18723 | 2.14e-03 | 1.54e-02 | 15 |
| GO:00069491 | Cervix | CC | syncytium formation | 15/2311 | 57/18723 | 3.13e-03 | 2.05e-02 | 15 |
| GO:01060277 | Cervix | CC | neuron projection organization | 21/2311 | 93/18723 | 4.10e-03 | 2.54e-02 | 21 |
| GO:00511464 | Cervix | CC | striated muscle cell differentiation | 50/2311 | 283/18723 | 5.53e-03 | 3.19e-02 | 50 |
| GO:00094163 | Cervix | CC | response to light stimulus | 54/2311 | 320/18723 | 1.03e-02 | 4.97e-02 | 54 |
| GO:0106027 | Colorectum | AD | neuron projection organization | 36/3918 | 93/18723 | 6.58e-05 | 1.07e-03 | 36 |
| GO:0043954 | Colorectum | AD | cellular component maintenance | 26/3918 | 61/18723 | 1.04e-04 | 1.56e-03 | 26 |
| GO:0097061 | Colorectum | AD | dendritic spine organization | 31/3918 | 84/18723 | 5.48e-04 | 5.83e-03 | 31 |
| GO:0099173 | Colorectum | AD | postsynapse organization | 51/3918 | 168/18723 | 2.47e-03 | 1.90e-02 | 51 |
| GO:0050808 | Colorectum | AD | synapse organization | 112/3918 | 426/18723 | 4.25e-03 | 2.92e-02 | 112 |
| GO:0097062 | Colorectum | AD | dendritic spine maintenance | 10/3918 | 21/18723 | 5.71e-03 | 3.64e-02 | 10 |
| GO:01060271 | Colorectum | SER | neuron projection organization | 33/2897 | 93/18723 | 1.64e-06 | 7.23e-05 | 33 |
| GO:00970611 | Colorectum | SER | dendritic spine organization | 29/2897 | 84/18723 | 1.27e-05 | 4.01e-04 | 29 |
| GO:00991731 | Colorectum | SER | postsynapse organization | 46/2897 | 168/18723 | 5.20e-05 | 1.25e-03 | 46 |
| GO:00439541 | Colorectum | SER | cellular component maintenance | 22/2897 | 61/18723 | 6.47e-05 | 1.49e-03 | 22 |
| GO:00970621 | Colorectum | SER | dendritic spine maintenance | 9/2897 | 21/18723 | 2.50e-03 | 2.33e-02 | 9 |
| GO:00508081 | Colorectum | SER | synapse organization | 85/2897 | 426/18723 | 7.17e-03 | 4.99e-02 | 85 |
| Hugo Symbol | Variant Class | Variant Classification | dbSNP RS | HGVSc | HGVSp | HGVSp Short | SWISSPROT | BIOTYPE | SIFT | PolyPhen | Tumor Sample Barcode | Tissue | Histology | Sex | Age | Stage | Therapy Types | Drugs | Outcome |
| TANC1 | SNV | Missense_Mutation | | c.4186G>C | p.Ala1396Pro | p.A1396P | Q9C0D5 | protein_coding | deleterious(0) | probably_damaging(0.999) | TCGA-A1-A0SO-01 | Breast | breast invasive carcinoma | Female | >=65 | I/II | Chemotherapy | | SD |
| TANC1 | SNV | Missense_Mutation | rs777052839 | c.2433N>A | p.Met811Ile | p.M811I | Q9C0D5 | protein_coding | deleterious(0) | possibly_damaging(0.739) | TCGA-A2-A04P-01 | Breast | breast invasive carcinoma | Female | <65 | III/IV | Chemotherapy | taxol | PD |
| TANC1 | SNV | Missense_Mutation | rs372287259 | c.3259N>A | p.Ala1087Thr | p.A1087T | Q9C0D5 | protein_coding | deleterious(0.02) | benign(0.228) | TCGA-AN-A046-01 | Breast | breast invasive carcinoma | Female | >=65 | I/II | Unknown | Unknown | SD |
| TANC1 | SNV | Missense_Mutation | rs201847551 | c.4037N>A | p.Arg1346Gln | p.R1346Q | Q9C0D5 | protein_coding | deleterious(0) | probably_damaging(0.98) | TCGA-AN-A046-01 | Breast | breast invasive carcinoma | Female | >=65 | I/II | Unknown | Unknown | SD |
| TANC1 | SNV | Missense_Mutation | rs201847551 | c.4037N>A | p.Arg1346Gln | p.R1346Q | Q9C0D5 | protein_coding | deleterious(0) | probably_damaging(0.98) | TCGA-AQ-A04H-01 | Breast | breast invasive carcinoma | Female | <65 | III/IV | Chemotherapy | taxotere | SD |
| TANC1 | SNV | Missense_Mutation | | c.677N>A | p.Ile226Asn | p.I226N | Q9C0D5 | protein_coding | deleterious(0) | possibly_damaging(0.704) | TCGA-D8-A1XK-01 | Breast | breast invasive carcinoma | Female | <65 | I/II | Chemotherapy | doxorubicine+cyclophosphamide | SD |
| TANC1 | SNV | Missense_Mutation | | c.5476N>G | p.Leu1826Val | p.L1826V | Q9C0D5 | protein_coding | tolerated_low_confidence(1) | benign(0) | TCGA-E2-A14Z-01 | Breast | breast invasive carcinoma | Female | <65 | I/II | Hormone Therapy | arimidex | PD |
| TANC1 | SNV | Missense_Mutation | | c.517A>C | p.Ile173Leu | p.I173L | Q9C0D5 | protein_coding | tolerated(0.11) | benign(0.003) | TCGA-E2-A1AZ-01 | Breast | breast invasive carcinoma | Female | <65 | I/II | Chemotherapy | adriamycin | SD |
| TANC1 | SNV | Missense_Mutation | rs758340201 | c.863N>T | p.Ala288Val | p.A288V | Q9C0D5 | protein_coding | tolerated(0.31) | benign(0.01) | TCGA-E2-A1L7-01 | Breast | breast invasive carcinoma | Female | <65 | III/IV | Chemotherapy | cyclophosphamide | PD |
| TANC1 | SNV | Missense_Mutation | | c.2254G>C | p.Glu752Gln | p.E752Q | Q9C0D5 | protein_coding | tolerated(0.09) | benign(0.217) | TCGA-EW-A1J5-01 | Breast | breast invasive carcinoma | Female | <65 | I/II | Chemotherapy | adriamycin | SD |


