
|
|||||
|
 | |
| |
| |
| |
| |
| |
|
Gene: TALDO1 |
Gene summary for TALDO1 |
| Gene information | Species | Human | Gene symbol | TALDO1 | Gene ID | 6888 |
| Gene name | transaldolase 1 | |
| Gene Alias | TAL | |
| Cytomap | 11p15.5 | |
| Gene Type | protein-coding | GO ID | GO:0005975 | UniProtAcc | A0A140VK56 |
Top |
Malignant transformation analysis |
| Identification of the aberrant gene expression in precancerous and cancerous lesions by comparing the gene expression of stem-like cells in diseased tissues with normal stem cells |
| Entrez ID | Symbol | Replicates | Species | Organ | Tissue | Adj P-value | Log2FC | Malignancy |
| 6888 | TALDO1 | GSM4909282 | Human | Breast | IDC | 2.87e-02 | 2.13e-01 | -0.0288 |
| 6888 | TALDO1 | GSM4909285 | Human | Breast | IDC | 7.77e-09 | 1.31e-01 | 0.21 |
| 6888 | TALDO1 | GSM4909286 | Human | Breast | IDC | 2.22e-12 | -4.12e-01 | 0.1081 |
| 6888 | TALDO1 | GSM4909293 | Human | Breast | IDC | 5.46e-07 | -2.53e-01 | 0.1581 |
| 6888 | TALDO1 | GSM4909297 | Human | Breast | IDC | 1.50e-07 | -3.47e-01 | 0.1517 |
| 6888 | TALDO1 | GSM4909298 | Human | Breast | IDC | 3.91e-02 | -1.48e-01 | 0.1551 |
| 6888 | TALDO1 | GSM4909299 | Human | Breast | IDC | 7.81e-04 | -3.00e-01 | 0.035 |
| 6888 | TALDO1 | GSM4909301 | Human | Breast | IDC | 1.80e-02 | -3.43e-01 | 0.1577 |
| 6888 | TALDO1 | GSM4909302 | Human | Breast | IDC | 9.07e-03 | -3.61e-01 | 0.1545 |
| 6888 | TALDO1 | GSM4909305 | Human | Breast | IDC | 9.09e-06 | -1.52e-01 | 0.0436 |
| 6888 | TALDO1 | GSM4909308 | Human | Breast | IDC | 3.98e-08 | 9.26e-02 | 0.158 |
| 6888 | TALDO1 | GSM4909311 | Human | Breast | IDC | 4.19e-26 | -5.86e-01 | 0.1534 |
| 6888 | TALDO1 | GSM4909312 | Human | Breast | IDC | 4.68e-09 | -4.91e-01 | 0.1552 |
| 6888 | TALDO1 | GSM4909313 | Human | Breast | IDC | 4.96e-03 | -4.08e-01 | 0.0391 |
| 6888 | TALDO1 | GSM4909317 | Human | Breast | IDC | 4.37e-03 | 2.42e-02 | 0.1355 |
| 6888 | TALDO1 | GSM4909319 | Human | Breast | IDC | 2.16e-33 | -4.83e-01 | 0.1563 |
| 6888 | TALDO1 | GSM4909320 | Human | Breast | IDC | 3.10e-02 | -4.69e-01 | 0.1575 |
| 6888 | TALDO1 | GSM4909321 | Human | Breast | IDC | 2.05e-03 | 1.11e-02 | 0.1559 |
| 6888 | TALDO1 | ctrl6 | Human | Breast | Precancer | 2.97e-02 | -3.57e-01 | -0.0061 |
| 6888 | TALDO1 | brca1 | Human | Breast | Precancer | 9.27e-48 | 7.91e-01 | -0.0338 |
| Page: 1 2 3 4 5 6 7 8 9 10 11 12 13 |
| Tissue | Expression Dynamics | Abbreviation |
| Breast |  | IDC: Invasive ductal carcinoma |
| DCIS: Ductal carcinoma in situ | ||
| Precancer(BRCA1-mut): Precancerous lesion from BRCA1 mutation carriers | ||
| Cervix |  | CC: Cervix cancer |
| HSIL_HPV: HPV-infected high-grade squamous intraepithelial lesions | ||
| N_HPV: HPV-infected normal cervix | ||
| Colorectum (GSE201348) |  | FAP: Familial adenomatous polyposis |
| CRC: Colorectal cancer | ||
| Colorectum (HTA11) | 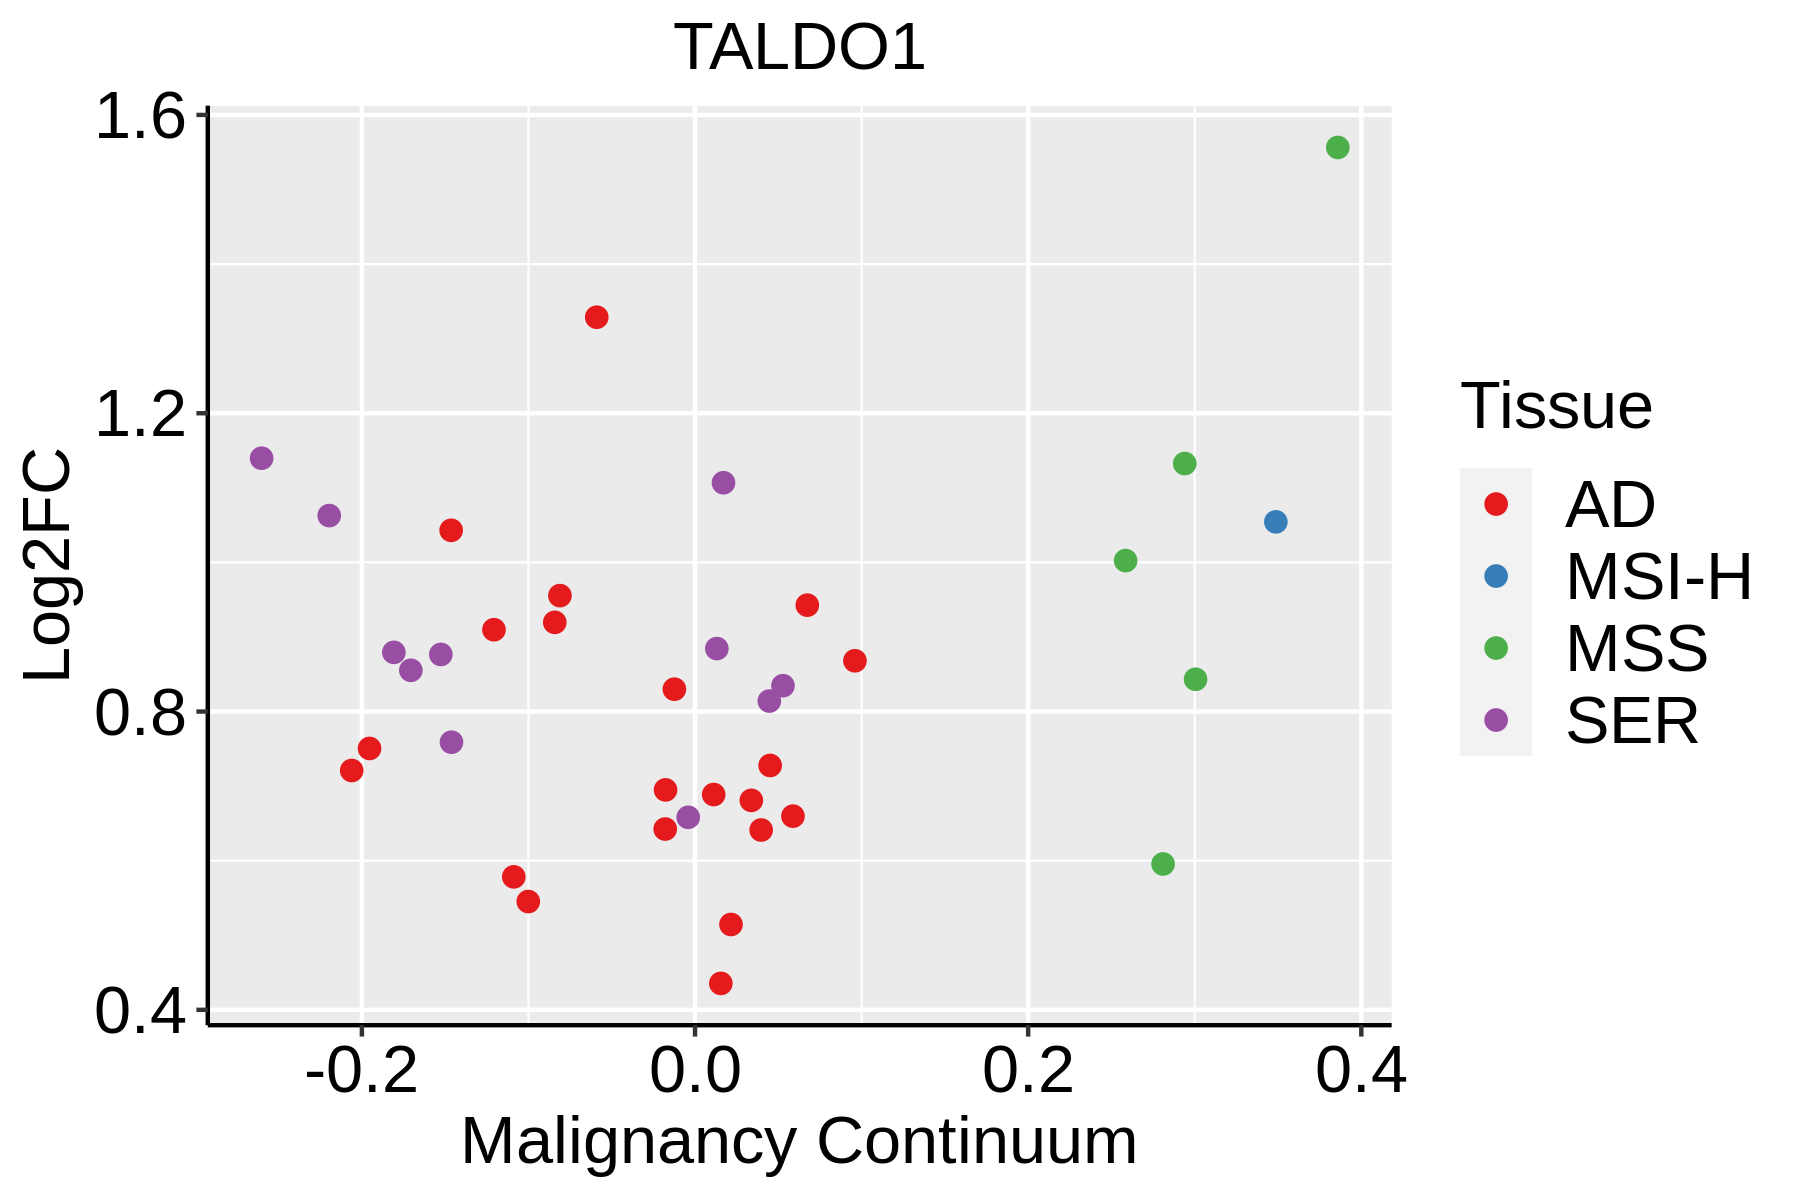 | AD: Adenomas |
| SER: Sessile serrated lesions | ||
| MSI-H: Microsatellite-high colorectal cancer | ||
| MSS: Microsatellite stable colorectal cancer | ||
| Endometrium | 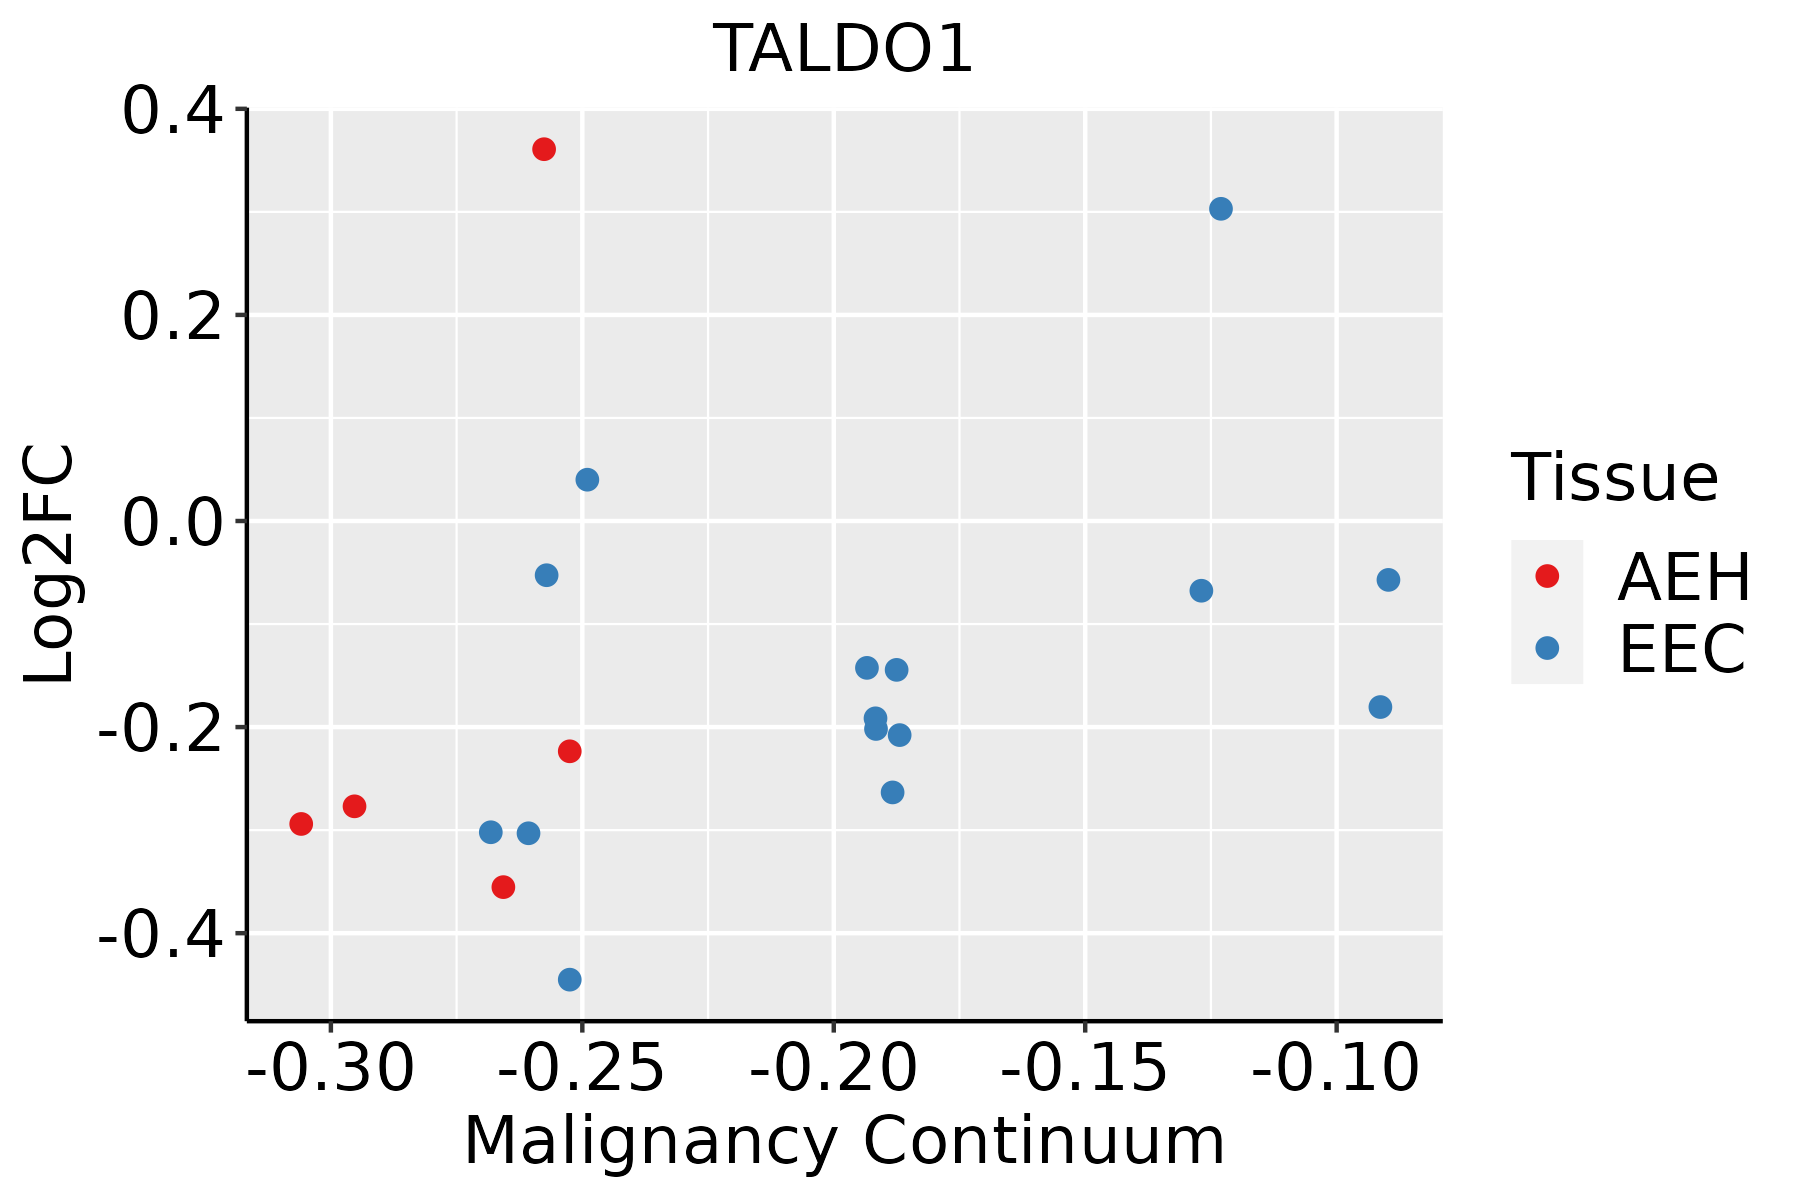 | AEH: Atypical endometrial hyperplasia |
| EEC: Endometrioid Cancer | ||
| Esophagus | 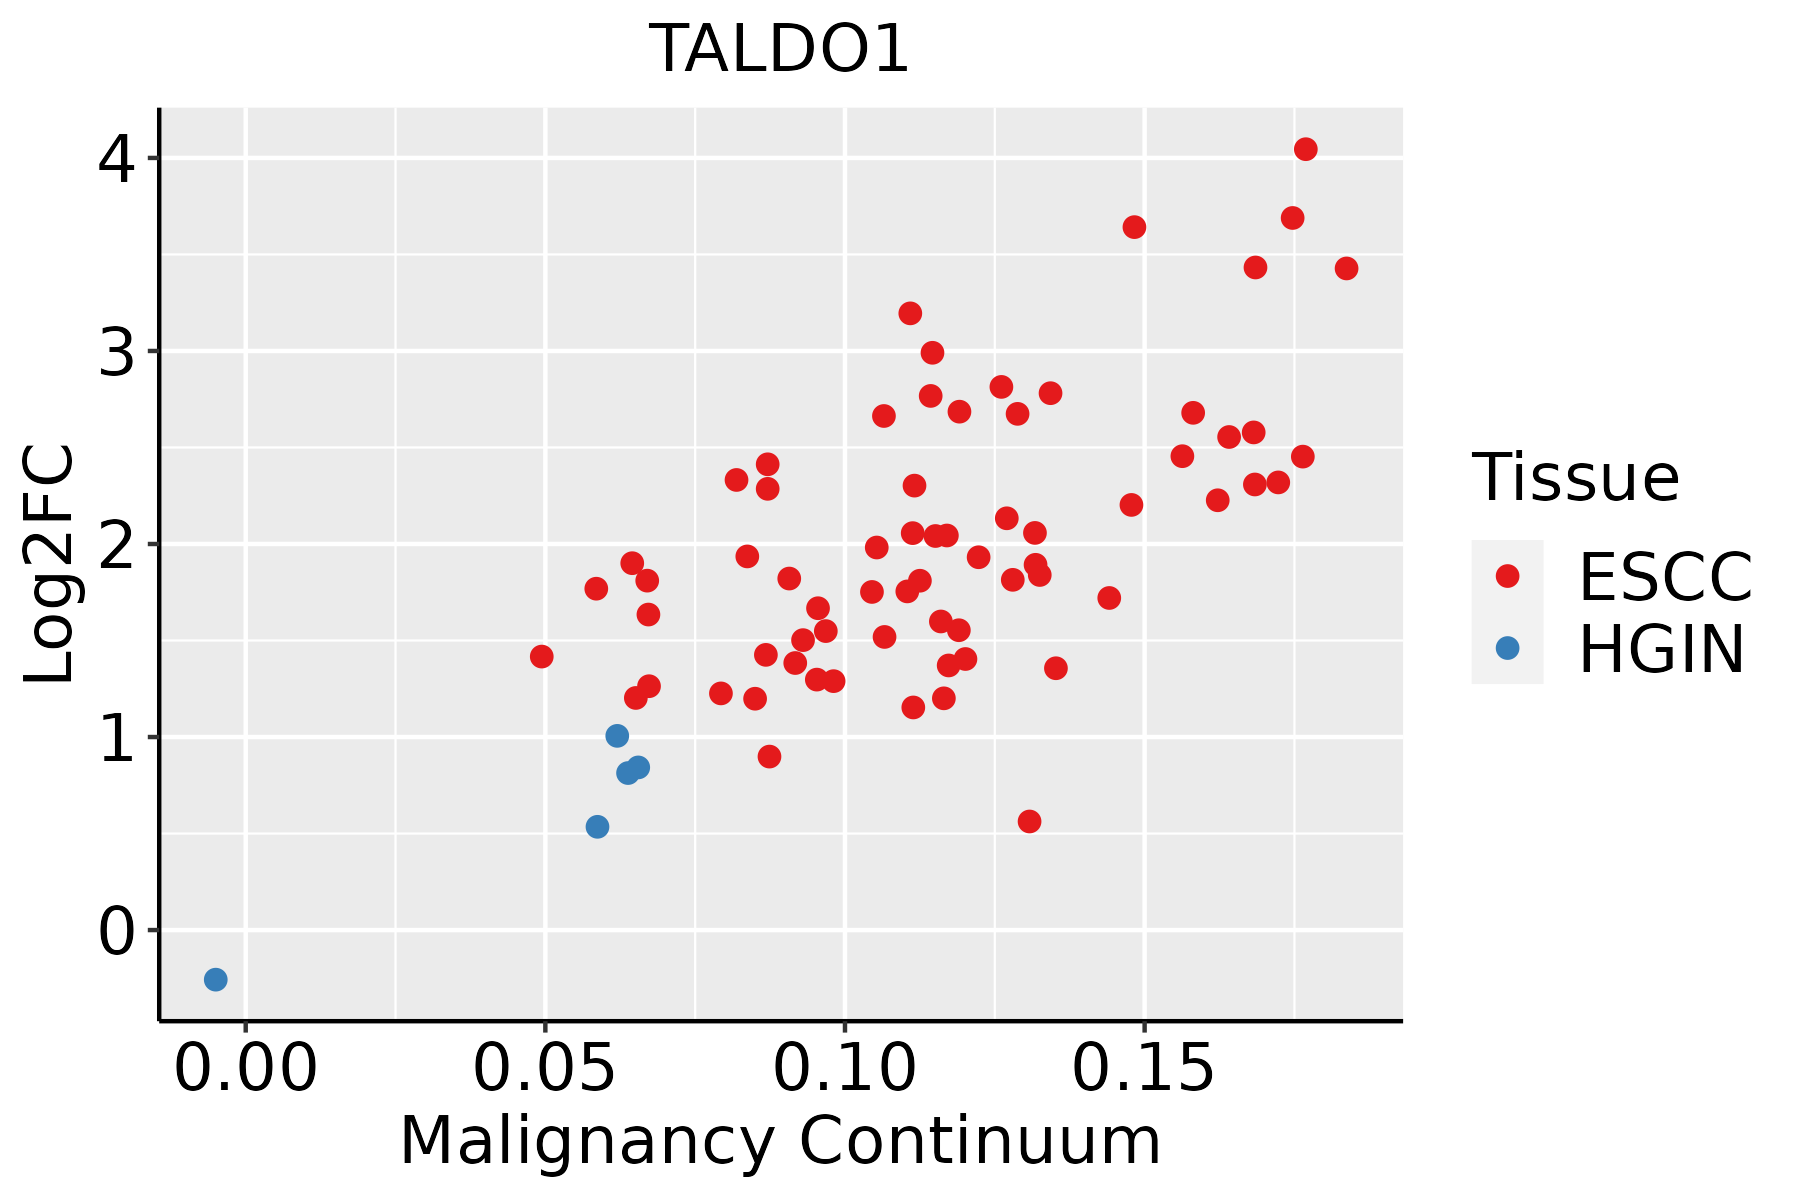 | ESCC: Esophageal squamous cell carcinoma |
| HGIN: High-grade intraepithelial neoplasias | ||
| LGIN: Low-grade intraepithelial neoplasias | ||
| GC | 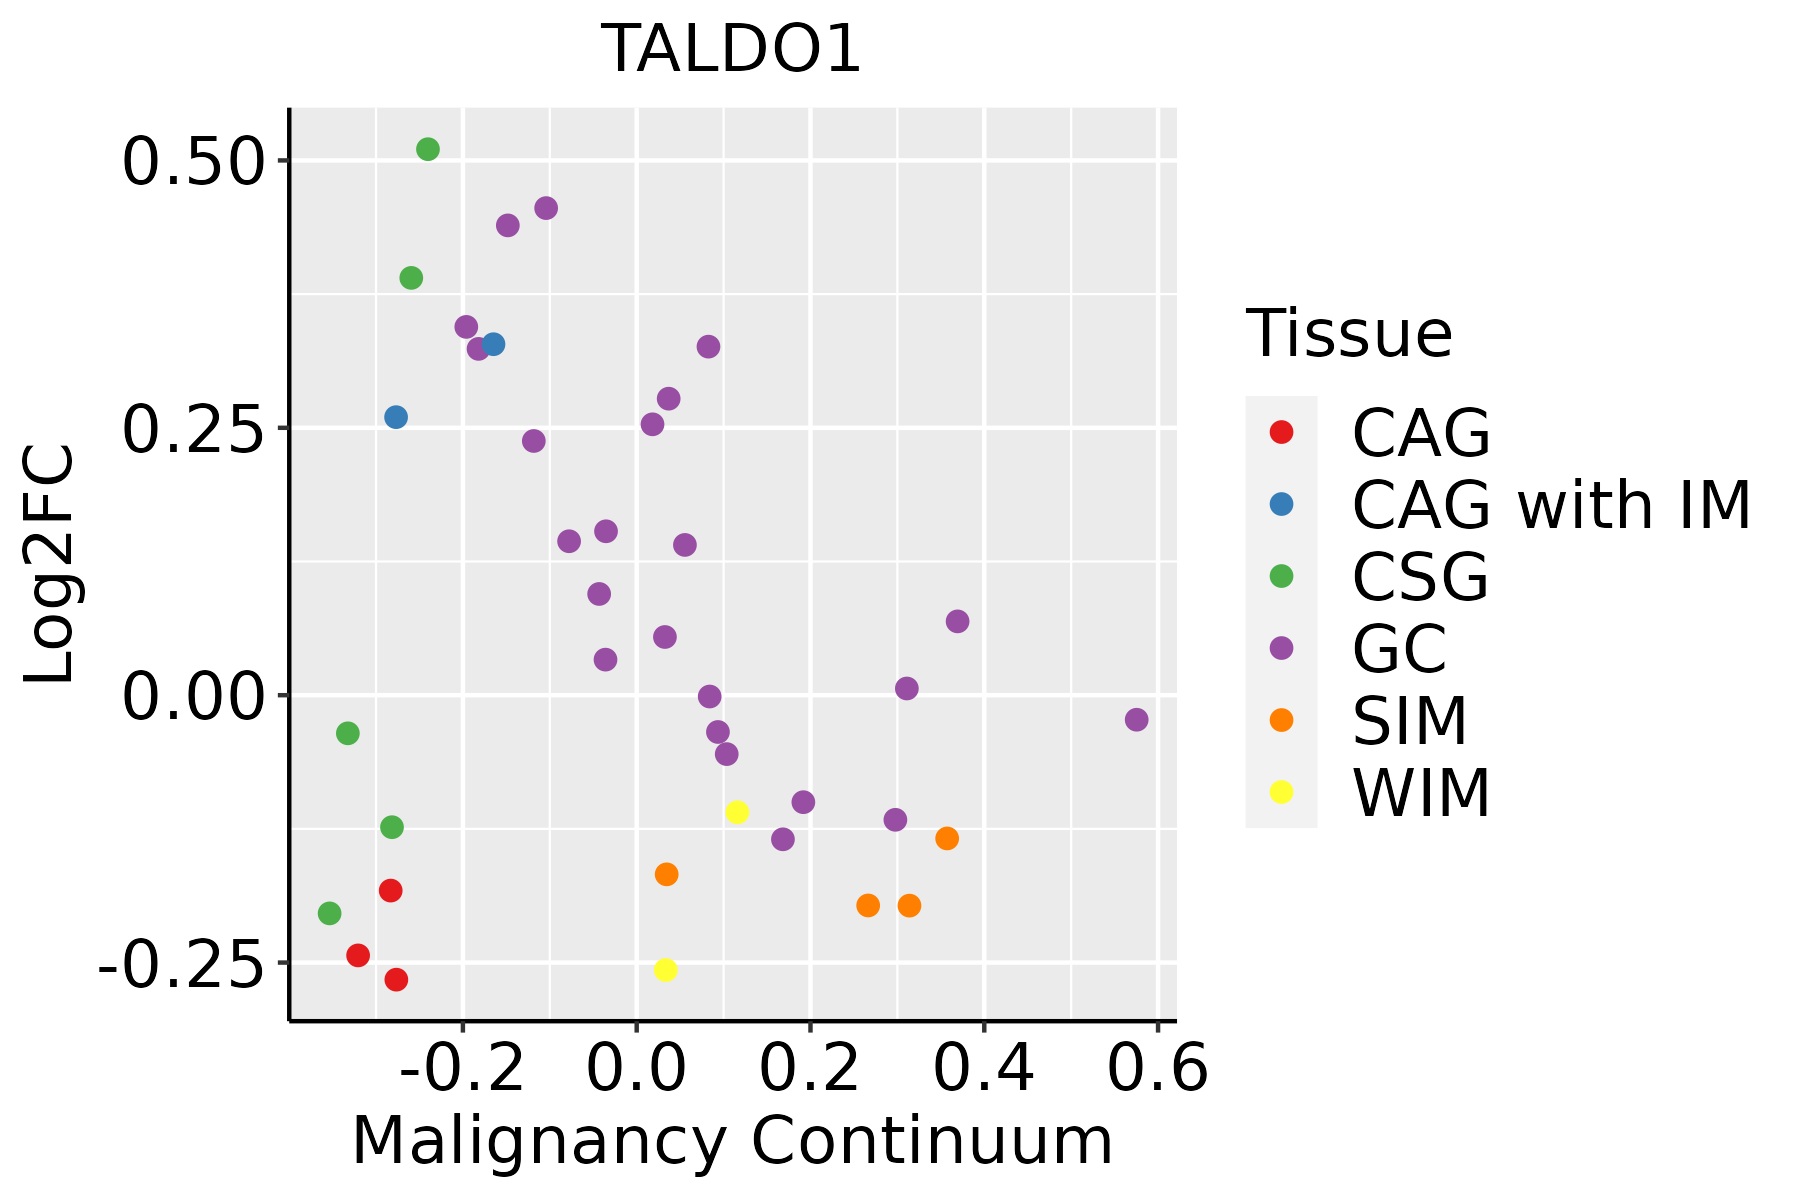 | CAG: Chronic atrophic gastritis |
| CAG with IM: Chronic atrophic gastritis with intestinal metaplasia | ||
| CSG: Chronic superficial gastritis | ||
| GC: Gastric cancer | ||
| SIM: Severe intestinal metaplasia | ||
| WIM: Wild intestinal metaplasia | ||
| Liver | 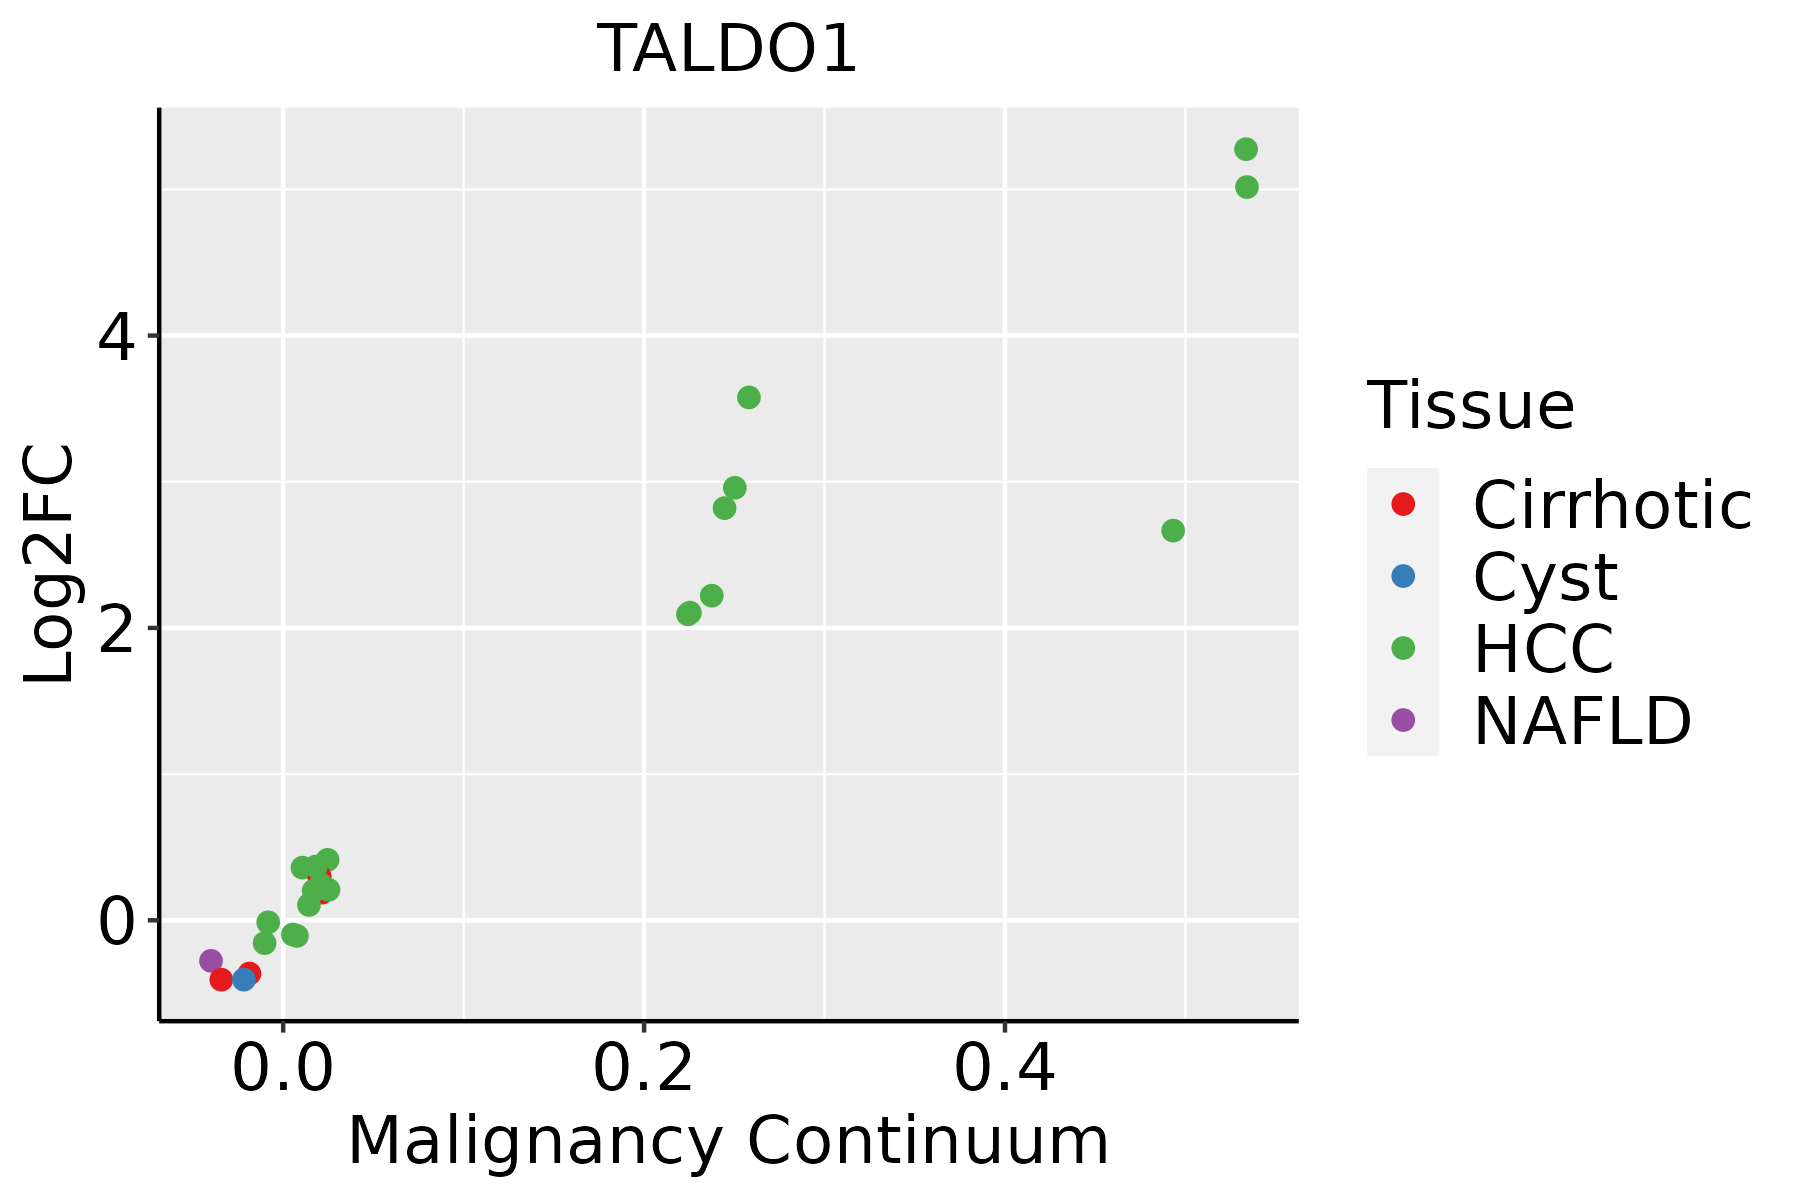 | HCC: Hepatocellular carcinoma |
| NAFLD: Non-alcoholic fatty liver disease | ||
| Oral Cavity | 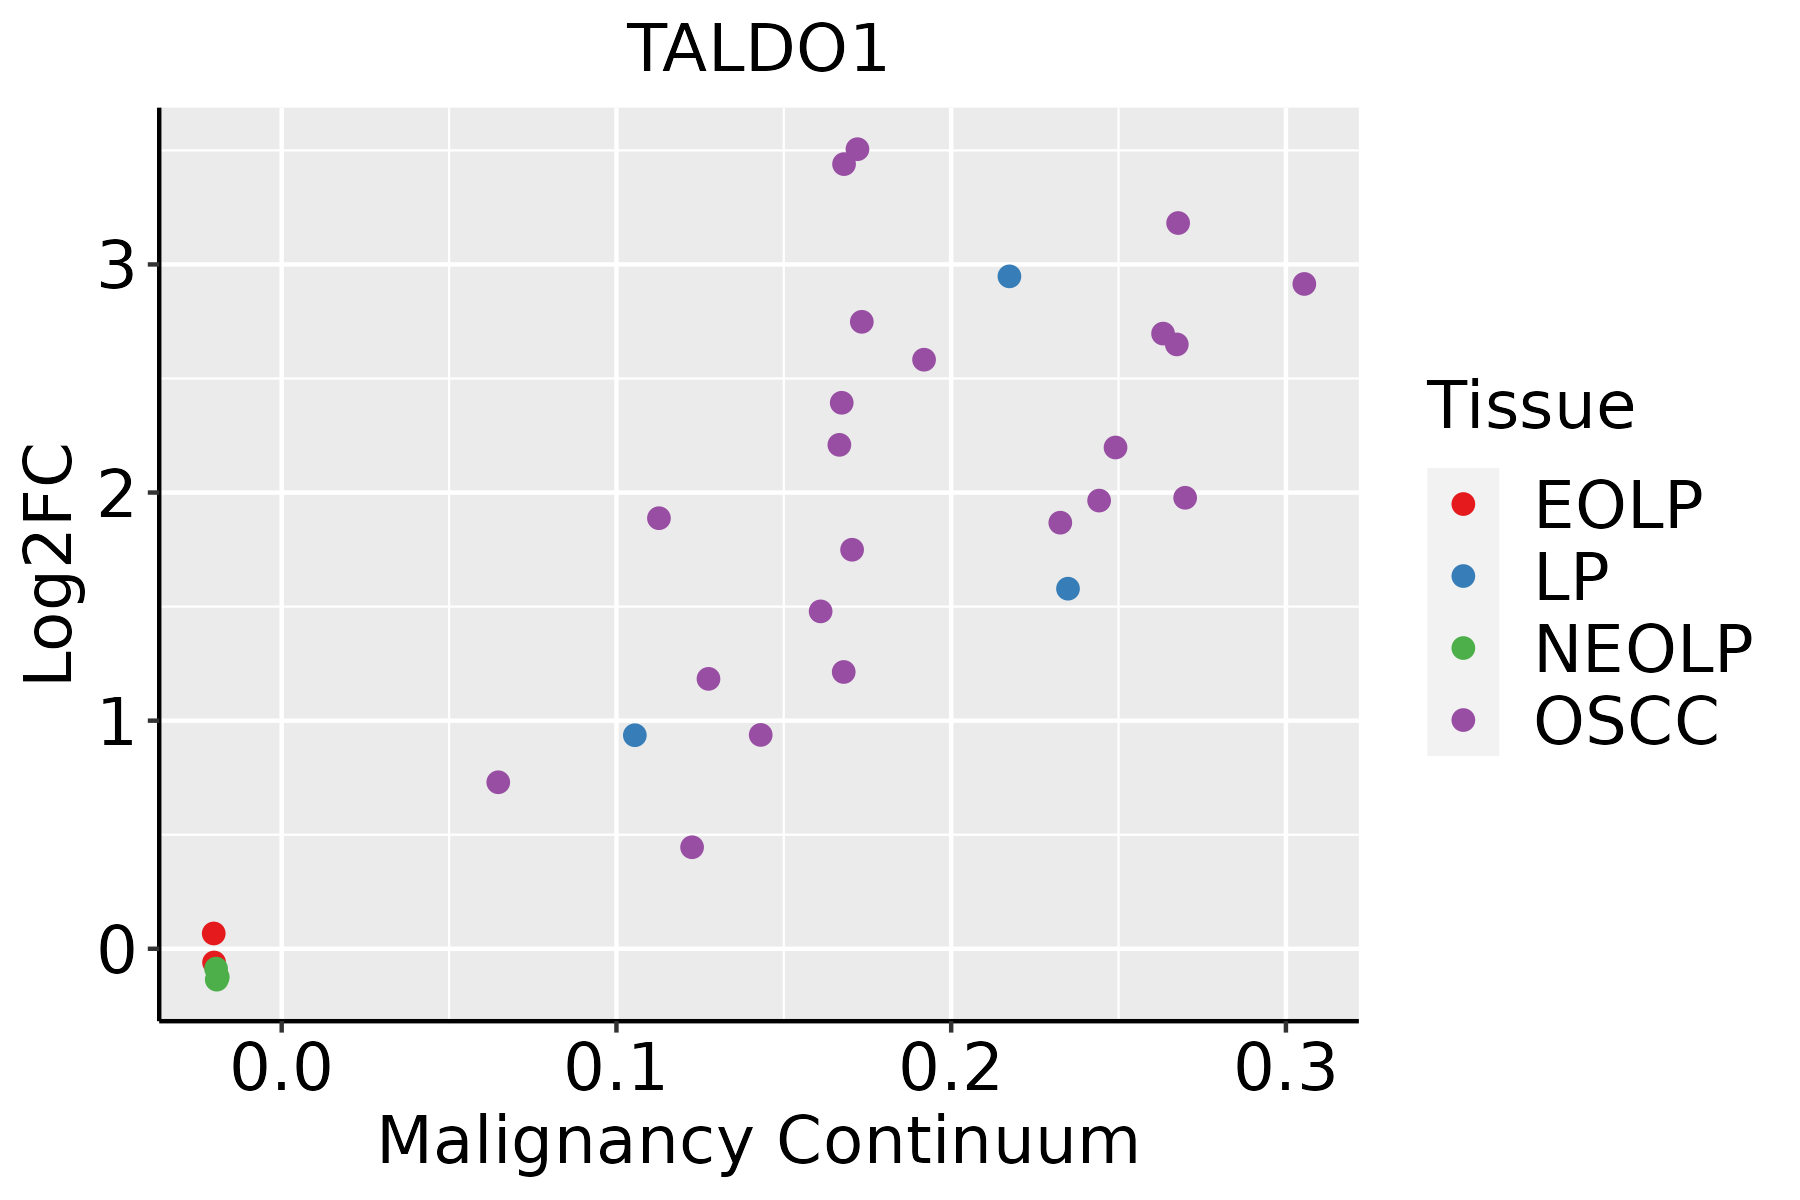 | EOLP: Erosive Oral lichen planus |
| LP: leukoplakia | ||
| NEOLP: Non-erosive oral lichen planus | ||
| OSCC: Oral squamous cell carcinoma | ||
| Prostate |  | BPH: Benign Prostatic Hyperplasia |
| Skin | 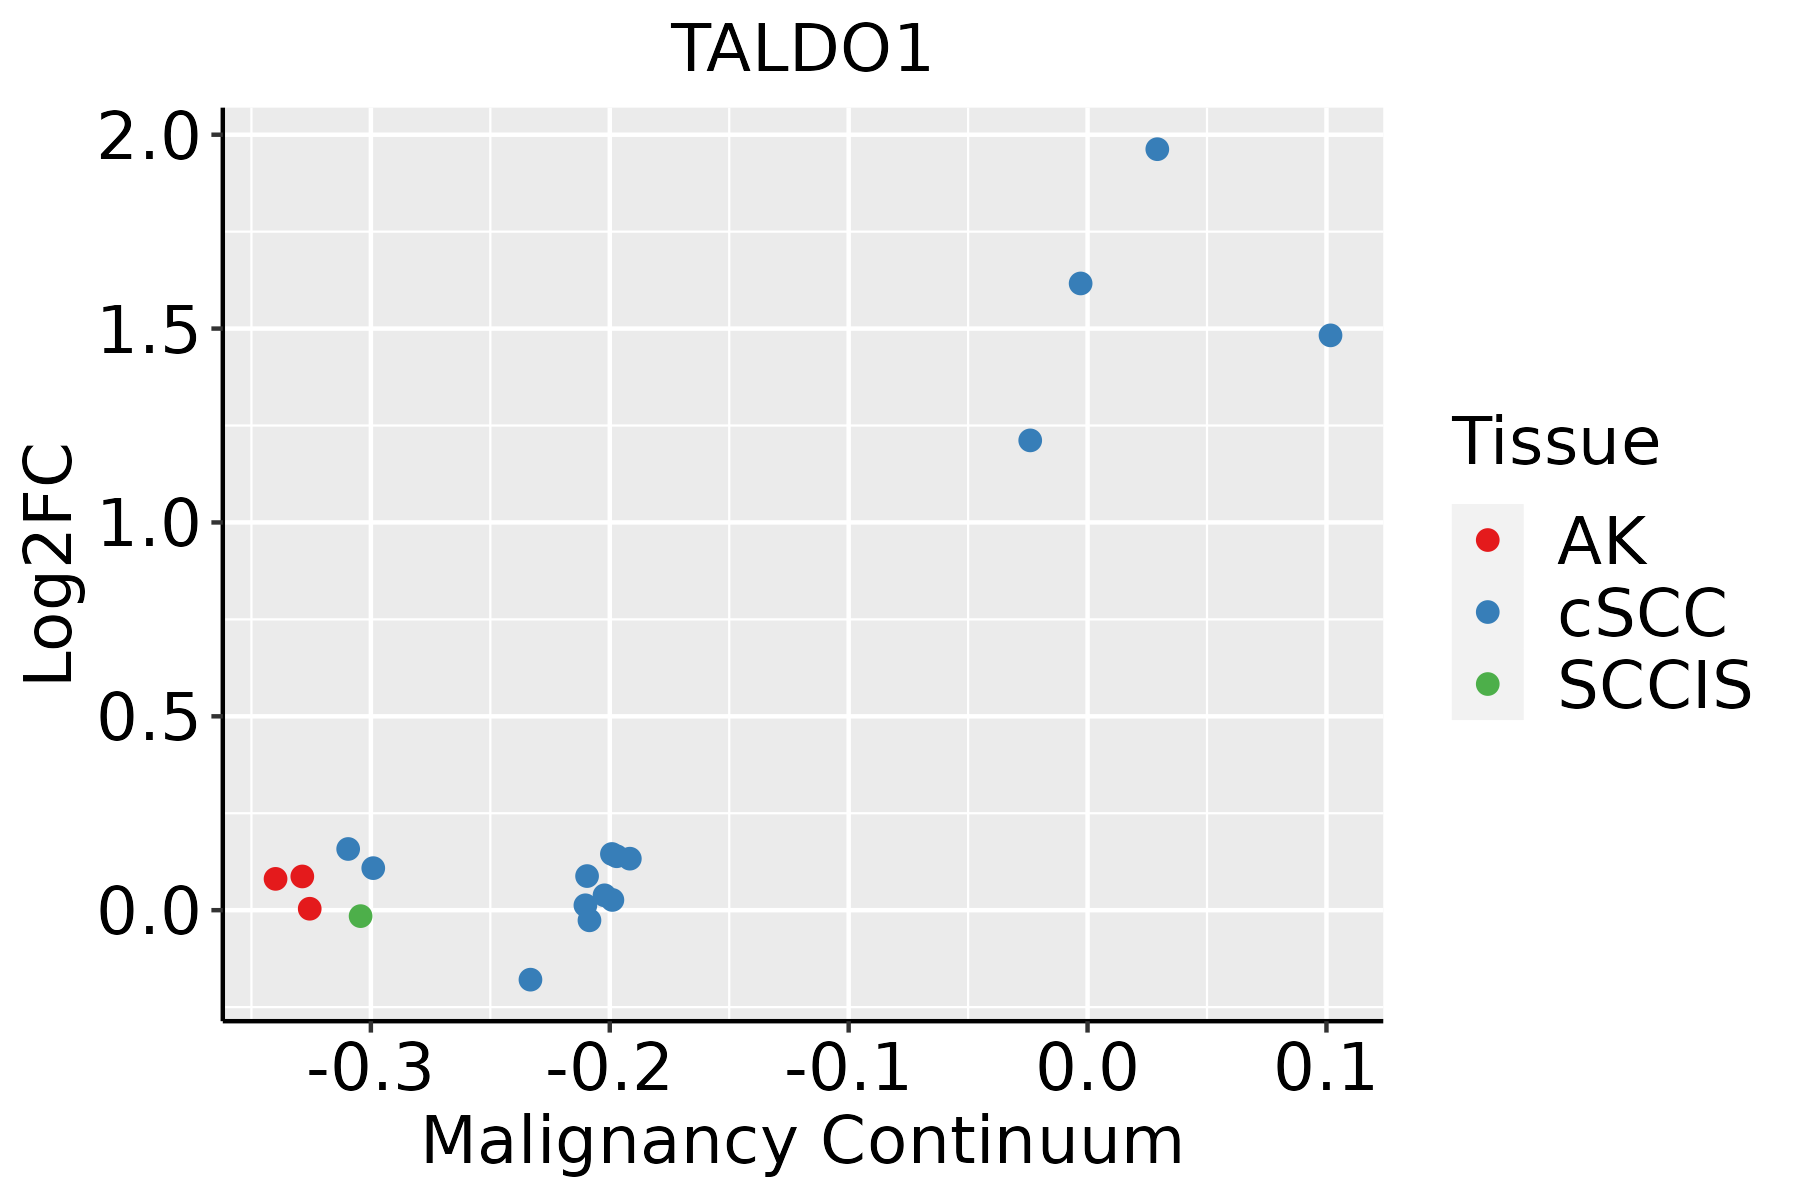 | AK: Actinic keratosis |
| cSCC: Cutaneous squamous cell carcinoma | ||
| SCCIS:squamous cell carcinoma in situ | ||
| Thyroid |  | ATC: Anaplastic thyroid cancer |
| HT: Hashimoto's thyroiditis | ||
| PTC: Papillary thyroid cancer |
| ∗log2FC in expression of this searched gene in stem-like cells from each diseased tissue sample relative to stem-like cells in normal samples in each tissue plotted against the malignancy continuum. Samples are colored based on if they are from different disease stage. |
Top |
Malignant transformation related pathway analysis |
| Find out the enriched GO biological processes and KEGG pathways involved in transition from healthy to precancer to cancer |
| Tissue | Disease Stage | Enriched GO biological Processes |
| Colorectum | AD |  |
| Colorectum | SER |  |
| Colorectum | MSS |  |
| Colorectum | MSI-H |  |
| Colorectum | FAP |  |
| ∗Top 15 enriched GO BP terms are showed in the bar plot of each disease state in each tissue. Each row represents a significant GO biological process which is colored according to the -log10(p.adjust). |
| Page: 1 2 3 4 5 6 7 8 9 |
| GO ID | Tissue | Disease Stage | Description | Gene Ratio | Bg Ratio | pvalue | p.adjust | Count |
| GO:00060918 | Breast | Precancer | generation of precursor metabolites and energy | 94/1080 | 490/18723 | 1.54e-25 | 1.64e-22 | 94 |
| GO:000609113 | Breast | IDC | generation of precursor metabolites and energy | 103/1434 | 490/18723 | 1.53e-21 | 1.74e-18 | 103 |
| GO:000609123 | Breast | DCIS | generation of precursor metabolites and energy | 103/1390 | 490/18723 | 1.46e-22 | 1.65e-19 | 103 |
| GO:00060919 | Cervix | CC | generation of precursor metabolites and energy | 105/2311 | 490/18723 | 7.40e-09 | 6.61e-07 | 105 |
| GO:0006091 | Colorectum | AD | generation of precursor metabolites and energy | 209/3918 | 490/18723 | 3.17e-28 | 6.61e-25 | 209 |
| GO:0006002 | Colorectum | AD | fructose 6-phosphate metabolic process | 7/3918 | 11/18723 | 2.59e-03 | 1.96e-02 | 7 |
| GO:0006081 | Colorectum | AD | cellular aldehyde metabolic process | 22/3918 | 60/18723 | 3.64e-03 | 2.60e-02 | 22 |
| GO:00060911 | Colorectum | SER | generation of precursor metabolites and energy | 168/2897 | 490/18723 | 1.39e-25 | 1.70e-22 | 168 |
| GO:00060912 | Colorectum | MSS | generation of precursor metabolites and energy | 186/3467 | 490/18723 | 1.14e-24 | 2.15e-21 | 186 |
| GO:00060811 | Colorectum | MSS | cellular aldehyde metabolic process | 21/3467 | 60/18723 | 1.81e-03 | 1.60e-02 | 21 |
| GO:00060913 | Colorectum | MSI-H | generation of precursor metabolites and energy | 93/1319 | 490/18723 | 7.35e-19 | 3.14e-16 | 93 |
| GO:00060812 | Colorectum | MSI-H | cellular aldehyde metabolic process | 13/1319 | 60/18723 | 2.27e-04 | 5.94e-03 | 13 |
| GO:000609110 | Endometrium | AEH | generation of precursor metabolites and energy | 121/2100 | 490/18723 | 1.65e-17 | 8.23e-15 | 121 |
| GO:000609115 | Endometrium | EEC | generation of precursor metabolites and energy | 125/2168 | 490/18723 | 3.76e-18 | 1.88e-15 | 125 |
| GO:000609120 | Esophagus | HGIN | generation of precursor metabolites and energy | 145/2587 | 490/18723 | 3.41e-20 | 2.04e-17 | 145 |
| GO:00060983 | Esophagus | HGIN | pentose-phosphate shunt | 7/2587 | 15/18723 | 2.22e-03 | 2.28e-02 | 7 |
| GO:00067403 | Esophagus | HGIN | NADPH regeneration | 7/2587 | 16/18723 | 3.47e-03 | 3.22e-02 | 7 |
| GO:0006091110 | Esophagus | ESCC | generation of precursor metabolites and energy | 331/8552 | 490/18723 | 3.86e-23 | 8.45e-21 | 331 |
| GO:00060818 | Esophagus | ESCC | cellular aldehyde metabolic process | 40/8552 | 60/18723 | 8.30e-04 | 4.28e-03 | 40 |
| GO:000674012 | Esophagus | ESCC | NADPH regeneration | 13/8552 | 16/18723 | 4.05e-03 | 1.62e-02 | 13 |
| Page: 1 2 3 4 |
| Pathway ID | Tissue | Disease Stage | Description | Gene Ratio | Bg Ratio | pvalue | p.adjust | qvalue | Count |
| hsa0120012 | Breast | Precancer | Carbon metabolism | 18/684 | 115/8465 | 4.79e-03 | 2.75e-02 | 2.11e-02 | 18 |
| hsa0120013 | Breast | Precancer | Carbon metabolism | 18/684 | 115/8465 | 4.79e-03 | 2.75e-02 | 2.11e-02 | 18 |
| hsa01200 | Colorectum | AD | Carbon metabolism | 55/2092 | 115/8465 | 5.53e-08 | 8.42e-07 | 5.37e-07 | 55 |
| hsa01230 | Colorectum | AD | Biosynthesis of amino acids | 28/2092 | 75/8465 | 9.99e-03 | 3.89e-02 | 2.48e-02 | 28 |
| hsa012001 | Colorectum | AD | Carbon metabolism | 55/2092 | 115/8465 | 5.53e-08 | 8.42e-07 | 5.37e-07 | 55 |
| hsa012301 | Colorectum | AD | Biosynthesis of amino acids | 28/2092 | 75/8465 | 9.99e-03 | 3.89e-02 | 2.48e-02 | 28 |
| hsa012002 | Colorectum | SER | Carbon metabolism | 40/1580 | 115/8465 | 2.77e-05 | 3.41e-04 | 2.47e-04 | 40 |
| hsa012302 | Colorectum | SER | Biosynthesis of amino acids | 23/1580 | 75/8465 | 8.11e-03 | 4.14e-02 | 3.01e-02 | 23 |
| hsa012003 | Colorectum | SER | Carbon metabolism | 40/1580 | 115/8465 | 2.77e-05 | 3.41e-04 | 2.47e-04 | 40 |
| hsa012303 | Colorectum | SER | Biosynthesis of amino acids | 23/1580 | 75/8465 | 8.11e-03 | 4.14e-02 | 3.01e-02 | 23 |
| hsa012004 | Colorectum | MSS | Carbon metabolism | 43/1875 | 115/8465 | 1.37e-04 | 1.17e-03 | 7.19e-04 | 43 |
| hsa012005 | Colorectum | MSS | Carbon metabolism | 43/1875 | 115/8465 | 1.37e-04 | 1.17e-03 | 7.19e-04 | 43 |
| hsa0120016 | Esophagus | HGIN | Carbon metabolism | 31/1383 | 115/8465 | 2.51e-03 | 2.10e-02 | 1.67e-02 | 31 |
| hsa012306 | Esophagus | HGIN | Biosynthesis of amino acids | 21/1383 | 75/8465 | 7.38e-03 | 4.63e-02 | 3.68e-02 | 21 |
| hsa0120017 | Esophagus | HGIN | Carbon metabolism | 31/1383 | 115/8465 | 2.51e-03 | 2.10e-02 | 1.67e-02 | 31 |
| hsa0123013 | Esophagus | HGIN | Biosynthesis of amino acids | 21/1383 | 75/8465 | 7.38e-03 | 4.63e-02 | 3.68e-02 | 21 |
| hsa0120023 | Esophagus | ESCC | Carbon metabolism | 79/4205 | 115/8465 | 2.50e-05 | 1.21e-04 | 6.22e-05 | 79 |
| hsa0123023 | Esophagus | ESCC | Biosynthesis of amino acids | 49/4205 | 75/8465 | 4.35e-03 | 1.12e-02 | 5.74e-03 | 49 |
| hsa0120033 | Esophagus | ESCC | Carbon metabolism | 79/4205 | 115/8465 | 2.50e-05 | 1.21e-04 | 6.22e-05 | 79 |
| hsa0123033 | Esophagus | ESCC | Biosynthesis of amino acids | 49/4205 | 75/8465 | 4.35e-03 | 1.12e-02 | 5.74e-03 | 49 |
| Page: 1 2 |
Top |
Cell-cell communication analysis |
| Identification of potential cell-cell interactions between two cell types and their ligand-receptor pairs for different disease states |
| Ligand | Receptor | LRpair | Pathway | Tissue | Disease Stage |
| Page: 1 |
Top |
Single-cell gene regulatory network inference analysis |
| Find out the significant the regulons (TFs) and the target genes of each regulon across cell types for different disease states |
| TF | Cell Type | Tissue | Disease Stage | Target Gene | RSS | Regulon Activity |
| ∗The dot plots of a searched regulon are shown for all cell subpopulations in each disease state of each tissue based on the regulon specific score inferred using pySCENIC and by calculating the average expression. |
| Page: 1 |
Top |
Somatic mutation of malignant transformation related genes |
| Annotation of somatic variants for genes involved in malignant transformation |
| Hugo Symbol | Variant Class | Variant Classification | dbSNP RS | HGVSc | HGVSp | HGVSp Short | SWISSPROT | BIOTYPE | SIFT | PolyPhen | Tumor Sample Barcode | Tissue | Histology | Sex | Age | Stage | Therapy Types | Drugs | Outcome |
| TALDO1 | deletion | In_Frame_Del | rs760405582 | c.512_514delCCT | p.Ser171del | p.S171del | P37837 | protein_coding | TCGA-BH-A0DH-01 | Breast | breast invasive carcinoma | Female | <65 | I/II | Chemotherapy | cyclophosphamide | SD | ||
| TALDO1 | SNV | Missense_Mutation | c.499N>G | p.Thr167Ala | p.T167A | P37837 | protein_coding | deleterious(0.02) | possibly_damaging(0.864) | TCGA-A6-A56B-01 | Colorectum | colon adenocarcinoma | Male | <65 | III/IV | Chemotherapy | fluorouracil | PD | |
| TALDO1 | SNV | Missense_Mutation | c.856N>C | p.Lys286Gln | p.K286Q | P37837 | protein_coding | deleterious(0.05) | benign(0.272) | TCGA-AA-A010-01 | Colorectum | colon adenocarcinoma | Female | <65 | I/II | Chemotherapy | folinic | CR | |
| TALDO1 | SNV | Missense_Mutation | rs764703431 | c.350N>T | p.Ala117Val | p.A117V | P37837 | protein_coding | deleterious(0.04) | possibly_damaging(0.731) | TCGA-F4-6856-01 | Colorectum | colon adenocarcinoma | Male | <65 | I/II | Ancillary | leucovorin | CR |
| TALDO1 | SNV | Missense_Mutation | novel | c.485T>C | p.Ile162Thr | p.I162T | P37837 | protein_coding | deleterious(0) | probably_damaging(0.957) | TCGA-G4-6586-01 | Colorectum | colon adenocarcinoma | Female | >=65 | I/II | Unknown | Unknown | SD |
| TALDO1 | SNV | Missense_Mutation | rs773023043 | c.716N>A | p.Arg239His | p.R239H | P37837 | protein_coding | deleterious(0.03) | probably_damaging(0.98) | TCGA-WS-AB45-01 | Colorectum | colon adenocarcinoma | Female | <65 | I/II | Unknown | Unknown | SD |
| TALDO1 | SNV | Missense_Mutation | rs778205812 | c.299N>T | p.Pro100Leu | p.P100L | P37837 | protein_coding | deleterious(0.04) | possibly_damaging(0.834) | TCGA-G5-6233-01 | Colorectum | rectum adenocarcinoma | Male | >=65 | III/IV | Chemotherapy | 5-fluorouracil | PD |
| TALDO1 | SNV | Missense_Mutation | c.1002G>T | p.Glu334Asp | p.E334D | P37837 | protein_coding | tolerated_low_confidence(0.21) | benign(0.001) | TCGA-A5-A0G1-01 | Endometrium | uterine corpus endometrioid carcinoma | Female | >=65 | I/II | Unknown | Unknown | SD | |
| TALDO1 | SNV | Missense_Mutation | novel | c.727N>A | p.Glu243Lys | p.E243K | P37837 | protein_coding | deleterious(0) | probably_damaging(0.919) | TCGA-A5-A0G2-01 | Endometrium | uterine corpus endometrioid carcinoma | Female | <65 | III/IV | Unknown | Unknown | SD |
| TALDO1 | SNV | Missense_Mutation | rs773023043 | c.716N>A | p.Arg239His | p.R239H | P37837 | protein_coding | deleterious(0.03) | probably_damaging(0.98) | TCGA-A5-A0GI-01 | Endometrium | uterine corpus endometrioid carcinoma | Female | <65 | I/II | Unknown | Unknown | SD |
| Page: 1 2 3 4 |
Top |
Related drugs of malignant transformation related genes |
| Identification of chemicals and drugs interact with genes involved in malignant transfromation |
| (DGIdb 4.0) |
| Entrez ID | Symbol | Category | Interaction Types | Drug Claim Name | Drug Name | PMIDs |
| Page: 1 |

Copyright 2023-Present -The University of Texas Health Science Center at Houston |