
|
|||||
|
 | |
| |
| |
| |
| |
| |
|
Gene: TAGAP |
Gene summary for TAGAP |
| Gene information | Species | Human | Gene symbol | TAGAP | Gene ID | 117289 |
| Gene name | T cell activation RhoGTPase activating protein | |
| Gene Alias | ARHGAP47 | |
| Cytomap | 6q25.3 | |
| Gene Type | protein-coding | GO ID | GO:0007154 | UniProtAcc | Q8N103 |
Top |
Malignant transformation analysis |
| Identification of the aberrant gene expression in precancerous and cancerous lesions by comparing the gene expression of stem-like cells in diseased tissues with normal stem cells |
| Entrez ID | Symbol | Replicates | Species | Organ | Tissue | Adj P-value | Log2FC | Malignancy |
| 117289 | TAGAP | GSM5353216_PA_PB1A_Pool_1_3_S50_L002 | Human | Prostate | Tumor | 1.29e-04 | 6.42e-01 | 0.159 |
| 117289 | TAGAP | GSM5353221_PA_PB2A_Pool_1_3_S25_L001 | Human | Prostate | Tumor | 1.53e-03 | 2.85e-01 | 0.1633 |
| 117289 | TAGAP | GSM5353224_PA_PR5186_Pool_1_2_3_S27_L001 | Human | Prostate | Tumor | 1.89e-05 | 3.75e-01 | 0.1621 |
| 117289 | TAGAP | GSM5353226_PA_PR5196-2_Pool_1_2_3_S54_L002 | Human | Prostate | Tumor | 2.91e-04 | 6.30e-01 | 0.159 |
| Page: 1 |
| Tissue | Expression Dynamics | Abbreviation |
| Prostate | 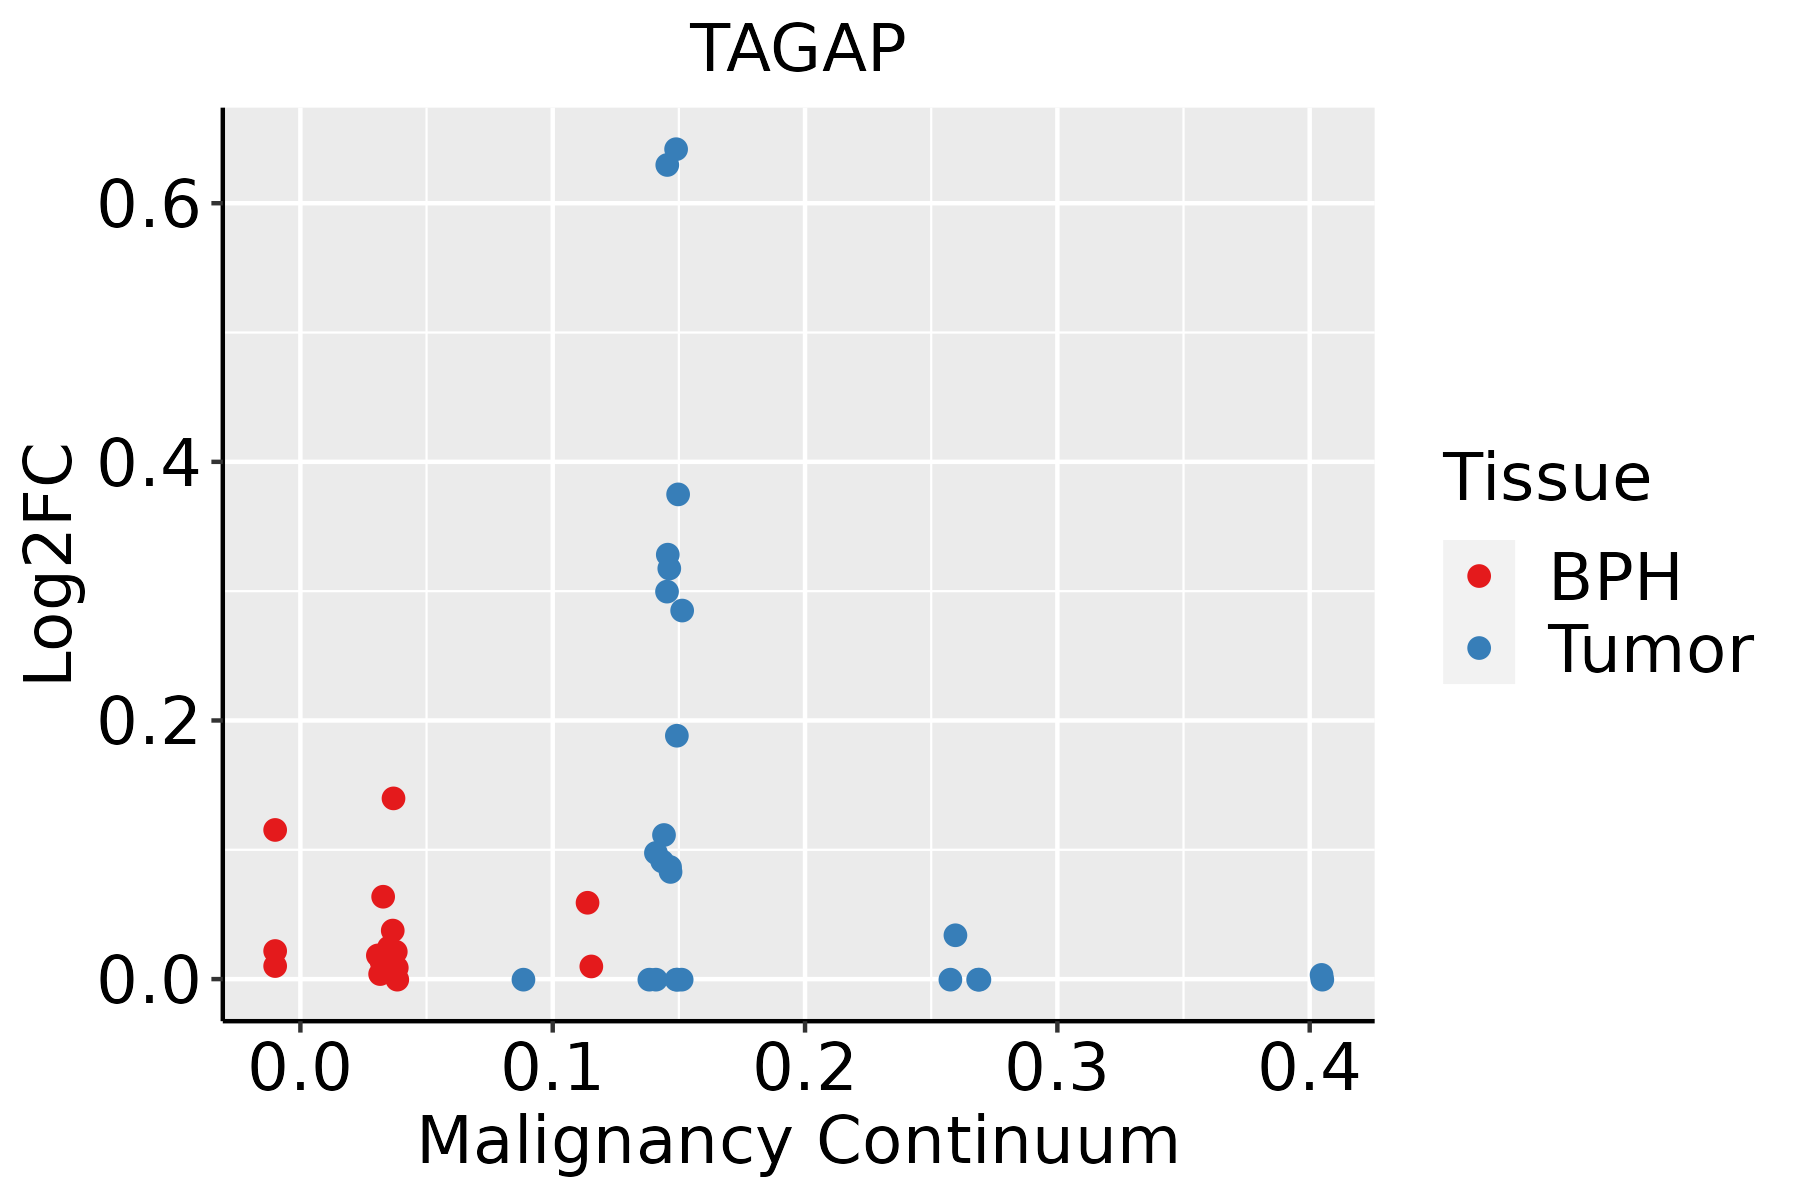 | BPH: Benign Prostatic Hyperplasia |
| ∗log2FC in expression of this searched gene in stem-like cells from each diseased tissue sample relative to stem-like cells in normal samples in each tissue plotted against the malignancy continuum. Samples are colored based on if they are from different disease stage. |
Top |
Malignant transformation related pathway analysis |
| Find out the enriched GO biological processes and KEGG pathways involved in transition from healthy to precancer to cancer |
| Tissue | Disease Stage | Enriched GO biological Processes |
| Colorectum | AD |  |
| Colorectum | SER |  |
| Colorectum | MSS |  |
| Colorectum | MSI-H |  |
| Colorectum | FAP |  |
| ∗Top 15 enriched GO BP terms are showed in the bar plot of each disease state in each tissue. Each row represents a significant GO biological process which is colored according to the -log10(p.adjust). |
| Page: 1 2 3 4 5 6 7 8 9 |
| GO ID | Tissue | Disease Stage | Description | Gene Ratio | Bg Ratio | pvalue | p.adjust | Count |
| GO:005105613 | Prostate | Tumor | regulation of small GTPase mediated signal transduction | 80/3246 | 302/18723 | 3.96e-05 | 4.57e-04 | 80 |
| Page: 1 |
| Pathway ID | Tissue | Disease Stage | Description | Gene Ratio | Bg Ratio | pvalue | p.adjust | qvalue | Count |
| Page: 1 |
Top |
Cell-cell communication analysis |
| Identification of potential cell-cell interactions between two cell types and their ligand-receptor pairs for different disease states |
| Ligand | Receptor | LRpair | Pathway | Tissue | Disease Stage |
| Page: 1 |
Top |
Single-cell gene regulatory network inference analysis |
| Find out the significant the regulons (TFs) and the target genes of each regulon across cell types for different disease states |
| TF | Cell Type | Tissue | Disease Stage | Target Gene | RSS | Regulon Activity |
| ∗The dot plots of a searched regulon are shown for all cell subpopulations in each disease state of each tissue based on the regulon specific score inferred using pySCENIC and by calculating the average expression. |
| Page: 1 |
Top |
Somatic mutation of malignant transformation related genes |
| Annotation of somatic variants for genes involved in malignant transformation |
| Hugo Symbol | Variant Class | Variant Classification | dbSNP RS | HGVSc | HGVSp | HGVSp Short | SWISSPROT | BIOTYPE | SIFT | PolyPhen | Tumor Sample Barcode | Tissue | Histology | Sex | Age | Stage | Therapy Types | Drugs | Outcome |
| TAGAP | SNV | Missense_Mutation | rs777270446 | c.2095G>A | p.Glu699Lys | p.E699K | Q8N103 | protein_coding | deleterious(0.01) | probably_damaging(0.919) | TCGA-AC-A23H-01 | Breast | breast invasive carcinoma | Female | >=65 | I/II | Unknown | Unknown | PD |
| TAGAP | SNV | Missense_Mutation | c.1255G>A | p.Glu419Lys | p.E419K | Q8N103 | protein_coding | tolerated(0.32) | benign(0.042) | TCGA-AC-A23H-01 | Breast | breast invasive carcinoma | Female | >=65 | I/II | Unknown | Unknown | PD | |
| TAGAP | SNV | Missense_Mutation | rs764365414 | c.1700G>A | p.Arg567His | p.R567H | Q8N103 | protein_coding | tolerated(0.14) | benign(0.197) | TCGA-AC-A5XU-01 | Breast | breast invasive carcinoma | Female | >=65 | I/II | Hormone Therapy | letrozole | SD |
| TAGAP | insertion | In_Frame_Ins | novel | c.363_364insAAAACCAGAGGGTGCCCTGGACTTTTGAATTTT | p.Ile121_Phe122insLysThrArgGlyCysProGlyLeuLeuAsnPhe | p.I121_F122insKTRGCPGLLNF | Q8N103 | protein_coding | TCGA-A2-A0CT-01 | Breast | breast invasive carcinoma | Female | >=65 | I/II | Chemotherapy | cytoxan | SD | ||
| TAGAP | insertion | Frame_Shift_Ins | novel | c.2069_2070insTATAACAAATGTAAAATTTCTCATTTCTAGTGAATTAAACTTC | p.Glu690AspfsTer30 | p.E690Dfs*30 | Q8N103 | protein_coding | TCGA-A2-A0D4-01 | Breast | breast invasive carcinoma | Female | <65 | I/II | Chemotherapy | adriamycin | SD | ||
| TAGAP | insertion | Frame_Shift_Ins | novel | c.1348_1349insAC | p.Val450AspfsTer72 | p.V450Dfs*72 | Q8N103 | protein_coding | TCGA-A8-A0A4-01 | Breast | breast invasive carcinoma | Female | >=65 | I/II | Hormone Therapy | tamoxiphen | CR | ||
| TAGAP | insertion | In_Frame_Ins | novel | c.1347_1348insCTGAGGACCGTCTCCGAGTCCGTGCAGAGGAATAAGCGG | p.Ser449_Val450insLeuArgThrValSerGluSerValGlnArgAsnLysArg | p.S449_V450insLRTVSESVQRNKR | Q8N103 | protein_coding | TCGA-A8-A0A4-01 | Breast | breast invasive carcinoma | Female | >=65 | I/II | Hormone Therapy | tamoxiphen | CR | ||
| TAGAP | SNV | Missense_Mutation | novel | c.409G>A | p.Glu137Lys | p.E137K | Q8N103 | protein_coding | deleterious(0.01) | possibly_damaging(0.724) | TCGA-C5-A902-01 | Cervix | cervical & endocervical cancer | Female | <65 | I/II | Chemotherapy | cisplatin | SD |
| TAGAP | SNV | Missense_Mutation | c.2007N>T | p.Gln669His | p.Q669H | Q8N103 | protein_coding | tolerated(0.15) | benign(0.001) | TCGA-FU-A3HZ-01 | Cervix | cervical & endocervical cancer | Female | <65 | I/II | Chemotherapy | cisplatin | CR | |
| TAGAP | SNV | Missense_Mutation | c.1452C>A | p.Phe484Leu | p.F484L | Q8N103 | protein_coding | tolerated(0.06) | benign(0.07) | TCGA-5M-AATE-01 | Colorectum | colon adenocarcinoma | Male | >=65 | I/II | Unknown | Unknown | PD |
| Page: 1 2 3 4 5 6 7 8 9 |
Top |
Related drugs of malignant transformation related genes |
| Identification of chemicals and drugs interact with genes involved in malignant transfromation |
| (DGIdb 4.0) |
| Entrez ID | Symbol | Category | Interaction Types | Drug Claim Name | Drug Name | PMIDs |
| Page: 1 |

Copyright 2023-Present -The University of Texas Health Science Center at Houston |