
|
|||||
|
 | |
| |
| |
| |
| |
| |
|
Gene: TAF9B |
Gene summary for TAF9B |
| Gene information | Species | Human | Gene symbol | TAF9B | Gene ID | 51616 |
| Gene name | TATA-box binding protein associated factor 9b | |
| Gene Alias | DN-7 | |
| Cytomap | Xq21.1 | |
| Gene Type | protein-coding | GO ID | GO:0000122 | UniProtAcc | Q9HBM6 |
Top |
Malignant transformation analysis |
| Identification of the aberrant gene expression in precancerous and cancerous lesions by comparing the gene expression of stem-like cells in diseased tissues with normal stem cells |
| Entrez ID | Symbol | Replicates | Species | Organ | Tissue | Adj P-value | Log2FC | Malignancy |
| 51616 | TAF9B | LZE4T | Human | Esophagus | ESCC | 1.05e-07 | 2.50e-01 | 0.0811 |
| 51616 | TAF9B | LZE8T | Human | Esophagus | ESCC | 9.93e-04 | 1.00e-01 | 0.067 |
| 51616 | TAF9B | LZE24T | Human | Esophagus | ESCC | 9.70e-24 | 5.52e-01 | 0.0596 |
| 51616 | TAF9B | P2T-E | Human | Esophagus | ESCC | 1.27e-29 | 4.56e-01 | 0.1177 |
| 51616 | TAF9B | P4T-E | Human | Esophagus | ESCC | 1.25e-16 | 3.08e-01 | 0.1323 |
| 51616 | TAF9B | P5T-E | Human | Esophagus | ESCC | 7.27e-11 | 2.21e-01 | 0.1327 |
| 51616 | TAF9B | P8T-E | Human | Esophagus | ESCC | 5.72e-12 | 2.22e-01 | 0.0889 |
| 51616 | TAF9B | P9T-E | Human | Esophagus | ESCC | 3.43e-06 | 8.88e-02 | 0.1131 |
| 51616 | TAF9B | P10T-E | Human | Esophagus | ESCC | 5.15e-18 | 2.54e-01 | 0.116 |
| 51616 | TAF9B | P11T-E | Human | Esophagus | ESCC | 2.14e-10 | 3.74e-01 | 0.1426 |
| 51616 | TAF9B | P12T-E | Human | Esophagus | ESCC | 5.71e-24 | 4.24e-01 | 0.1122 |
| 51616 | TAF9B | P15T-E | Human | Esophagus | ESCC | 4.26e-05 | 1.36e-01 | 0.1149 |
| 51616 | TAF9B | P16T-E | Human | Esophagus | ESCC | 2.75e-12 | 1.72e-01 | 0.1153 |
| 51616 | TAF9B | P20T-E | Human | Esophagus | ESCC | 3.45e-11 | 2.30e-01 | 0.1124 |
| 51616 | TAF9B | P21T-E | Human | Esophagus | ESCC | 4.46e-10 | 1.09e-01 | 0.1617 |
| 51616 | TAF9B | P22T-E | Human | Esophagus | ESCC | 4.43e-13 | 2.36e-01 | 0.1236 |
| 51616 | TAF9B | P23T-E | Human | Esophagus | ESCC | 2.59e-22 | 5.04e-01 | 0.108 |
| 51616 | TAF9B | P24T-E | Human | Esophagus | ESCC | 4.04e-13 | 2.88e-01 | 0.1287 |
| 51616 | TAF9B | P26T-E | Human | Esophagus | ESCC | 9.63e-12 | 2.98e-01 | 0.1276 |
| 51616 | TAF9B | P27T-E | Human | Esophagus | ESCC | 6.11e-08 | 2.15e-01 | 0.1055 |
| Page: 1 2 3 |
| Tissue | Expression Dynamics | Abbreviation |
| Esophagus | 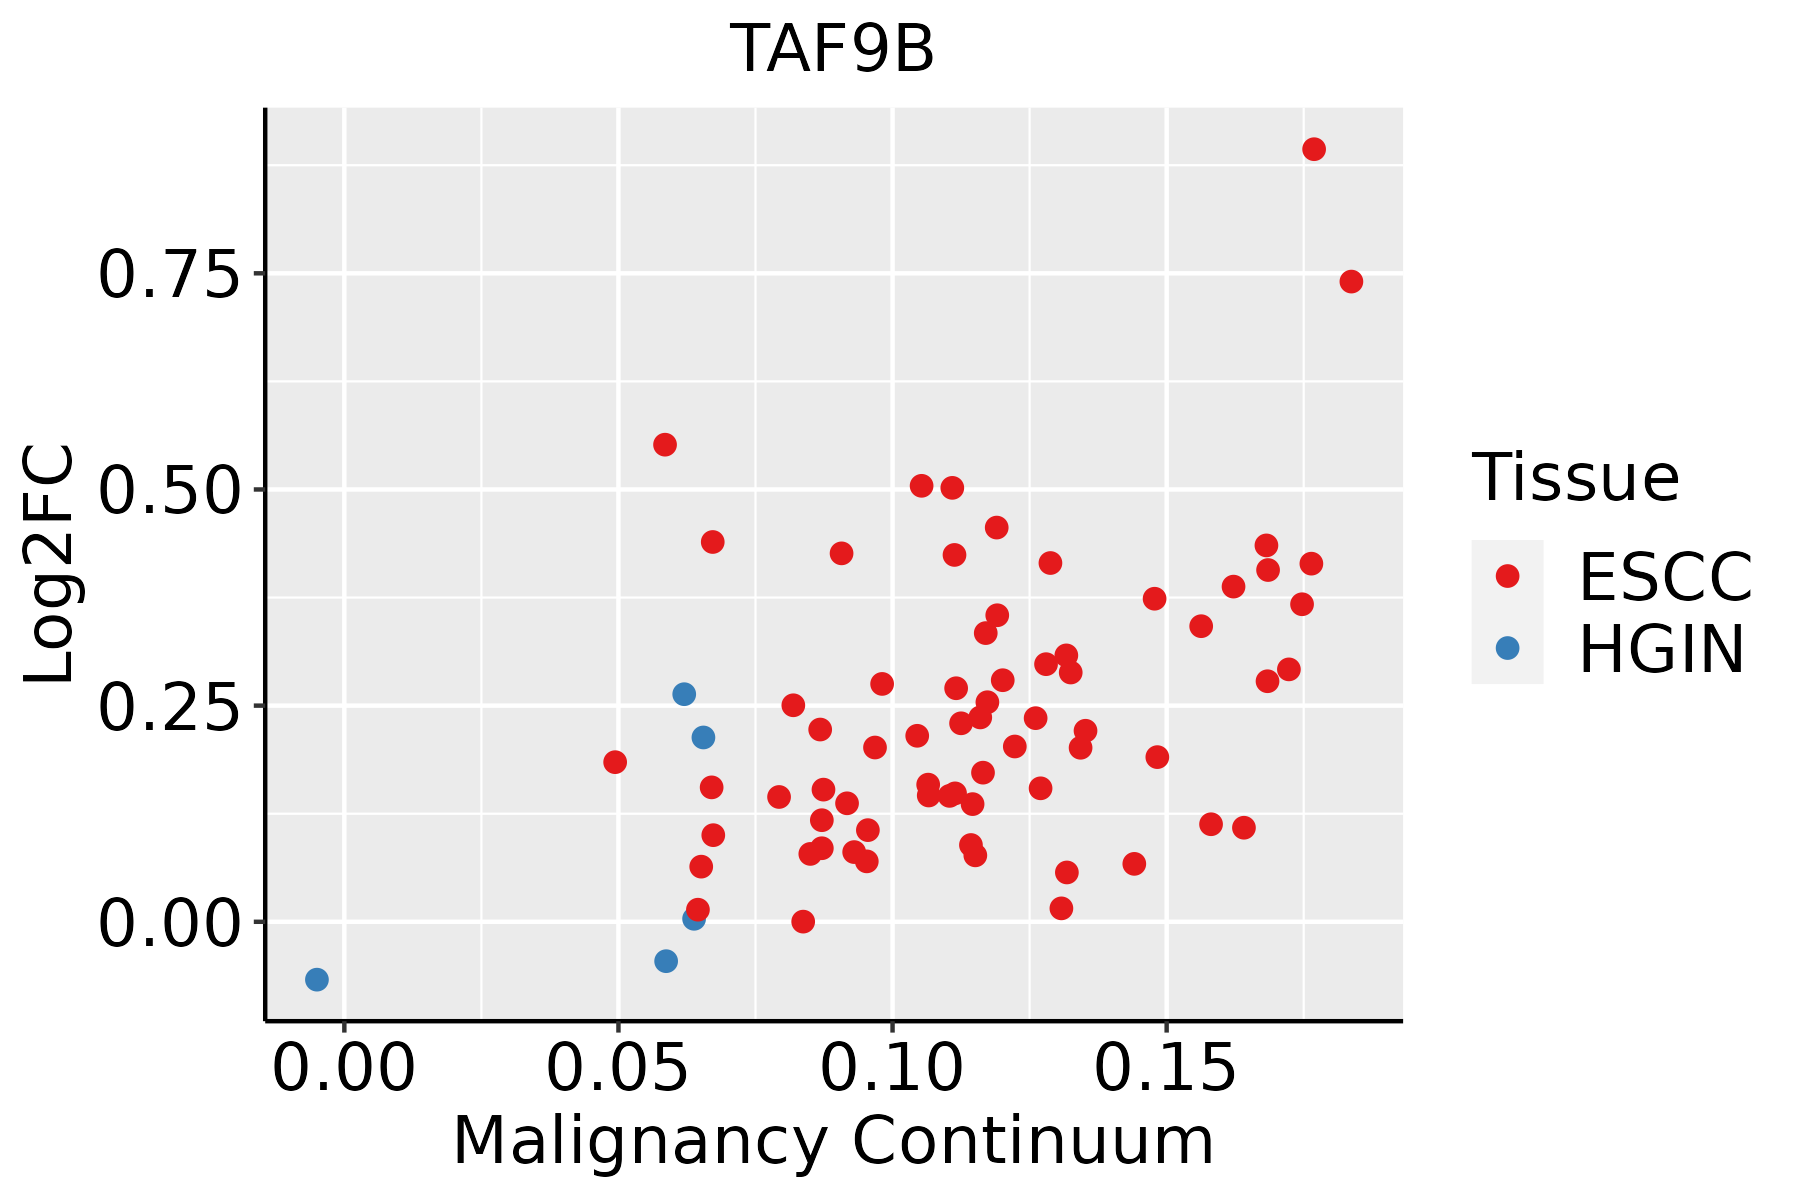 | ESCC: Esophageal squamous cell carcinoma |
| HGIN: High-grade intraepithelial neoplasias | ||
| LGIN: Low-grade intraepithelial neoplasias | ||
| Oral Cavity |  | EOLP: Erosive Oral lichen planus |
| LP: leukoplakia | ||
| NEOLP: Non-erosive oral lichen planus | ||
| OSCC: Oral squamous cell carcinoma |
| ∗log2FC in expression of this searched gene in stem-like cells from each diseased tissue sample relative to stem-like cells in normal samples in each tissue plotted against the malignancy continuum. Samples are colored based on if they are from different disease stage. |
Top |
Malignant transformation related pathway analysis |
| Find out the enriched GO biological processes and KEGG pathways involved in transition from healthy to precancer to cancer |
| Tissue | Disease Stage | Enriched GO biological Processes |
| Colorectum | AD |  |
| Colorectum | SER |  |
| Colorectum | MSS |  |
| Colorectum | MSI-H |  |
| Colorectum | FAP |  |
| ∗Top 15 enriched GO BP terms are showed in the bar plot of each disease state in each tissue. Each row represents a significant GO biological process which is colored according to the -log10(p.adjust). |
| Page: 1 2 3 4 5 6 7 8 9 |
| GO ID | Tissue | Disease Stage | Description | Gene Ratio | Bg Ratio | pvalue | p.adjust | Count |
| GO:0097193111 | Esophagus | ESCC | intrinsic apoptotic signaling pathway | 222/8552 | 288/18723 | 5.87e-28 | 2.02e-25 | 222 |
| GO:0031647111 | Esophagus | ESCC | regulation of protein stability | 223/8552 | 298/18723 | 5.76e-25 | 1.52e-22 | 223 |
| GO:2001233111 | Esophagus | ESCC | regulation of apoptotic signaling pathway | 256/8552 | 356/18723 | 4.11e-24 | 1.04e-21 | 256 |
| GO:2001242111 | Esophagus | ESCC | regulation of intrinsic apoptotic signaling pathway | 128/8552 | 164/18723 | 1.75e-17 | 1.50e-15 | 128 |
| GO:2001234111 | Esophagus | ESCC | negative regulation of apoptotic signaling pathway | 161/8552 | 224/18723 | 1.24e-15 | 8.09e-14 | 161 |
| GO:0050821111 | Esophagus | ESCC | protein stabilization | 140/8552 | 191/18723 | 6.50e-15 | 3.61e-13 | 140 |
| GO:0072331111 | Esophagus | ESCC | signal transduction by p53 class mediator | 121/8552 | 163/18723 | 9.61e-14 | 4.69e-12 | 121 |
| GO:2001243111 | Esophagus | ESCC | negative regulation of intrinsic apoptotic signaling pathway | 78/8552 | 98/18723 | 5.50e-12 | 2.10e-10 | 78 |
| GO:0008630110 | Esophagus | ESCC | intrinsic apoptotic signaling pathway in response to DNA damage | 78/8552 | 99/18723 | 1.43e-11 | 5.08e-10 | 78 |
| GO:0016049110 | Esophagus | ESCC | cell growth | 289/8552 | 482/18723 | 1.29e-10 | 3.77e-09 | 289 |
| GO:2001020110 | Esophagus | ESCC | regulation of response to DNA damage stimulus | 145/8552 | 219/18723 | 5.97e-10 | 1.50e-08 | 145 |
| GO:000155819 | Esophagus | ESCC | regulation of cell growth | 248/8552 | 414/18723 | 2.97e-09 | 6.45e-08 | 248 |
| GO:1901796111 | Esophagus | ESCC | regulation of signal transduction by p53 class mediator | 70/8552 | 93/18723 | 5.69e-09 | 1.18e-07 | 70 |
| GO:0042771110 | Esophagus | ESCC | intrinsic apoptotic signaling pathway in response to DNA damage by p53 class mediator | 38/8552 | 43/18723 | 5.75e-09 | 1.18e-07 | 38 |
| GO:0072332111 | Esophagus | ESCC | intrinsic apoptotic signaling pathway by p53 class mediator | 59/8552 | 76/18723 | 1.22e-08 | 2.42e-07 | 59 |
| GO:000635211 | Esophagus | ESCC | DNA-templated transcription, initiation | 86/8552 | 130/18723 | 1.88e-06 | 2.19e-05 | 86 |
| GO:19022298 | Esophagus | ESCC | regulation of intrinsic apoptotic signaling pathway in response to DNA damage | 28/8552 | 36/18723 | 8.62e-05 | 6.22e-04 | 28 |
| GO:003030710 | Esophagus | ESCC | positive regulation of cell growth | 100/8552 | 166/18723 | 1.07e-04 | 7.55e-04 | 100 |
| GO:200102112 | Esophagus | ESCC | negative regulation of response to DNA damage stimulus | 54/8552 | 81/18723 | 1.09e-04 | 7.64e-04 | 54 |
| GO:19022304 | Esophagus | ESCC | negative regulation of intrinsic apoptotic signaling pathway in response to DNA damage | 23/8552 | 29/18723 | 2.25e-04 | 1.40e-03 | 23 |
| Page: 1 2 3 |
| Pathway ID | Tissue | Disease Stage | Description | Gene Ratio | Bg Ratio | pvalue | p.adjust | qvalue | Count |
| hsa030222 | Esophagus | ESCC | Basal transcription factors | 35/4205 | 45/8465 | 1.01e-04 | 4.06e-04 | 2.08e-04 | 35 |
| hsa0302211 | Esophagus | ESCC | Basal transcription factors | 35/4205 | 45/8465 | 1.01e-04 | 4.06e-04 | 2.08e-04 | 35 |
| hsa03022 | Oral cavity | OSCC | Basal transcription factors | 28/3704 | 45/8465 | 9.53e-03 | 2.11e-02 | 1.08e-02 | 28 |
| hsa030221 | Oral cavity | OSCC | Basal transcription factors | 28/3704 | 45/8465 | 9.53e-03 | 2.11e-02 | 1.08e-02 | 28 |
| Page: 1 |
Top |
Cell-cell communication analysis |
| Identification of potential cell-cell interactions between two cell types and their ligand-receptor pairs for different disease states |
| Ligand | Receptor | LRpair | Pathway | Tissue | Disease Stage |
| Page: 1 |
Top |
Single-cell gene regulatory network inference analysis |
| Find out the significant the regulons (TFs) and the target genes of each regulon across cell types for different disease states |
| TF | Cell Type | Tissue | Disease Stage | Target Gene | RSS | Regulon Activity |
| ∗The dot plots of a searched regulon are shown for all cell subpopulations in each disease state of each tissue based on the regulon specific score inferred using pySCENIC and by calculating the average expression. |
| Page: 1 |
Top |
Somatic mutation of malignant transformation related genes |
| Annotation of somatic variants for genes involved in malignant transformation |
| Hugo Symbol | Variant Class | Variant Classification | dbSNP RS | HGVSc | HGVSp | HGVSp Short | SWISSPROT | BIOTYPE | SIFT | PolyPhen | Tumor Sample Barcode | Tissue | Histology | Sex | Age | Stage | Therapy Types | Drugs | Outcome |
| TAF9B | SNV | Missense_Mutation | c.644N>C | p.Gly215Ala | p.G215A | Q9HBM6 | protein_coding | tolerated(0.15) | probably_damaging(0.992) | TCGA-B6-A0RS-01 | Breast | breast invasive carcinoma | Female | <65 | I/II | Unknown | Unknown | PD | |
| TAF9B | SNV | Missense_Mutation | c.595N>T | p.Pro199Ser | p.P199S | Q9HBM6 | protein_coding | tolerated(0.32) | probably_damaging(0.968) | TCGA-FU-A23K-01 | Cervix | cervical & endocervical cancer | Female | <65 | III/IV | Unknown | Unknown | SD | |
| TAF9B | SNV | Missense_Mutation | novel | c.707N>C | p.Asn236Thr | p.N236T | Q9HBM6 | protein_coding | tolerated(0.15) | benign(0) | TCGA-A6-2672-01 | Colorectum | colon adenocarcinoma | Female | >=65 | III/IV | Unknown | Unknown | SD |
| TAF9B | SNV | Missense_Mutation | c.176N>C | p.Ser59Thr | p.S59T | Q9HBM6 | protein_coding | tolerated(0.34) | benign(0.007) | TCGA-AA-3693-01 | Colorectum | colon adenocarcinoma | Female | >=65 | III/IV | Unknown | Unknown | SD | |
| TAF9B | SNV | Missense_Mutation | c.52N>T | p.Val18Leu | p.V18L | Q9HBM6 | protein_coding | deleterious(0.01) | probably_damaging(0.983) | TCGA-AA-3693-01 | Colorectum | colon adenocarcinoma | Female | >=65 | III/IV | Unknown | Unknown | SD | |
| TAF9B | SNV | Missense_Mutation | c.694N>A | p.Ala232Thr | p.A232T | Q9HBM6 | protein_coding | tolerated(0.4) | benign(0.011) | TCGA-CK-6746-01 | Colorectum | colon adenocarcinoma | Female | >=65 | I/II | Unknown | Unknown | SD | |
| TAF9B | SNV | Missense_Mutation | novel | c.148N>C | p.Ile50Leu | p.I50L | Q9HBM6 | protein_coding | deleterious(0.01) | possibly_damaging(0.768) | TCGA-AG-3892-01 | Colorectum | rectum adenocarcinoma | Female | <65 | I/II | Unknown | Unknown | SD |
| TAF9B | SNV | Missense_Mutation | c.199N>C | p.Asp67His | p.D67H | Q9HBM6 | protein_coding | deleterious(0) | probably_damaging(0.998) | TCGA-AG-A01J-01 | Colorectum | rectum adenocarcinoma | Female | <65 | I/II | Unknown | Unknown | SD | |
| TAF9B | SNV | Missense_Mutation | c.619N>A | p.Val207Ile | p.V207I | Q9HBM6 | protein_coding | deleterious(0.05) | possibly_damaging(0.785) | TCGA-A5-A0GN-01 | Endometrium | uterine corpus endometrioid carcinoma | Female | >=65 | I/II | Unknown | Unknown | SD | |
| TAF9B | SNV | Missense_Mutation | rs376084606 | c.680N>T | p.Ser227Leu | p.S227L | Q9HBM6 | protein_coding | tolerated(0.11) | possibly_damaging(0.885) | TCGA-AP-A056-01 | Endometrium | uterine corpus endometrioid carcinoma | Female | <65 | I/II | Unknown | Unknown | SD |
| Page: 1 2 3 4 |
Top |
Related drugs of malignant transformation related genes |
| Identification of chemicals and drugs interact with genes involved in malignant transfromation |
| (DGIdb 4.0) |
| Entrez ID | Symbol | Category | Interaction Types | Drug Claim Name | Drug Name | PMIDs |
| Page: 1 |

Copyright 2023-Present -The University of Texas Health Science Center at Houston |