
|
|||||
|
 | |
| |
| |
| |
| |
| |
|
Gene: TAF9 |
Gene summary for TAF9 |
| Gene information | Species | Human | Gene symbol | TAF9 | Gene ID | 6880 |
| Gene name | TATA-box binding protein associated factor 9 | |
| Gene Alias | MGC:5067 | |
| Cytomap | 5q13.2 | |
| Gene Type | protein-coding | GO ID | GO:0000491 | UniProtAcc | Q16594 |
Top |
Malignant transformation analysis |
| Identification of the aberrant gene expression in precancerous and cancerous lesions by comparing the gene expression of stem-like cells in diseased tissues with normal stem cells |
| Entrez ID | Symbol | Replicates | Species | Organ | Tissue | Adj P-value | Log2FC | Malignancy |
| 6880 | TAF9 | HTA11_78_2000001011 | Human | Colorectum | AD | 2.48e-07 | 2.20e-01 | -0.1088 |
| 6880 | TAF9 | HTA11_347_2000001011 | Human | Colorectum | AD | 1.56e-06 | 1.69e-01 | -0.1954 |
| 6880 | TAF9 | HTA11_83_2000001011 | Human | Colorectum | SER | 4.23e-03 | 1.63e-01 | -0.1526 |
| 6880 | TAF9 | HTA11_696_2000001011 | Human | Colorectum | AD | 1.82e-03 | 1.10e-01 | -0.1464 |
| 6880 | TAF9 | HTA11_2992_2000001011 | Human | Colorectum | SER | 1.51e-04 | 3.56e-01 | -0.1706 |
| 6880 | TAF9 | HTA11_7862_2000001011 | Human | Colorectum | AD | 1.96e-03 | 1.79e-01 | -0.0179 |
| 6880 | TAF9 | HTA11_866_3004761011 | Human | Colorectum | AD | 5.92e-06 | 1.77e-01 | 0.096 |
| 6880 | TAF9 | HTA11_7663_2000001011 | Human | Colorectum | SER | 6.81e-04 | 2.31e-01 | 0.0131 |
| 6880 | TAF9 | HTA11_10623_2000001011 | Human | Colorectum | AD | 3.04e-05 | 3.17e-01 | -0.0177 |
| 6880 | TAF9 | HTA11_6801_2000001011 | Human | Colorectum | SER | 1.19e-07 | 5.97e-01 | 0.0171 |
| 6880 | TAF9 | HTA11_7696_3000711011 | Human | Colorectum | AD | 8.44e-12 | 2.41e-01 | 0.0674 |
| 6880 | TAF9 | HTA11_7469_2000001011 | Human | Colorectum | AD | 4.71e-07 | 4.93e-01 | -0.0124 |
| 6880 | TAF9 | HTA11_6818_2000001021 | Human | Colorectum | AD | 6.92e-06 | 2.06e-01 | 0.0588 |
| 6880 | TAF9 | HTA11_99999970781_79442 | Human | Colorectum | MSS | 2.92e-23 | 4.12e-01 | 0.294 |
| 6880 | TAF9 | HTA11_99999965062_69753 | Human | Colorectum | MSI-H | 3.42e-04 | 4.33e-01 | 0.3487 |
| 6880 | TAF9 | HTA11_99999971662_82457 | Human | Colorectum | MSS | 7.11e-14 | 3.47e-01 | 0.3859 |
| 6880 | TAF9 | HTA11_99999973899_84307 | Human | Colorectum | MSS | 1.14e-04 | 1.99e-01 | 0.2585 |
| 6880 | TAF9 | HTA11_99999974143_84620 | Human | Colorectum | MSS | 3.61e-02 | 8.75e-02 | 0.3005 |
| 6880 | TAF9 | LZE4T | Human | Esophagus | ESCC | 2.98e-11 | 3.61e-01 | 0.0811 |
| 6880 | TAF9 | LZE7T | Human | Esophagus | ESCC | 2.45e-02 | 2.94e-01 | 0.0667 |
| Page: 1 2 3 4 5 6 7 |
| Tissue | Expression Dynamics | Abbreviation |
| Colorectum (GSE201348) | 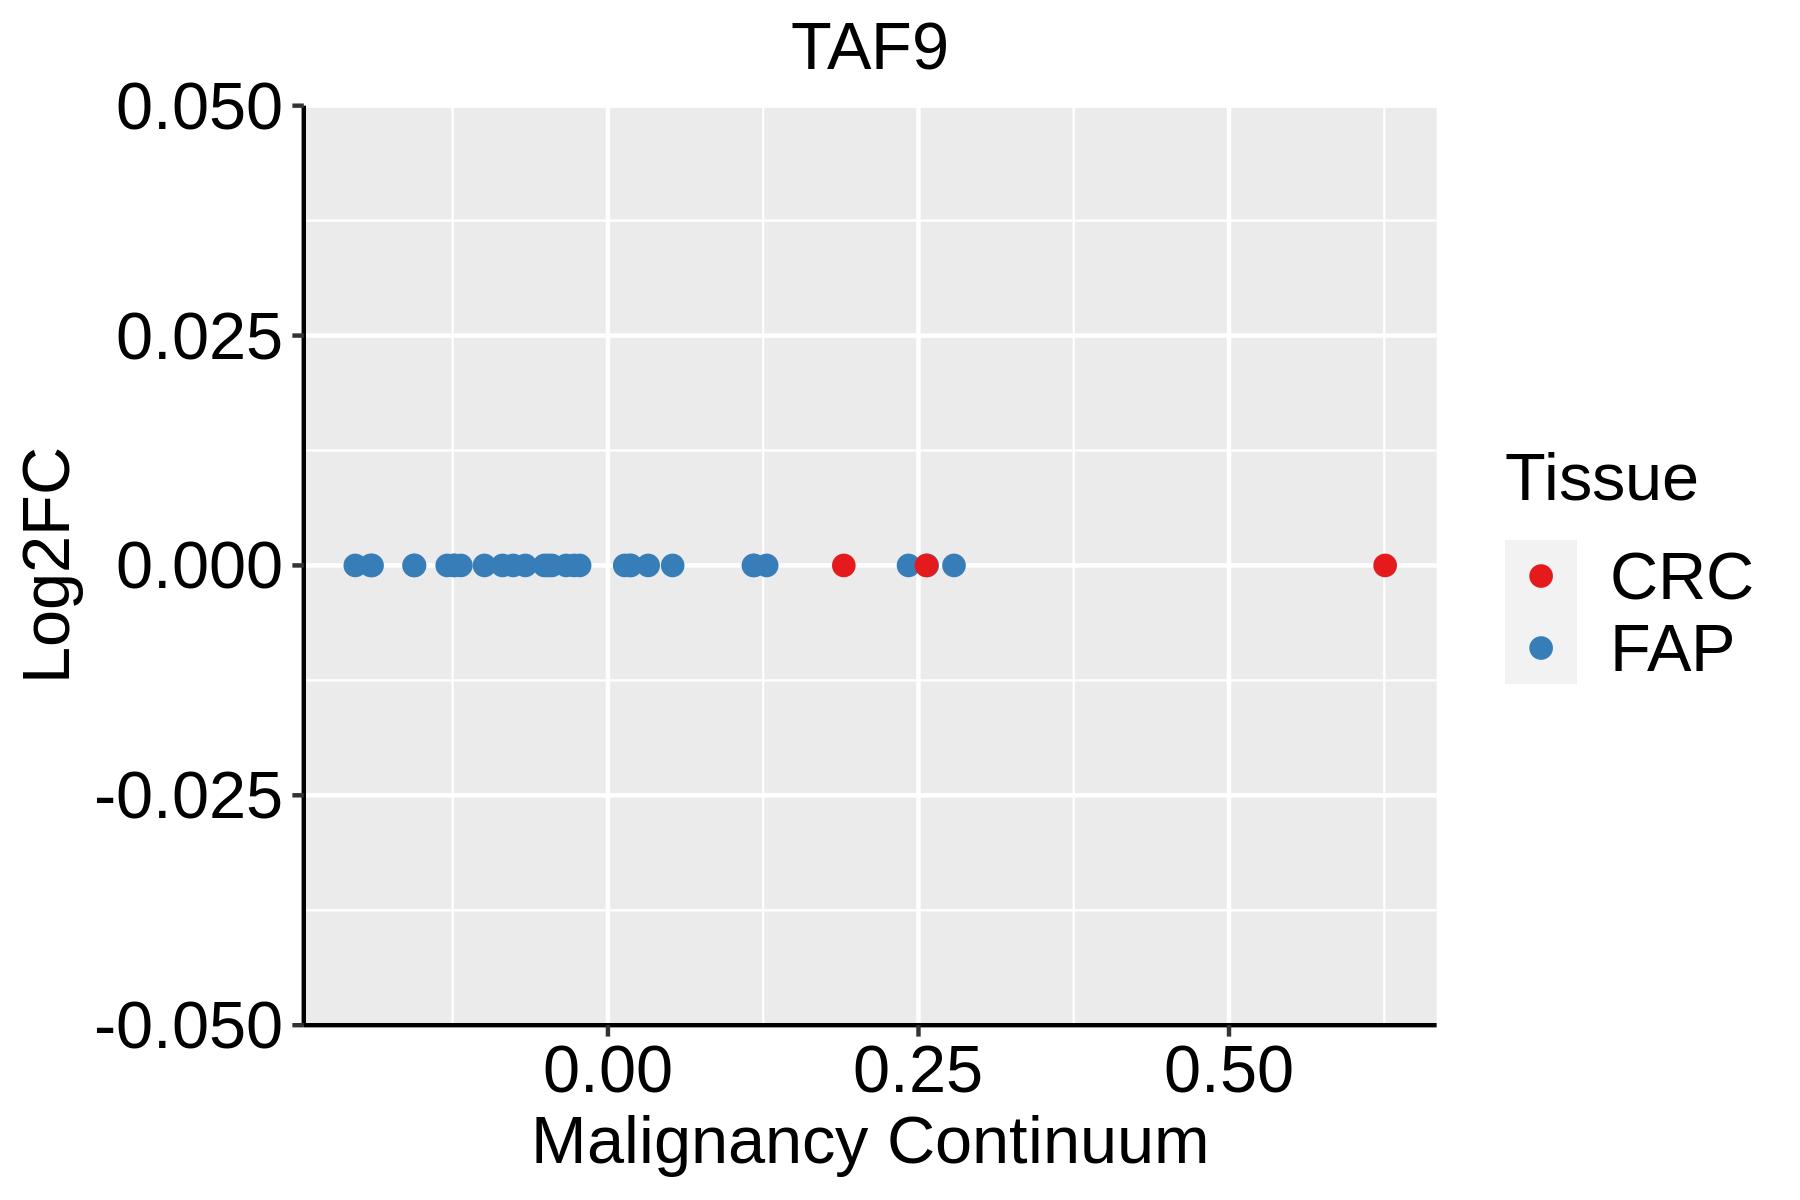 | FAP: Familial adenomatous polyposis |
| CRC: Colorectal cancer | ||
| Colorectum (HTA11) |  | AD: Adenomas |
| SER: Sessile serrated lesions | ||
| MSI-H: Microsatellite-high colorectal cancer | ||
| MSS: Microsatellite stable colorectal cancer | ||
| Esophagus | 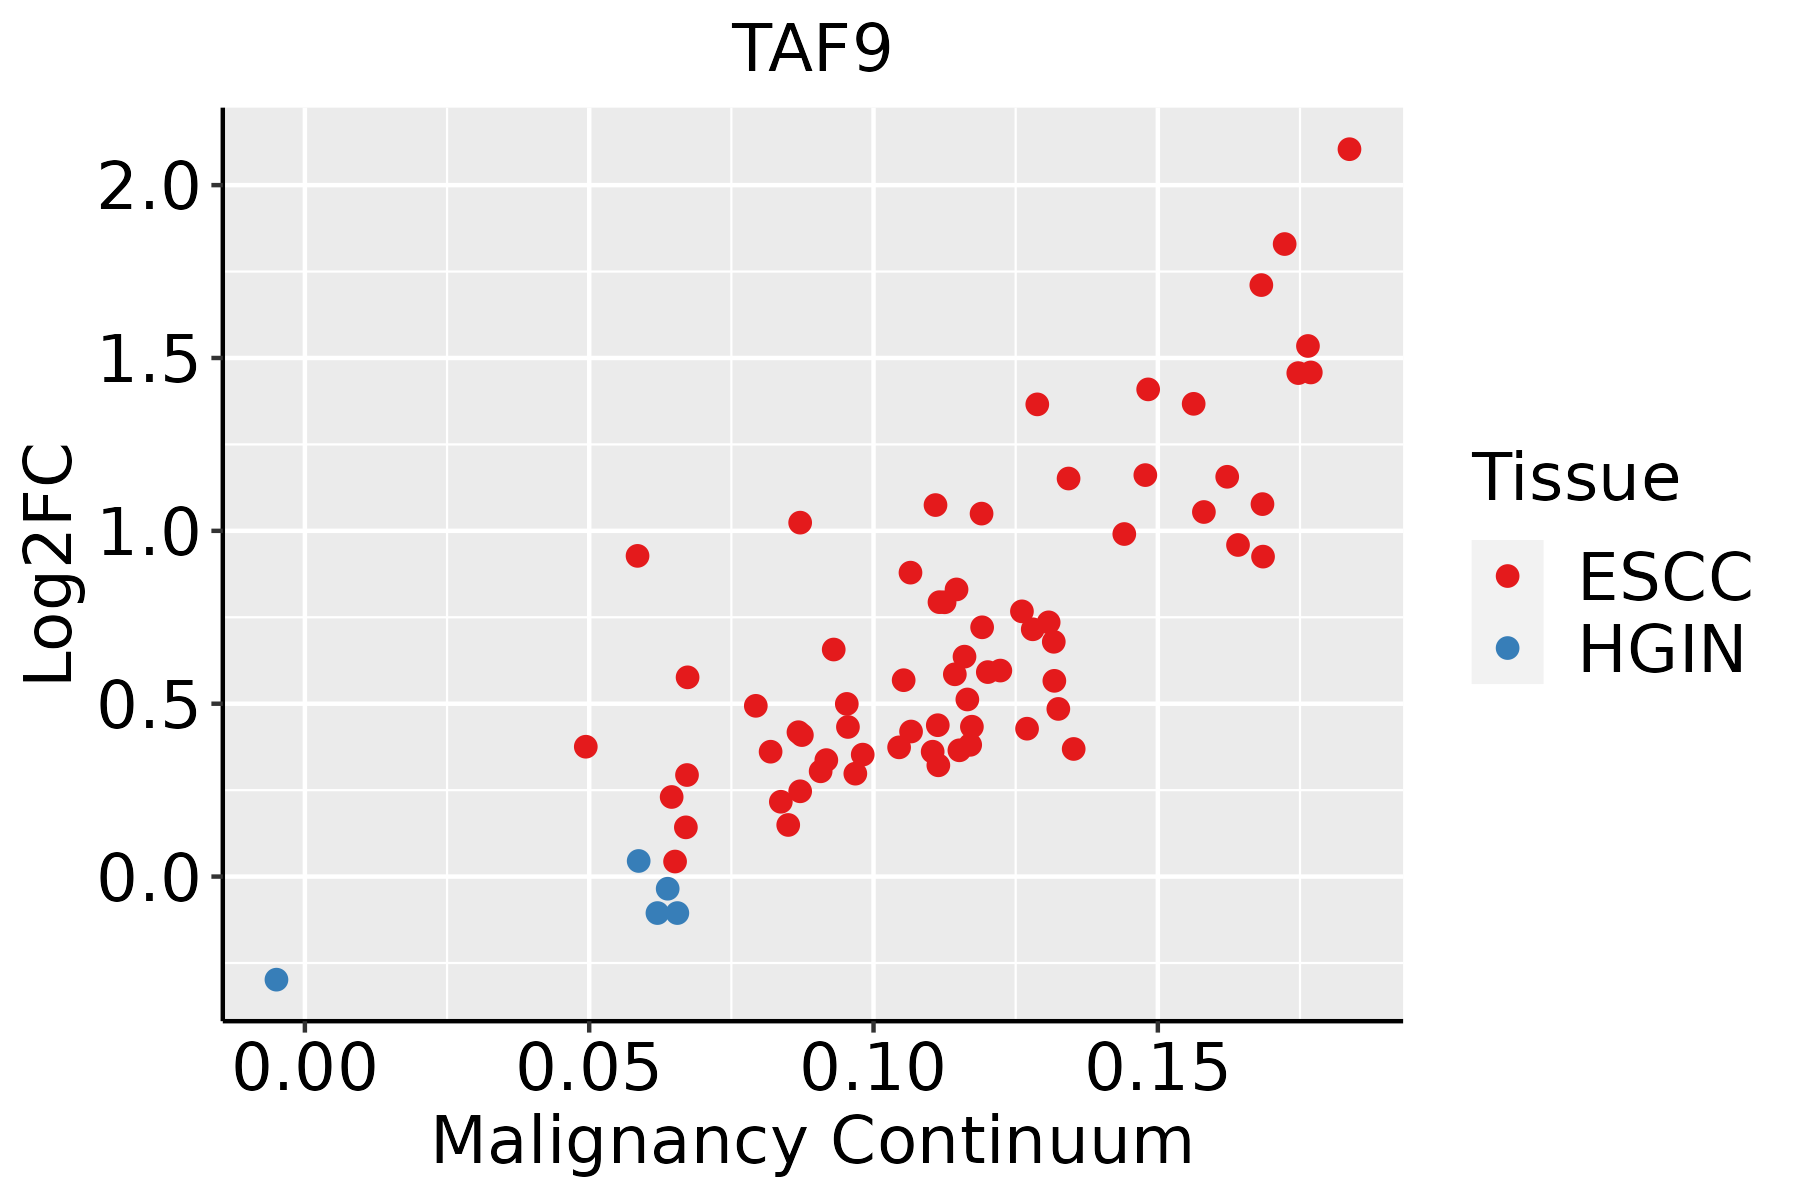 | ESCC: Esophageal squamous cell carcinoma |
| HGIN: High-grade intraepithelial neoplasias | ||
| LGIN: Low-grade intraepithelial neoplasias | ||
| Liver | 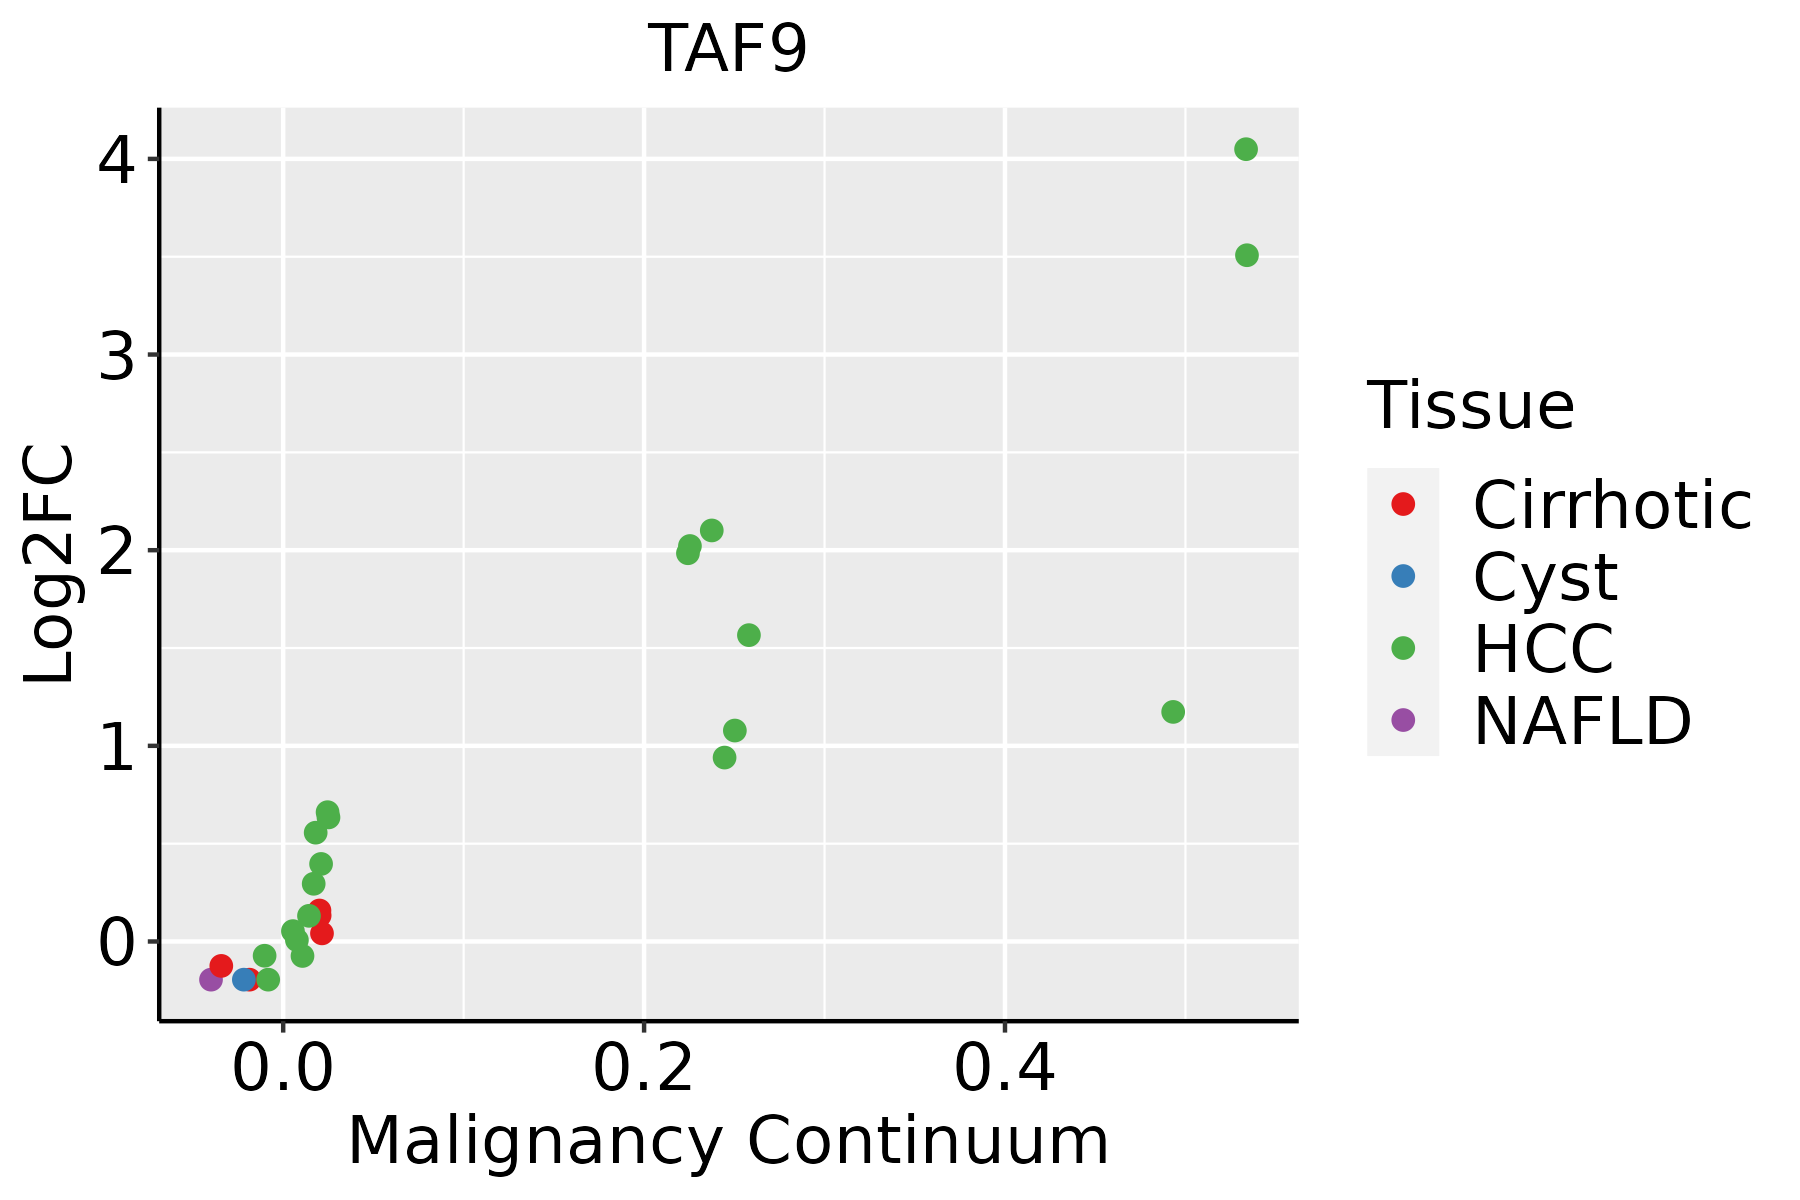 | HCC: Hepatocellular carcinoma |
| NAFLD: Non-alcoholic fatty liver disease | ||
| Oral Cavity | 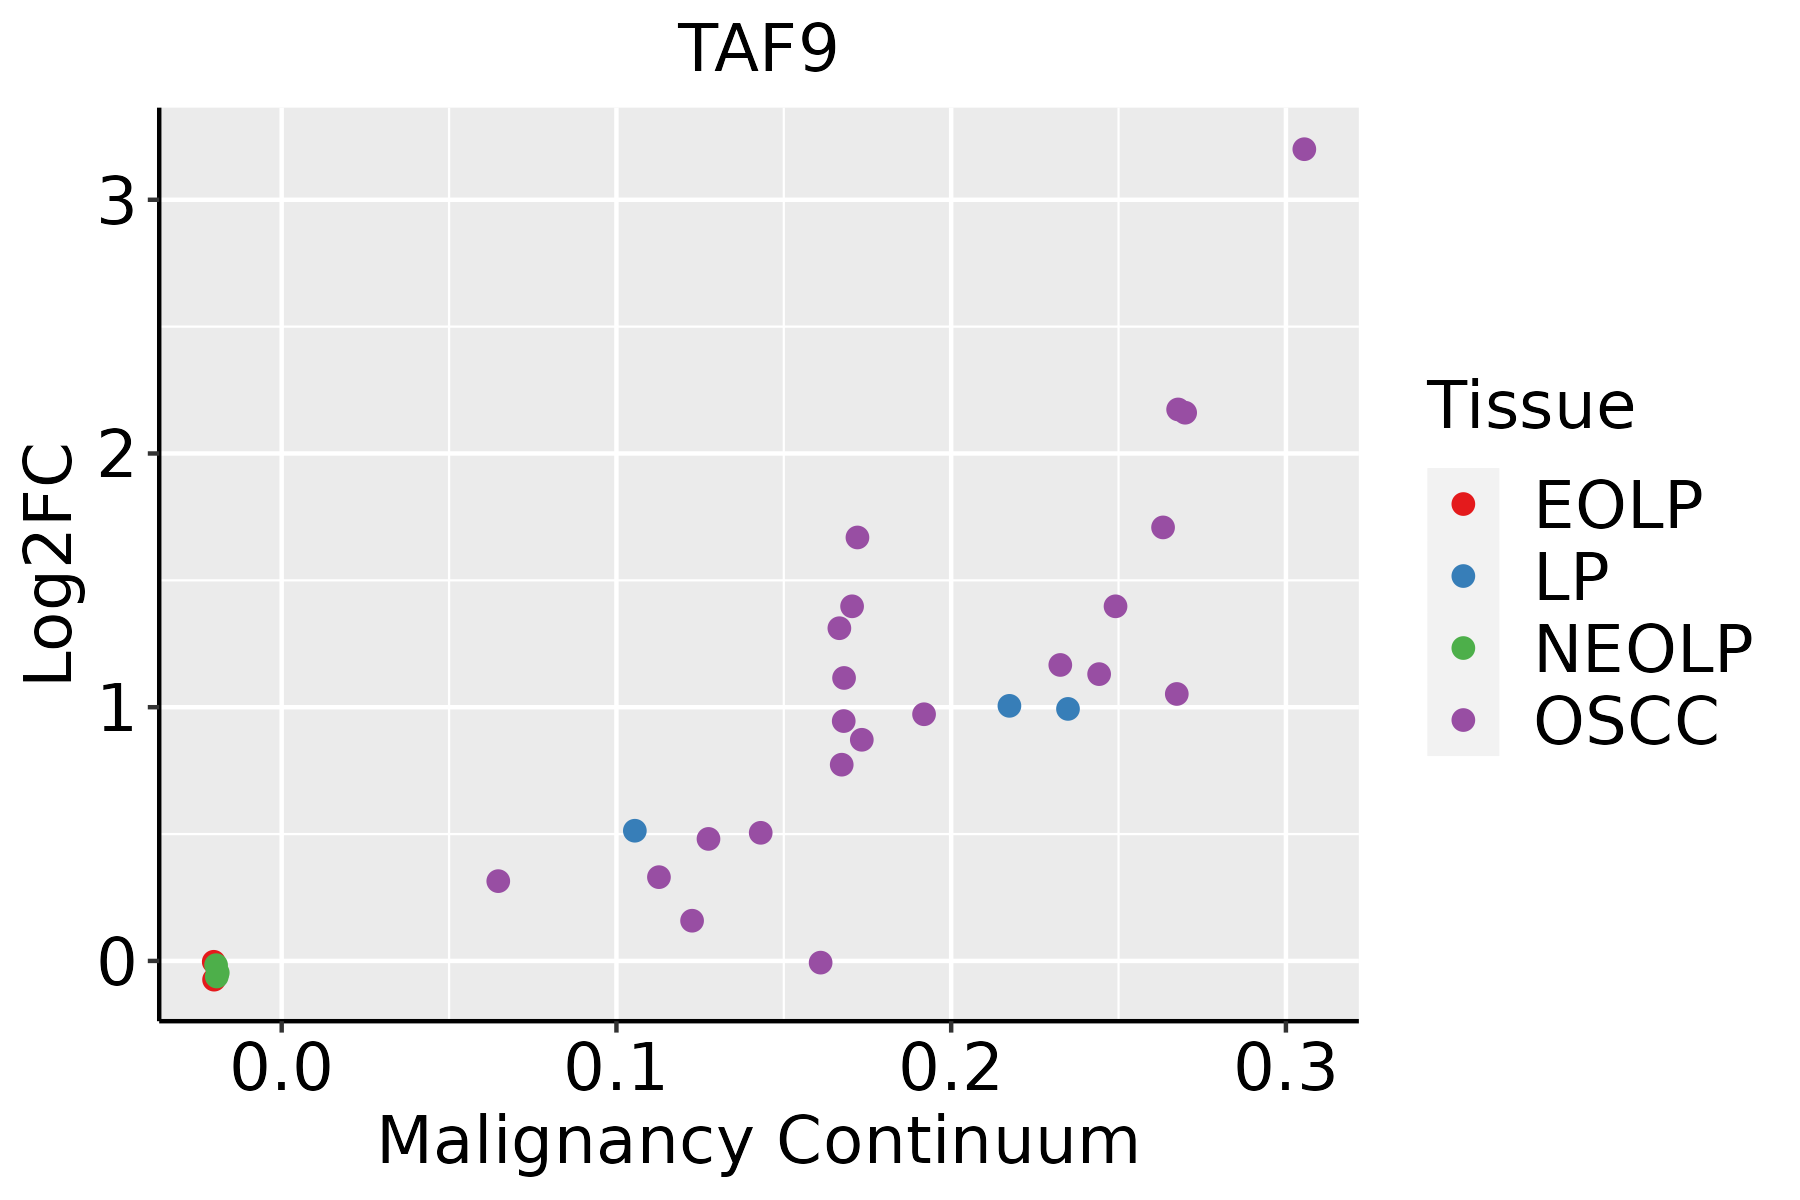 | EOLP: Erosive Oral lichen planus |
| LP: leukoplakia | ||
| NEOLP: Non-erosive oral lichen planus | ||
| OSCC: Oral squamous cell carcinoma | ||
| Skin | 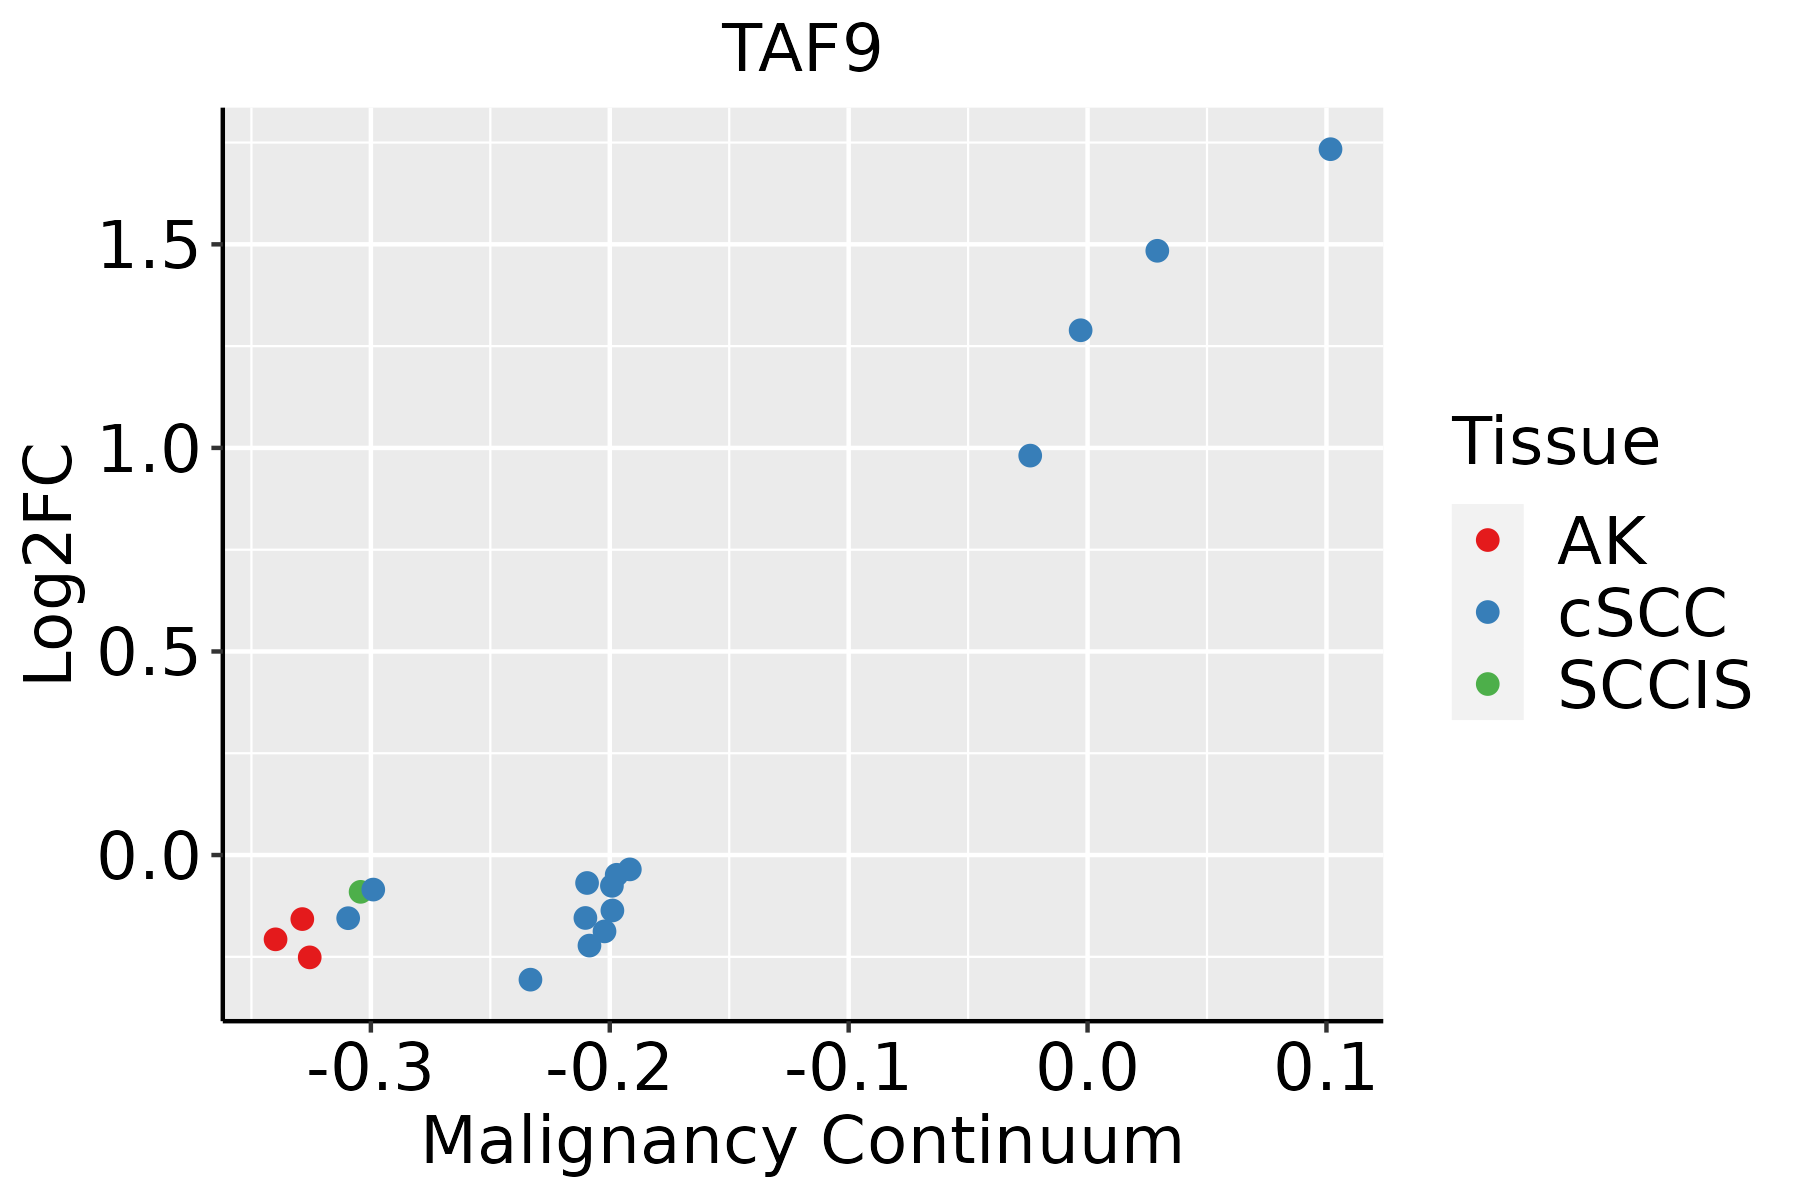 | AK: Actinic keratosis |
| cSCC: Cutaneous squamous cell carcinoma | ||
| SCCIS:squamous cell carcinoma in situ | ||
| Thyroid |  | ATC: Anaplastic thyroid cancer |
| HT: Hashimoto's thyroiditis | ||
| PTC: Papillary thyroid cancer |
| ∗log2FC in expression of this searched gene in stem-like cells from each diseased tissue sample relative to stem-like cells in normal samples in each tissue plotted against the malignancy continuum. Samples are colored based on if they are from different disease stage. |
Top |
Malignant transformation related pathway analysis |
| Find out the enriched GO biological processes and KEGG pathways involved in transition from healthy to precancer to cancer |
| Tissue | Disease Stage | Enriched GO biological Processes |
| Colorectum | AD |  |
| Colorectum | SER |  |
| Colorectum | MSS |  |
| Colorectum | MSI-H |  |
| Colorectum | FAP |  |
| ∗Top 15 enriched GO BP terms are showed in the bar plot of each disease state in each tissue. Each row represents a significant GO biological process which is colored according to the -log10(p.adjust). |
| Page: 1 2 3 4 5 6 7 8 9 |
| GO ID | Tissue | Disease Stage | Description | Gene Ratio | Bg Ratio | pvalue | p.adjust | Count |
| GO:0042176 | Colorectum | AD | regulation of protein catabolic process | 160/3918 | 391/18723 | 1.06e-19 | 7.34e-17 | 160 |
| GO:1903362 | Colorectum | AD | regulation of cellular protein catabolic process | 109/3918 | 255/18723 | 2.14e-15 | 6.08e-13 | 109 |
| GO:0010498 | Colorectum | AD | proteasomal protein catabolic process | 174/3918 | 490/18723 | 3.18e-14 | 7.66e-12 | 174 |
| GO:0009895 | Colorectum | AD | negative regulation of catabolic process | 124/3918 | 320/18723 | 1.66e-13 | 3.35e-11 | 124 |
| GO:0022618 | Colorectum | AD | ribonucleoprotein complex assembly | 92/3918 | 220/18723 | 1.49e-12 | 2.60e-10 | 92 |
| GO:0071826 | Colorectum | AD | ribonucleoprotein complex subunit organization | 94/3918 | 227/18723 | 1.70e-12 | 2.87e-10 | 94 |
| GO:1903050 | Colorectum | AD | regulation of proteolysis involved in cellular protein catabolic process | 92/3918 | 221/18723 | 2.04e-12 | 3.19e-10 | 92 |
| GO:0031330 | Colorectum | AD | negative regulation of cellular catabolic process | 104/3918 | 262/18723 | 2.66e-12 | 3.96e-10 | 104 |
| GO:0097193 | Colorectum | AD | intrinsic apoptotic signaling pathway | 108/3918 | 288/18723 | 6.25e-11 | 6.41e-09 | 108 |
| GO:0043161 | Colorectum | AD | proteasome-mediated ubiquitin-dependent protein catabolic process | 141/3918 | 412/18723 | 1.77e-10 | 1.68e-08 | 141 |
| GO:0031647 | Colorectum | AD | regulation of protein stability | 108/3918 | 298/18723 | 6.33e-10 | 5.08e-08 | 108 |
| GO:0042177 | Colorectum | AD | negative regulation of protein catabolic process | 55/3918 | 121/18723 | 1.19e-09 | 8.85e-08 | 55 |
| GO:0061136 | Colorectum | AD | regulation of proteasomal protein catabolic process | 75/3918 | 187/18723 | 1.65e-09 | 1.20e-07 | 75 |
| GO:2000058 | Colorectum | AD | regulation of ubiquitin-dependent protein catabolic process | 68/3918 | 164/18723 | 1.82e-09 | 1.31e-07 | 68 |
| GO:0022613 | Colorectum | AD | ribonucleoprotein complex biogenesis | 151/3918 | 463/18723 | 1.96e-09 | 1.39e-07 | 151 |
| GO:1903363 | Colorectum | AD | negative regulation of cellular protein catabolic process | 39/3918 | 75/18723 | 2.69e-09 | 1.87e-07 | 39 |
| GO:2001242 | Colorectum | AD | regulation of intrinsic apoptotic signaling pathway | 67/3918 | 164/18723 | 4.94e-09 | 3.16e-07 | 67 |
| GO:2001233 | Colorectum | AD | regulation of apoptotic signaling pathway | 119/3918 | 356/18723 | 2.14e-08 | 1.21e-06 | 119 |
| GO:0050821 | Colorectum | AD | protein stabilization | 73/3918 | 191/18723 | 3.02e-08 | 1.64e-06 | 73 |
| GO:0032434 | Colorectum | AD | regulation of proteasomal ubiquitin-dependent protein catabolic process | 54/3918 | 134/18723 | 2.51e-07 | 1.02e-05 | 54 |
| Page: 1 2 3 4 5 6 7 8 9 10 11 12 13 14 15 16 17 18 19 20 21 22 23 24 25 26 27 28 29 30 31 |
| Pathway ID | Tissue | Disease Stage | Description | Gene Ratio | Bg Ratio | pvalue | p.adjust | qvalue | Count |
| hsa030222 | Esophagus | ESCC | Basal transcription factors | 35/4205 | 45/8465 | 1.01e-04 | 4.06e-04 | 2.08e-04 | 35 |
| hsa0302211 | Esophagus | ESCC | Basal transcription factors | 35/4205 | 45/8465 | 1.01e-04 | 4.06e-04 | 2.08e-04 | 35 |
| hsa03022 | Oral cavity | OSCC | Basal transcription factors | 28/3704 | 45/8465 | 9.53e-03 | 2.11e-02 | 1.08e-02 | 28 |
| hsa030221 | Oral cavity | OSCC | Basal transcription factors | 28/3704 | 45/8465 | 9.53e-03 | 2.11e-02 | 1.08e-02 | 28 |
| Page: 1 |
Top |
Cell-cell communication analysis |
| Identification of potential cell-cell interactions between two cell types and their ligand-receptor pairs for different disease states |
| Ligand | Receptor | LRpair | Pathway | Tissue | Disease Stage |
| Page: 1 |
Top |
Single-cell gene regulatory network inference analysis |
| Find out the significant the regulons (TFs) and the target genes of each regulon across cell types for different disease states |
| TF | Cell Type | Tissue | Disease Stage | Target Gene | RSS | Regulon Activity |
| TAF9 | DC | Cervix | ADJ | AC016831.1,EIF4EBP3,AK6, etc. | 1.67e-01 |  |
| TAF9 | DC | Cervix | N_HPV | AC016831.1,EIF4EBP3,AK6, etc. | 2.03e-02 |  |
| ∗The dot plots of a searched regulon are shown for all cell subpopulations in each disease state of each tissue based on the regulon specific score inferred using pySCENIC and by calculating the average expression. |
| Page: 1 |
Top |
Somatic mutation of malignant transformation related genes |
| Annotation of somatic variants for genes involved in malignant transformation |
| Hugo Symbol | Variant Class | Variant Classification | dbSNP RS | HGVSc | HGVSp | HGVSp Short | SWISSPROT | BIOTYPE | SIFT | PolyPhen | Tumor Sample Barcode | Tissue | Histology | Sex | Age | Stage | Therapy Types | Drugs | Outcome |
| TAF9 | SNV | Missense_Mutation | c.238N>T | p.Asp80Tyr | p.D80Y | Q16594 | protein_coding | deleterious(0) | possibly_damaging(0.781) | TCGA-C8-A26X-01 | Breast | breast invasive carcinoma | Female | <65 | I/II | Chemotherapy | 5-fluorouracil | CR | |
| TAF9 | SNV | Missense_Mutation | novel | c.553N>G | p.Gln185Glu | p.Q185E | Q16594 | protein_coding | tolerated(0.11) | possibly_damaging(0.749) | TCGA-MA-AA41-01 | Cervix | cervical & endocervical cancer | Female | <65 | I/II | Unknown | Unknown | SD |
| TAF9 | SNV | Missense_Mutation | c.268N>T | p.Asp90Tyr | p.D90Y | Q16594 | protein_coding | deleterious(0) | probably_damaging(0.934) | TCGA-AZ-4315-01 | Colorectum | colon adenocarcinoma | Male | <65 | I/II | Unknown | Unknown | SD | |
| TAF9 | SNV | Missense_Mutation | rs374084798 | c.235N>A | p.Ala79Thr | p.A79T | Q16594 | protein_coding | tolerated(0.42) | benign(0.025) | TCGA-AG-3892-01 | Colorectum | rectum adenocarcinoma | Female | <65 | I/II | Unknown | Unknown | SD |
| TAF9 | SNV | Missense_Mutation | novel | c.280N>T | p.Asp94Tyr | p.D94Y | Q16594 | protein_coding | deleterious(0) | possibly_damaging(0.492) | TCGA-F5-6814-01 | Colorectum | rectum adenocarcinoma | Male | <65 | I/II | Unknown | Unknown | SD |
| TAF9 | deletion | Frame_Shift_Del | c.275delN | p.Leu92TyrfsTer2 | p.L92Yfs*2 | Q16594 | protein_coding | TCGA-AG-A02N-01 | Colorectum | rectum adenocarcinoma | Male | >=65 | I/II | Chemotherapy | folinic | CR | |||
| TAF9 | SNV | Missense_Mutation | c.266G>T | p.Arg89Ile | p.R89I | Q16594 | protein_coding | deleterious(0) | possibly_damaging(0.588) | TCGA-AP-A0LM-01 | Endometrium | uterine corpus endometrioid carcinoma | Female | <65 | III/IV | Chemotherapy | cisplatin | SD | |
| TAF9 | SNV | Missense_Mutation | c.268N>T | p.Asp90Tyr | p.D90Y | Q16594 | protein_coding | deleterious(0) | probably_damaging(0.934) | TCGA-B5-A0JY-01 | Endometrium | uterine corpus endometrioid carcinoma | Female | <65 | III/IV | Chemotherapy | doxorubicin | SD | |
| TAF9 | SNV | Missense_Mutation | c.272N>G | p.Phe91Cys | p.F91C | Q16594 | protein_coding | deleterious(0.01) | probably_damaging(0.926) | TCGA-BS-A0UV-01 | Endometrium | uterine corpus endometrioid carcinoma | Female | <65 | III/IV | Unknown | Unknown | SD | |
| TAF9 | SNV | Missense_Mutation | novel | c.165A>C | p.Lys55Asn | p.K55N | Q16594 | protein_coding | tolerated(0.11) | benign(0.022) | TCGA-EO-A3AV-01 | Endometrium | uterine corpus endometrioid carcinoma | Female | <65 | III/IV | Chemotherapy | carboplatin | CR |
| Page: 1 2 |
Top |
Related drugs of malignant transformation related genes |
| Identification of chemicals and drugs interact with genes involved in malignant transfromation |
| (DGIdb 4.0) |
| Entrez ID | Symbol | Category | Interaction Types | Drug Claim Name | Drug Name | PMIDs |
| Page: 1 |

Copyright 2023-Present -The University of Texas Health Science Center at Houston |