
|
|||||
|
 | |
| |
| |
| |
| |
| |
|
Gene: TAF8 |
Gene summary for TAF8 |
| Gene information | Species | Human | Gene symbol | TAF8 | Gene ID | 129685 |
| Gene name | TATA-box binding protein associated factor 8 | |
| Gene Alias | II | |
| Cytomap | 6p21.1 | |
| Gene Type | protein-coding | GO ID | GO:0001112 | UniProtAcc | Q7Z7C8 |
Top |
Malignant transformation analysis |
| Identification of the aberrant gene expression in precancerous and cancerous lesions by comparing the gene expression of stem-like cells in diseased tissues with normal stem cells |
| Entrez ID | Symbol | Replicates | Species | Organ | Tissue | Adj P-value | Log2FC | Malignancy |
| 129685 | TAF8 | LZE2D | Human | Esophagus | HGIN | 2.89e-02 | 3.92e-01 | 0.0642 |
| 129685 | TAF8 | LZE2T | Human | Esophagus | ESCC | 7.83e-06 | 9.93e-01 | 0.082 |
| 129685 | TAF8 | LZE4T | Human | Esophagus | ESCC | 2.53e-02 | 1.42e-01 | 0.0811 |
| 129685 | TAF8 | LZE7T | Human | Esophagus | ESCC | 1.06e-04 | 2.43e-01 | 0.0667 |
| 129685 | TAF8 | LZE8T | Human | Esophagus | ESCC | 2.92e-05 | 1.60e-01 | 0.067 |
| 129685 | TAF8 | LZE20T | Human | Esophagus | ESCC | 1.65e-07 | 1.57e-01 | 0.0662 |
| 129685 | TAF8 | LZE24T | Human | Esophagus | ESCC | 1.54e-12 | 2.70e-01 | 0.0596 |
| 129685 | TAF8 | LZE6T | Human | Esophagus | ESCC | 1.07e-06 | 3.70e-01 | 0.0845 |
| 129685 | TAF8 | P2T-E | Human | Esophagus | ESCC | 1.65e-12 | 3.12e-01 | 0.1177 |
| 129685 | TAF8 | P4T-E | Human | Esophagus | ESCC | 7.13e-19 | 3.69e-01 | 0.1323 |
| 129685 | TAF8 | P5T-E | Human | Esophagus | ESCC | 6.46e-05 | 1.97e-01 | 0.1327 |
| 129685 | TAF8 | P8T-E | Human | Esophagus | ESCC | 8.37e-17 | 2.43e-01 | 0.0889 |
| 129685 | TAF8 | P9T-E | Human | Esophagus | ESCC | 1.13e-12 | 2.37e-01 | 0.1131 |
| 129685 | TAF8 | P10T-E | Human | Esophagus | ESCC | 1.03e-12 | 2.28e-01 | 0.116 |
| 129685 | TAF8 | P11T-E | Human | Esophagus | ESCC | 1.03e-02 | 1.96e-01 | 0.1426 |
| 129685 | TAF8 | P12T-E | Human | Esophagus | ESCC | 6.62e-15 | 3.56e-01 | 0.1122 |
| 129685 | TAF8 | P15T-E | Human | Esophagus | ESCC | 3.83e-12 | 1.74e-01 | 0.1149 |
| 129685 | TAF8 | P16T-E | Human | Esophagus | ESCC | 1.44e-13 | 2.49e-01 | 0.1153 |
| 129685 | TAF8 | P17T-E | Human | Esophagus | ESCC | 1.53e-09 | 3.32e-01 | 0.1278 |
| 129685 | TAF8 | P20T-E | Human | Esophagus | ESCC | 1.05e-05 | 1.74e-01 | 0.1124 |
| Page: 1 2 3 4 |
| Tissue | Expression Dynamics | Abbreviation |
| Esophagus | 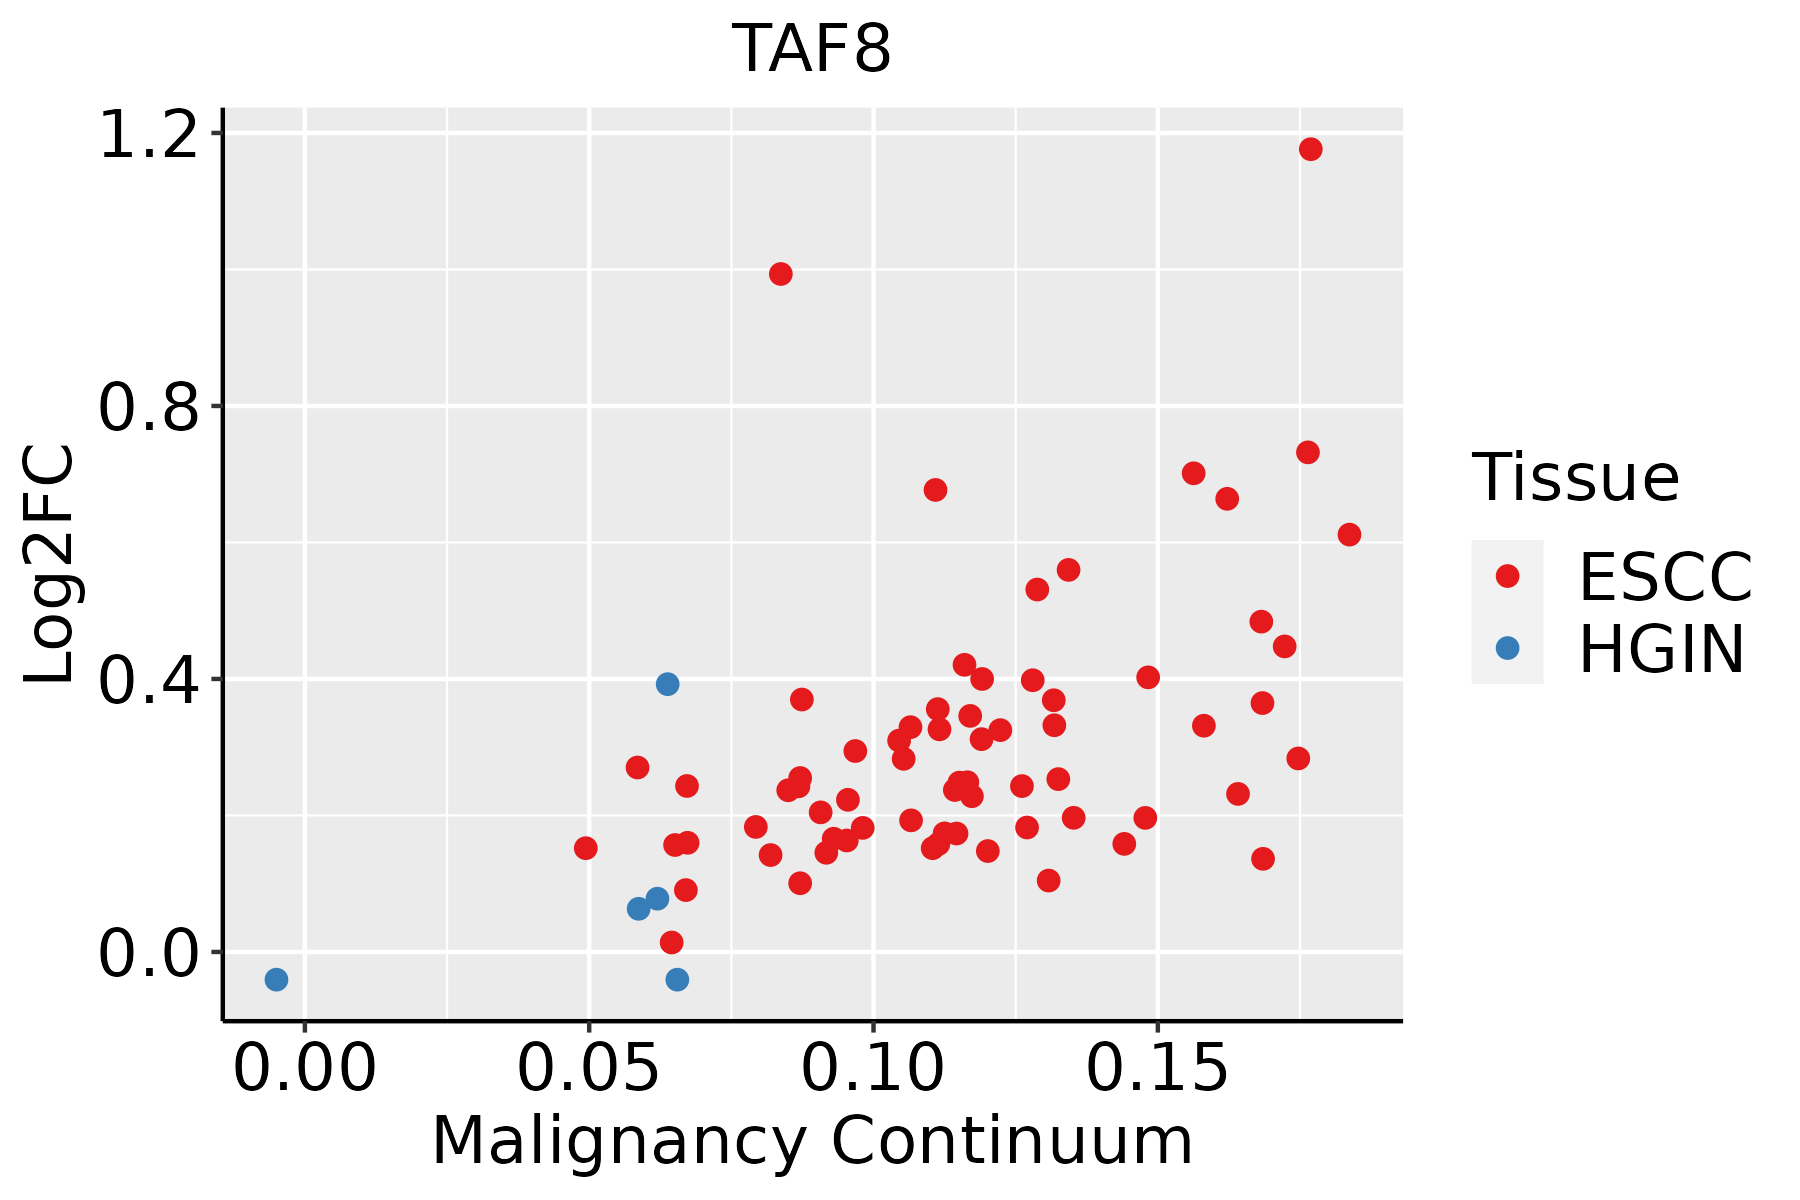 | ESCC: Esophageal squamous cell carcinoma |
| HGIN: High-grade intraepithelial neoplasias | ||
| LGIN: Low-grade intraepithelial neoplasias | ||
| Liver |  | HCC: Hepatocellular carcinoma |
| NAFLD: Non-alcoholic fatty liver disease | ||
| Oral Cavity | 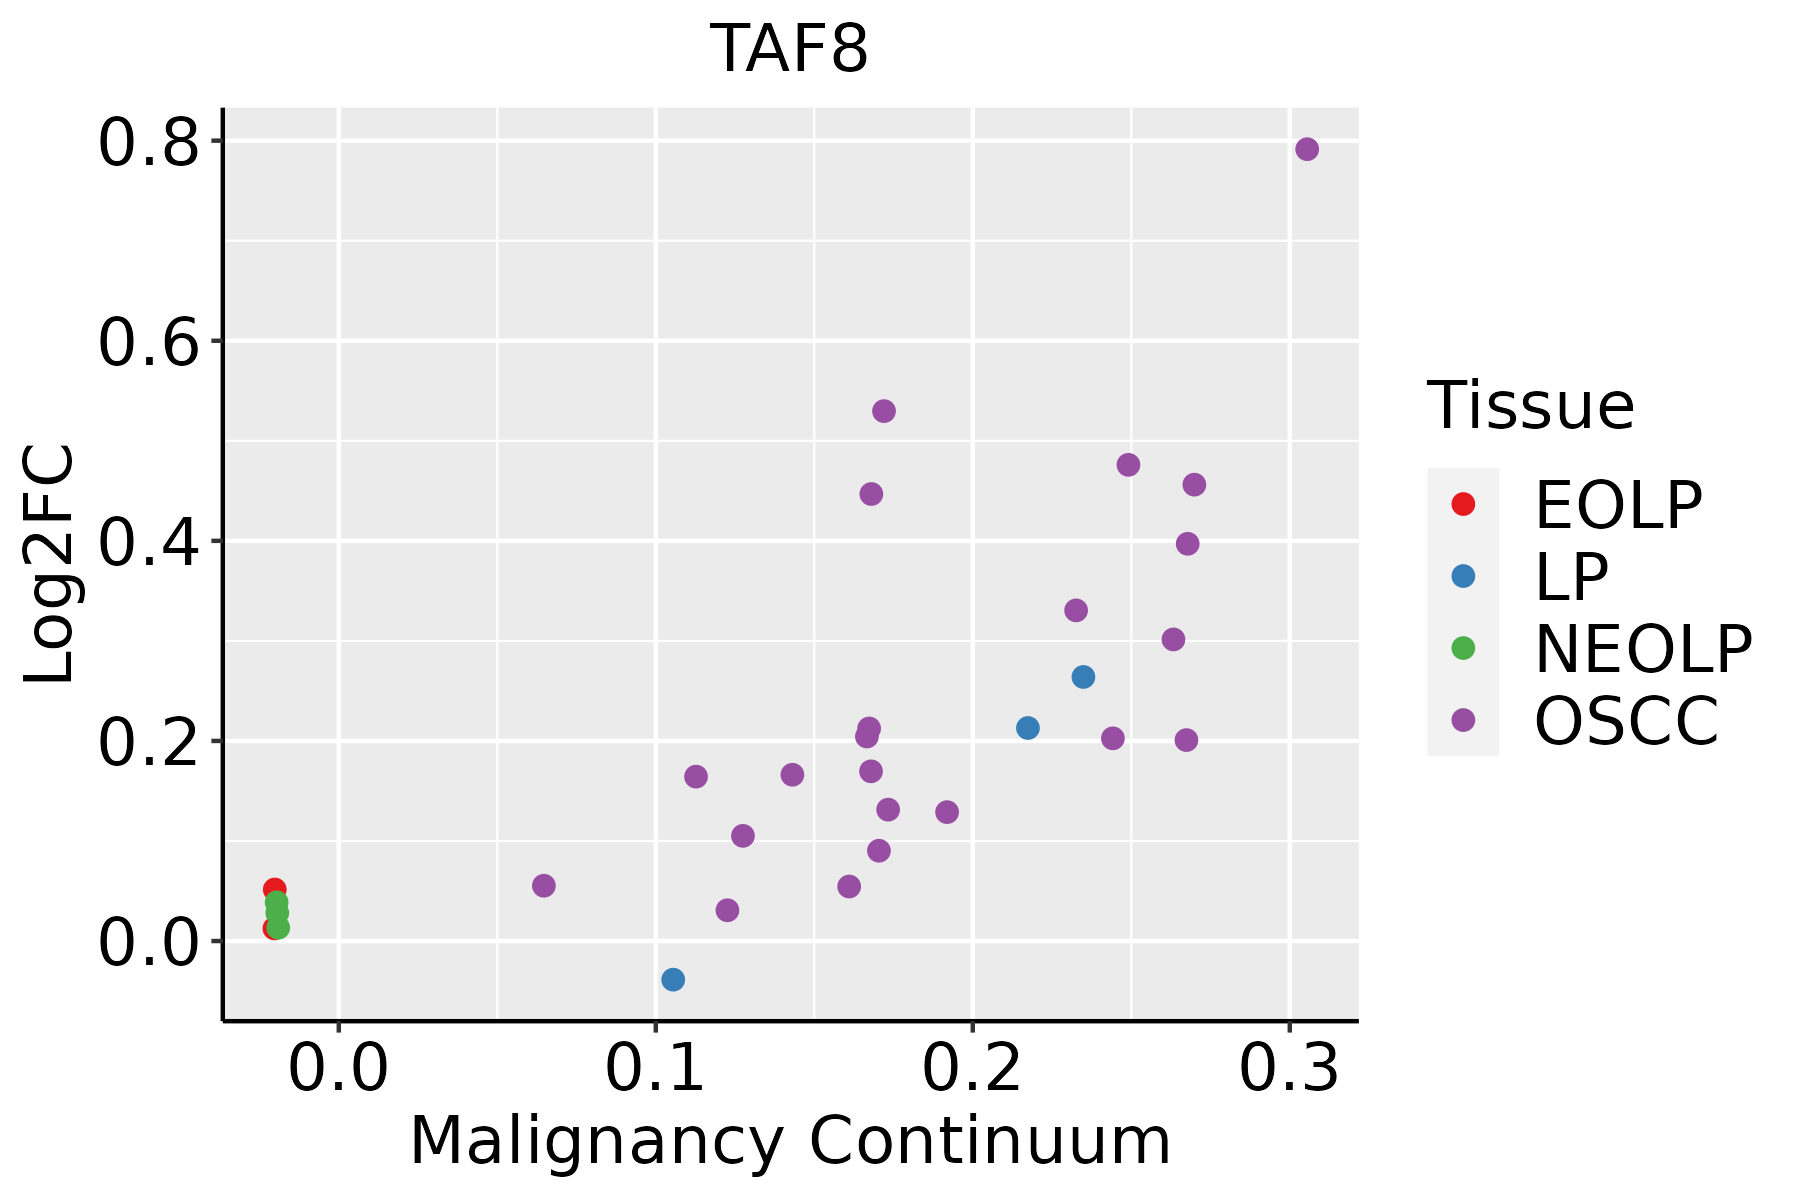 | EOLP: Erosive Oral lichen planus |
| LP: leukoplakia | ||
| NEOLP: Non-erosive oral lichen planus | ||
| OSCC: Oral squamous cell carcinoma |
| ∗log2FC in expression of this searched gene in stem-like cells from each diseased tissue sample relative to stem-like cells in normal samples in each tissue plotted against the malignancy continuum. Samples are colored based on if they are from different disease stage. |
Top |
Malignant transformation related pathway analysis |
| Find out the enriched GO biological processes and KEGG pathways involved in transition from healthy to precancer to cancer |
| Tissue | Disease Stage | Enriched GO biological Processes |
| Colorectum | AD |  |
| Colorectum | SER |  |
| Colorectum | MSS |  |
| Colorectum | MSI-H |  |
| Colorectum | FAP |  |
| ∗Top 15 enriched GO BP terms are showed in the bar plot of each disease state in each tissue. Each row represents a significant GO biological process which is colored according to the -log10(p.adjust). |
| Page: 1 2 3 4 5 6 7 8 9 |
| GO ID | Tissue | Disease Stage | Description | Gene Ratio | Bg Ratio | pvalue | p.adjust | Count |
| GO:003450417 | Esophagus | HGIN | protein localization to nucleus | 84/2587 | 290/18723 | 1.06e-11 | 1.24e-09 | 84 |
| GO:005165126 | Esophagus | HGIN | maintenance of location in cell | 53/2587 | 214/18723 | 1.22e-05 | 3.45e-04 | 53 |
| GO:005123520 | Esophagus | HGIN | maintenance of location | 73/2587 | 327/18723 | 1.73e-05 | 4.71e-04 | 73 |
| GO:004518523 | Esophagus | HGIN | maintenance of protein location | 28/2587 | 94/18723 | 4.52e-05 | 1.09e-03 | 28 |
| GO:000170118 | Esophagus | HGIN | in utero embryonic development | 77/2587 | 367/18723 | 9.56e-05 | 2.05e-03 | 77 |
| GO:003250719 | Esophagus | HGIN | maintenance of protein location in cell | 20/2587 | 65/18723 | 3.31e-04 | 5.48e-03 | 20 |
| GO:00018244 | Esophagus | HGIN | blastocyst development | 28/2587 | 106/18723 | 4.30e-04 | 6.47e-03 | 28 |
| GO:00514575 | Esophagus | HGIN | maintenance of protein location in nucleus | 10/2587 | 23/18723 | 5.09e-04 | 7.38e-03 | 10 |
| GO:00725959 | Esophagus | HGIN | maintenance of protein localization in organelle | 14/2587 | 42/18723 | 1.05e-03 | 1.31e-02 | 14 |
| GO:00063523 | Esophagus | HGIN | DNA-templated transcription, initiation | 30/2587 | 130/18723 | 2.86e-03 | 2.79e-02 | 30 |
| GO:003450418 | Esophagus | ESCC | protein localization to nucleus | 211/8552 | 290/18723 | 4.06e-21 | 6.60e-19 | 211 |
| GO:000170119 | Esophagus | ESCC | in utero embryonic development | 243/8552 | 367/18723 | 1.00e-15 | 6.86e-14 | 243 |
| GO:0045185111 | Esophagus | ESCC | maintenance of protein location | 71/8552 | 94/18723 | 3.41e-09 | 7.24e-08 | 71 |
| GO:0051235110 | Esophagus | ESCC | maintenance of location | 200/8552 | 327/18723 | 1.01e-08 | 2.02e-07 | 200 |
| GO:0032507110 | Esophagus | ESCC | maintenance of protein location in cell | 52/8552 | 65/18723 | 1.41e-08 | 2.77e-07 | 52 |
| GO:007259517 | Esophagus | ESCC | maintenance of protein localization in organelle | 36/8552 | 42/18723 | 8.46e-08 | 1.44e-06 | 36 |
| GO:000182412 | Esophagus | ESCC | blastocyst development | 73/8552 | 106/18723 | 1.13e-06 | 1.40e-05 | 73 |
| GO:00063673 | Esophagus | ESCC | transcription initiation from RNA polymerase II promoter | 56/8552 | 77/18723 | 1.30e-06 | 1.59e-05 | 56 |
| GO:000635211 | Esophagus | ESCC | DNA-templated transcription, initiation | 86/8552 | 130/18723 | 1.88e-06 | 2.19e-05 | 86 |
| GO:00454449 | Esophagus | ESCC | fat cell differentiation | 135/8552 | 229/18723 | 3.38e-05 | 2.78e-04 | 135 |
| Page: 1 2 3 |
| Pathway ID | Tissue | Disease Stage | Description | Gene Ratio | Bg Ratio | pvalue | p.adjust | qvalue | Count |
| hsa030222 | Esophagus | ESCC | Basal transcription factors | 35/4205 | 45/8465 | 1.01e-04 | 4.06e-04 | 2.08e-04 | 35 |
| hsa0302211 | Esophagus | ESCC | Basal transcription factors | 35/4205 | 45/8465 | 1.01e-04 | 4.06e-04 | 2.08e-04 | 35 |
| hsa03022 | Oral cavity | OSCC | Basal transcription factors | 28/3704 | 45/8465 | 9.53e-03 | 2.11e-02 | 1.08e-02 | 28 |
| hsa030221 | Oral cavity | OSCC | Basal transcription factors | 28/3704 | 45/8465 | 9.53e-03 | 2.11e-02 | 1.08e-02 | 28 |
| Page: 1 |
Top |
Cell-cell communication analysis |
| Identification of potential cell-cell interactions between two cell types and their ligand-receptor pairs for different disease states |
| Ligand | Receptor | LRpair | Pathway | Tissue | Disease Stage |
| Page: 1 |
Top |
Single-cell gene regulatory network inference analysis |
| Find out the significant the regulons (TFs) and the target genes of each regulon across cell types for different disease states |
| TF | Cell Type | Tissue | Disease Stage | Target Gene | RSS | Regulon Activity |
| ∗The dot plots of a searched regulon are shown for all cell subpopulations in each disease state of each tissue based on the regulon specific score inferred using pySCENIC and by calculating the average expression. |
| Page: 1 |
Top |
Somatic mutation of malignant transformation related genes |
| Annotation of somatic variants for genes involved in malignant transformation |
| Hugo Symbol | Variant Class | Variant Classification | dbSNP RS | HGVSc | HGVSp | HGVSp Short | SWISSPROT | BIOTYPE | SIFT | PolyPhen | Tumor Sample Barcode | Tissue | Histology | Sex | Age | Stage | Therapy Types | Drugs | Outcome |
| TAF8 | SNV | Missense_Mutation | c.377A>G | p.Asn126Ser | p.N126S | Q7Z7C8 | protein_coding | tolerated(0.37) | benign(0.007) | TCGA-BH-A0E9-01 | Breast | breast invasive carcinoma | Female | <65 | I/II | Chemotherapy | taxotere | CR | |
| TAF8 | insertion | Frame_Shift_Ins | novel | c.858_859insTTTTCTGTGTCTATACACAACTGTGACTTTTTAAGAATTTT | p.Glu287PhefsTer26 | p.E287Ffs*26 | Q7Z7C8 | protein_coding | TCGA-AN-A0FS-01 | Breast | breast invasive carcinoma | Female | <65 | I/II | Unknown | Unknown | SD | ||
| TAF8 | SNV | Missense_Mutation | rs752586050 | c.728N>T | p.Ser243Leu | p.S243L | Q7Z7C8 | protein_coding | tolerated(0.17) | benign(0.003) | TCGA-FU-A3TX-01 | Cervix | cervical & endocervical cancer | Female | >=65 | I/II | Unknown | Unknown | SD |
| TAF8 | SNV | Missense_Mutation | c.106N>G | p.Thr36Ala | p.T36A | Q7Z7C8 | protein_coding | tolerated(0.74) | benign(0.015) | TCGA-A6-2686-01 | Colorectum | colon adenocarcinoma | Female | >=65 | I/II | Unknown | Unknown | SD | |
| TAF8 | SNV | Missense_Mutation | c.914N>T | p.Arg305Met | p.R305M | Q7Z7C8 | protein_coding | deleterious(0.01) | benign(0.276) | TCGA-AD-6964-01 | Colorectum | colon adenocarcinoma | Male | <65 | III/IV | Chemotherapy | folfox | PD | |
| TAF8 | SNV | Missense_Mutation | novel | c.95N>T | p.Ala32Val | p.A32V | Q7Z7C8 | protein_coding | deleterious(0.03) | benign(0.119) | TCGA-AZ-4315-01 | Colorectum | colon adenocarcinoma | Male | <65 | I/II | Unknown | Unknown | SD |
| TAF8 | SNV | Missense_Mutation | novel | c.788N>A | p.Ser263Tyr | p.S263Y | Q7Z7C8 | protein_coding | deleterious(0.04) | benign(0.146) | TCGA-CA-6717-01 | Colorectum | colon adenocarcinoma | Male | <65 | I/II | Chemotherapy | oxaliplatin | CR |
| TAF8 | SNV | Missense_Mutation | c.799A>G | p.Lys267Glu | p.K267E | Q7Z7C8 | protein_coding | tolerated(0.24) | benign(0.039) | TCGA-D5-6930-01 | Colorectum | colon adenocarcinoma | Male | >=65 | I/II | Unknown | Unknown | SD | |
| TAF8 | SNV | Missense_Mutation | c.756N>T | p.Glu252Asp | p.E252D | Q7Z7C8 | protein_coding | tolerated(0.27) | benign(0.003) | TCGA-AG-A002-01 | Colorectum | rectum adenocarcinoma | Male | <65 | I/II | Unknown | Unknown | SD | |
| TAF8 | SNV | Missense_Mutation | c.551G>A | p.Arg184His | p.R184H | Q7Z7C8 | protein_coding | deleterious(0) | probably_damaging(0.98) | TCGA-A5-A0VP-01 | Endometrium | uterine corpus endometrioid carcinoma | Female | >=65 | I/II | Unknown | Unknown | SD |
| Page: 1 2 3 |
Top |
Related drugs of malignant transformation related genes |
| Identification of chemicals and drugs interact with genes involved in malignant transfromation |
| (DGIdb 4.0) |
| Entrez ID | Symbol | Category | Interaction Types | Drug Claim Name | Drug Name | PMIDs |
| Page: 1 |

Copyright 2023-Present -The University of Texas Health Science Center at Houston |