
|
|||||
|
 | |
| |
| |
| |
| |
| |
|
Gene: TAF4B |
Gene summary for TAF4B |
| Gene information | Species | Human | Gene symbol | TAF4B | Gene ID | 6875 |
| Gene name | TATA-box binding protein associated factor 4b | |
| Gene Alias | SPGF13 | |
| Cytomap | 18q11.2 | |
| Gene Type | protein-coding | GO ID | GO:0000003 | UniProtAcc | J3KTH2 |
Top |
Malignant transformation analysis |
| Identification of the aberrant gene expression in precancerous and cancerous lesions by comparing the gene expression of stem-like cells in diseased tissues with normal stem cells |
| Entrez ID | Symbol | Replicates | Species | Organ | Tissue | Adj P-value | Log2FC | Malignancy |
| 6875 | TAF4B | AEH-subject1 | Human | Endometrium | AEH | 1.81e-24 | 5.95e-01 | -0.3059 |
| 6875 | TAF4B | AEH-subject2 | Human | Endometrium | AEH | 4.42e-12 | 4.37e-01 | -0.2525 |
| 6875 | TAF4B | AEH-subject3 | Human | Endometrium | AEH | 4.35e-15 | 4.94e-01 | -0.2576 |
| 6875 | TAF4B | AEH-subject4 | Human | Endometrium | AEH | 3.77e-03 | 2.69e-01 | -0.2657 |
| 6875 | TAF4B | AEH-subject5 | Human | Endometrium | AEH | 3.45e-12 | 4.23e-01 | -0.2953 |
| 6875 | TAF4B | EEC-subject1 | Human | Endometrium | EEC | 2.56e-15 | 4.54e-01 | -0.2682 |
| 6875 | TAF4B | EEC-subject2 | Human | Endometrium | EEC | 1.61e-12 | 4.31e-01 | -0.2607 |
| 6875 | TAF4B | EEC-subject4 | Human | Endometrium | EEC | 2.98e-02 | 2.18e-01 | -0.2571 |
| 6875 | TAF4B | LZE24T | Human | Esophagus | ESCC | 9.16e-05 | 2.84e-01 | 0.0596 |
| 6875 | TAF4B | P1T-E | Human | Esophagus | ESCC | 7.92e-10 | 6.37e-01 | 0.0875 |
| 6875 | TAF4B | P2T-E | Human | Esophagus | ESCC | 4.20e-15 | 3.58e-01 | 0.1177 |
| 6875 | TAF4B | P4T-E | Human | Esophagus | ESCC | 1.44e-13 | 9.60e-02 | 0.1323 |
| 6875 | TAF4B | P5T-E | Human | Esophagus | ESCC | 2.82e-04 | 1.08e-01 | 0.1327 |
| 6875 | TAF4B | P8T-E | Human | Esophagus | ESCC | 5.86e-06 | 1.52e-01 | 0.0889 |
| 6875 | TAF4B | P9T-E | Human | Esophagus | ESCC | 2.31e-24 | 7.49e-01 | 0.1131 |
| 6875 | TAF4B | P10T-E | Human | Esophagus | ESCC | 1.67e-04 | 1.42e-01 | 0.116 |
| 6875 | TAF4B | P11T-E | Human | Esophagus | ESCC | 3.72e-07 | 1.52e-01 | 0.1426 |
| 6875 | TAF4B | P12T-E | Human | Esophagus | ESCC | 7.24e-10 | 2.46e-01 | 0.1122 |
| 6875 | TAF4B | P15T-E | Human | Esophagus | ESCC | 1.83e-08 | 3.30e-01 | 0.1149 |
| 6875 | TAF4B | P16T-E | Human | Esophagus | ESCC | 3.04e-12 | 1.49e-01 | 0.1153 |
| Page: 1 2 3 4 |
| Tissue | Expression Dynamics | Abbreviation |
| Endometrium | 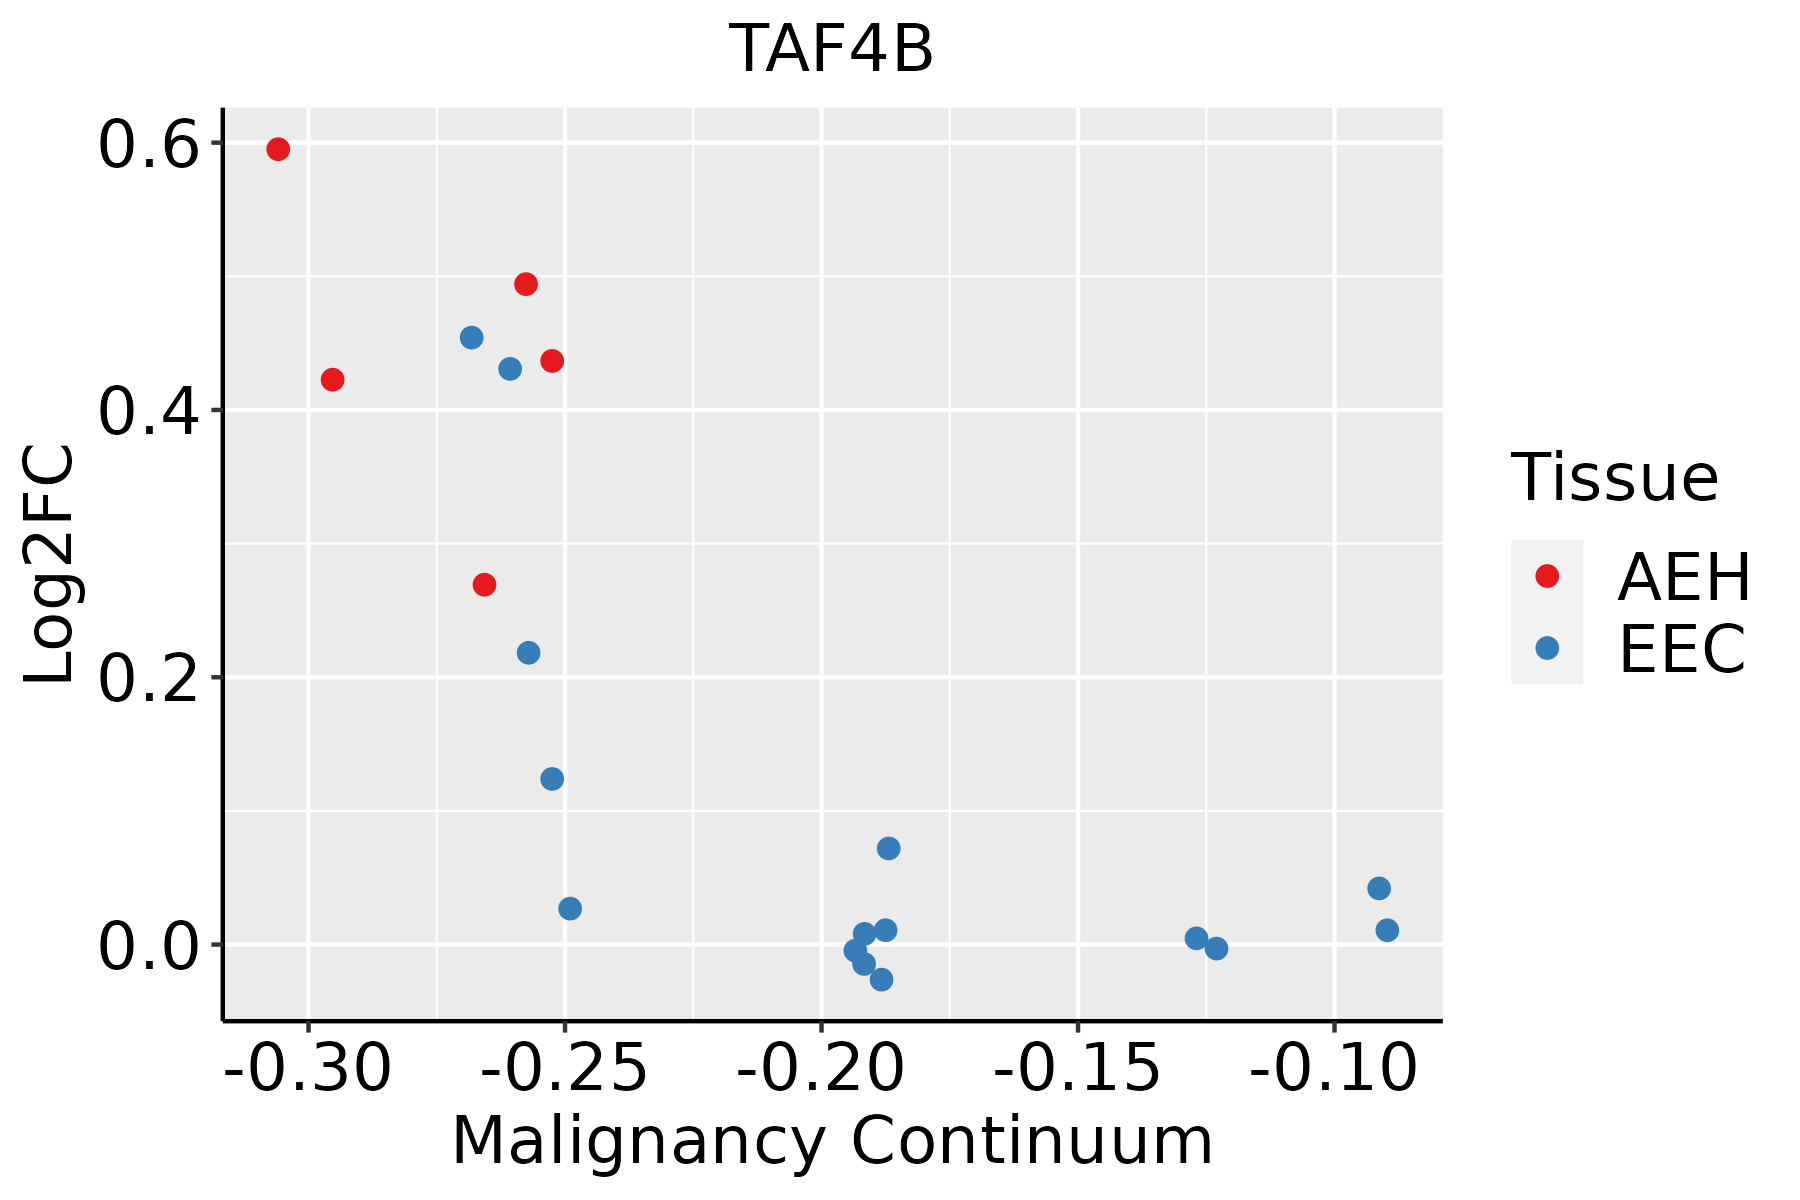 | AEH: Atypical endometrial hyperplasia |
| EEC: Endometrioid Cancer | ||
| Esophagus | 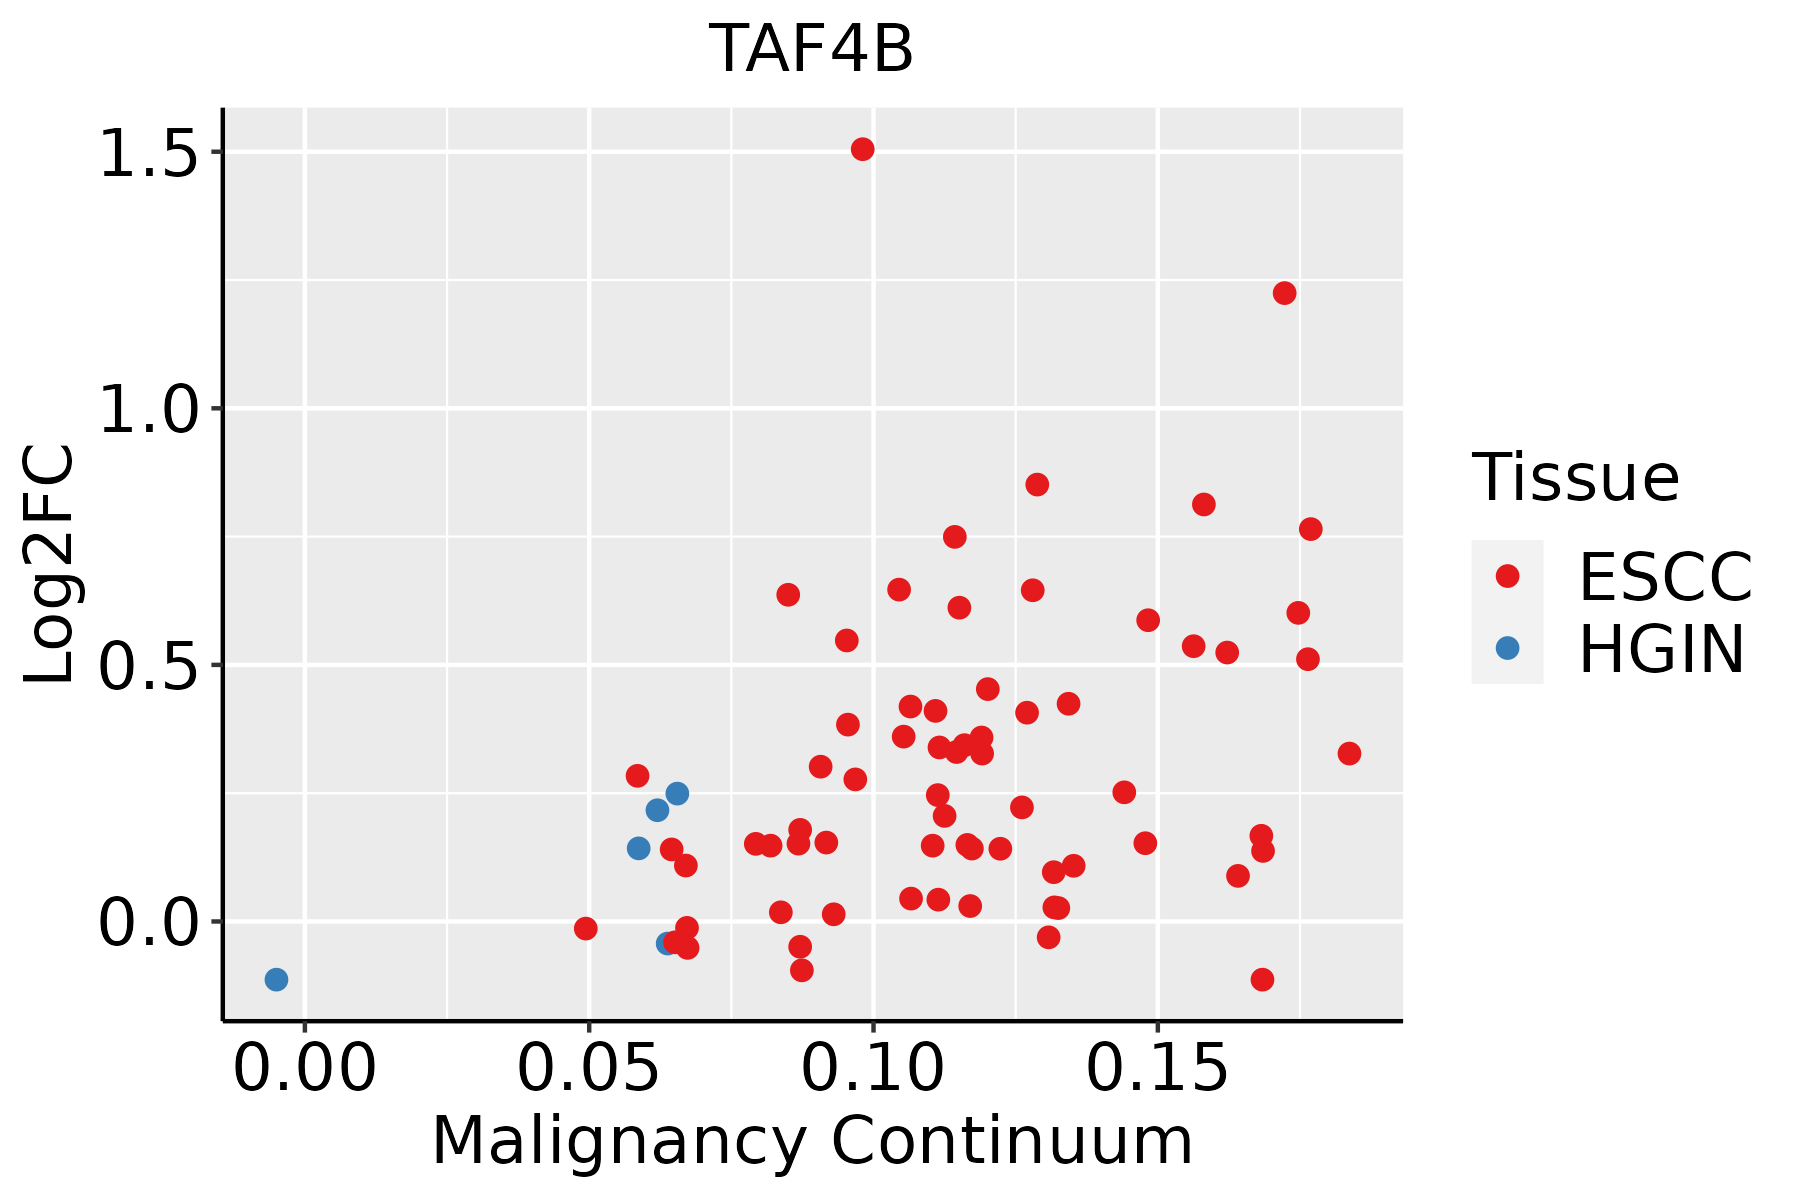 | ESCC: Esophageal squamous cell carcinoma |
| HGIN: High-grade intraepithelial neoplasias | ||
| LGIN: Low-grade intraepithelial neoplasias | ||
| Lung | 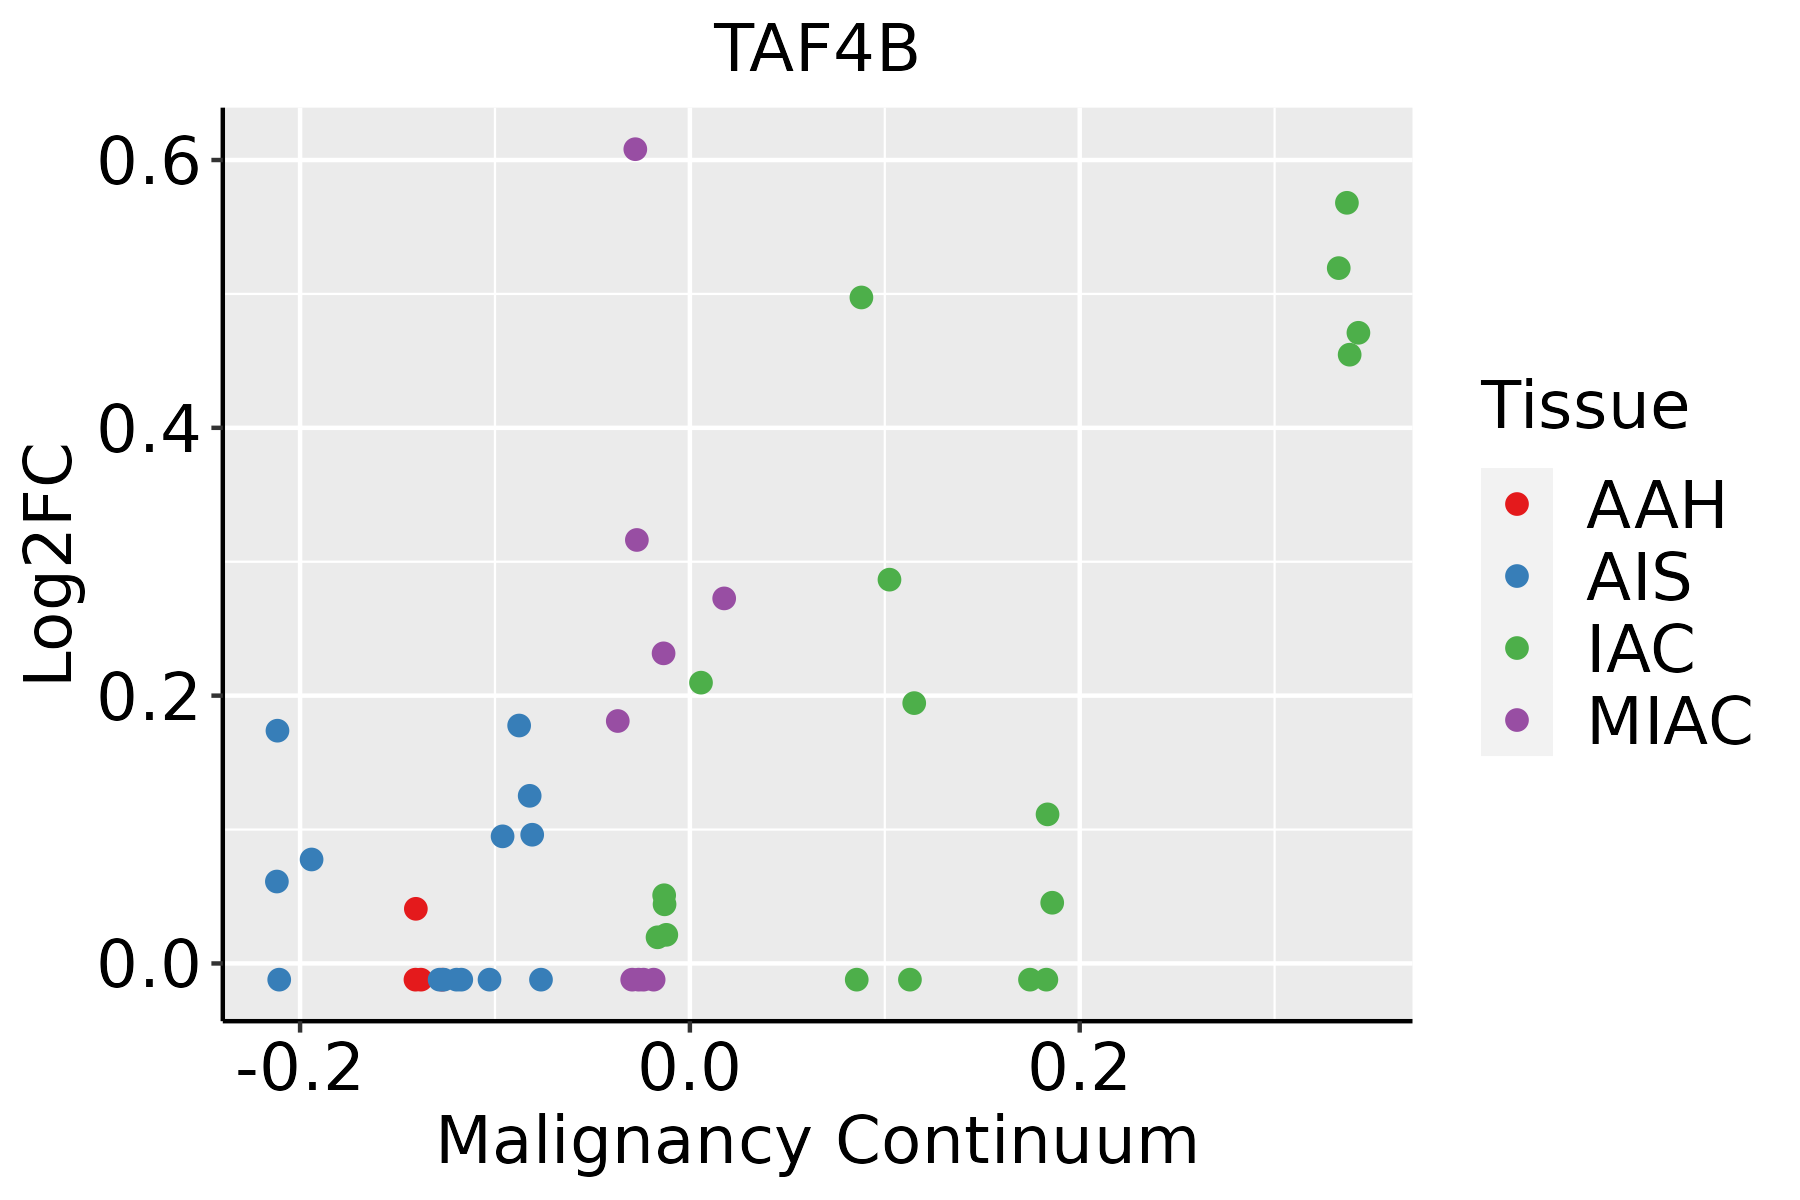 | AAH: Atypical adenomatous hyperplasia |
| AIS: Adenocarcinoma in situ | ||
| IAC: Invasive lung adenocarcinoma | ||
| MIA: Minimally invasive adenocarcinoma | ||
| Skin | 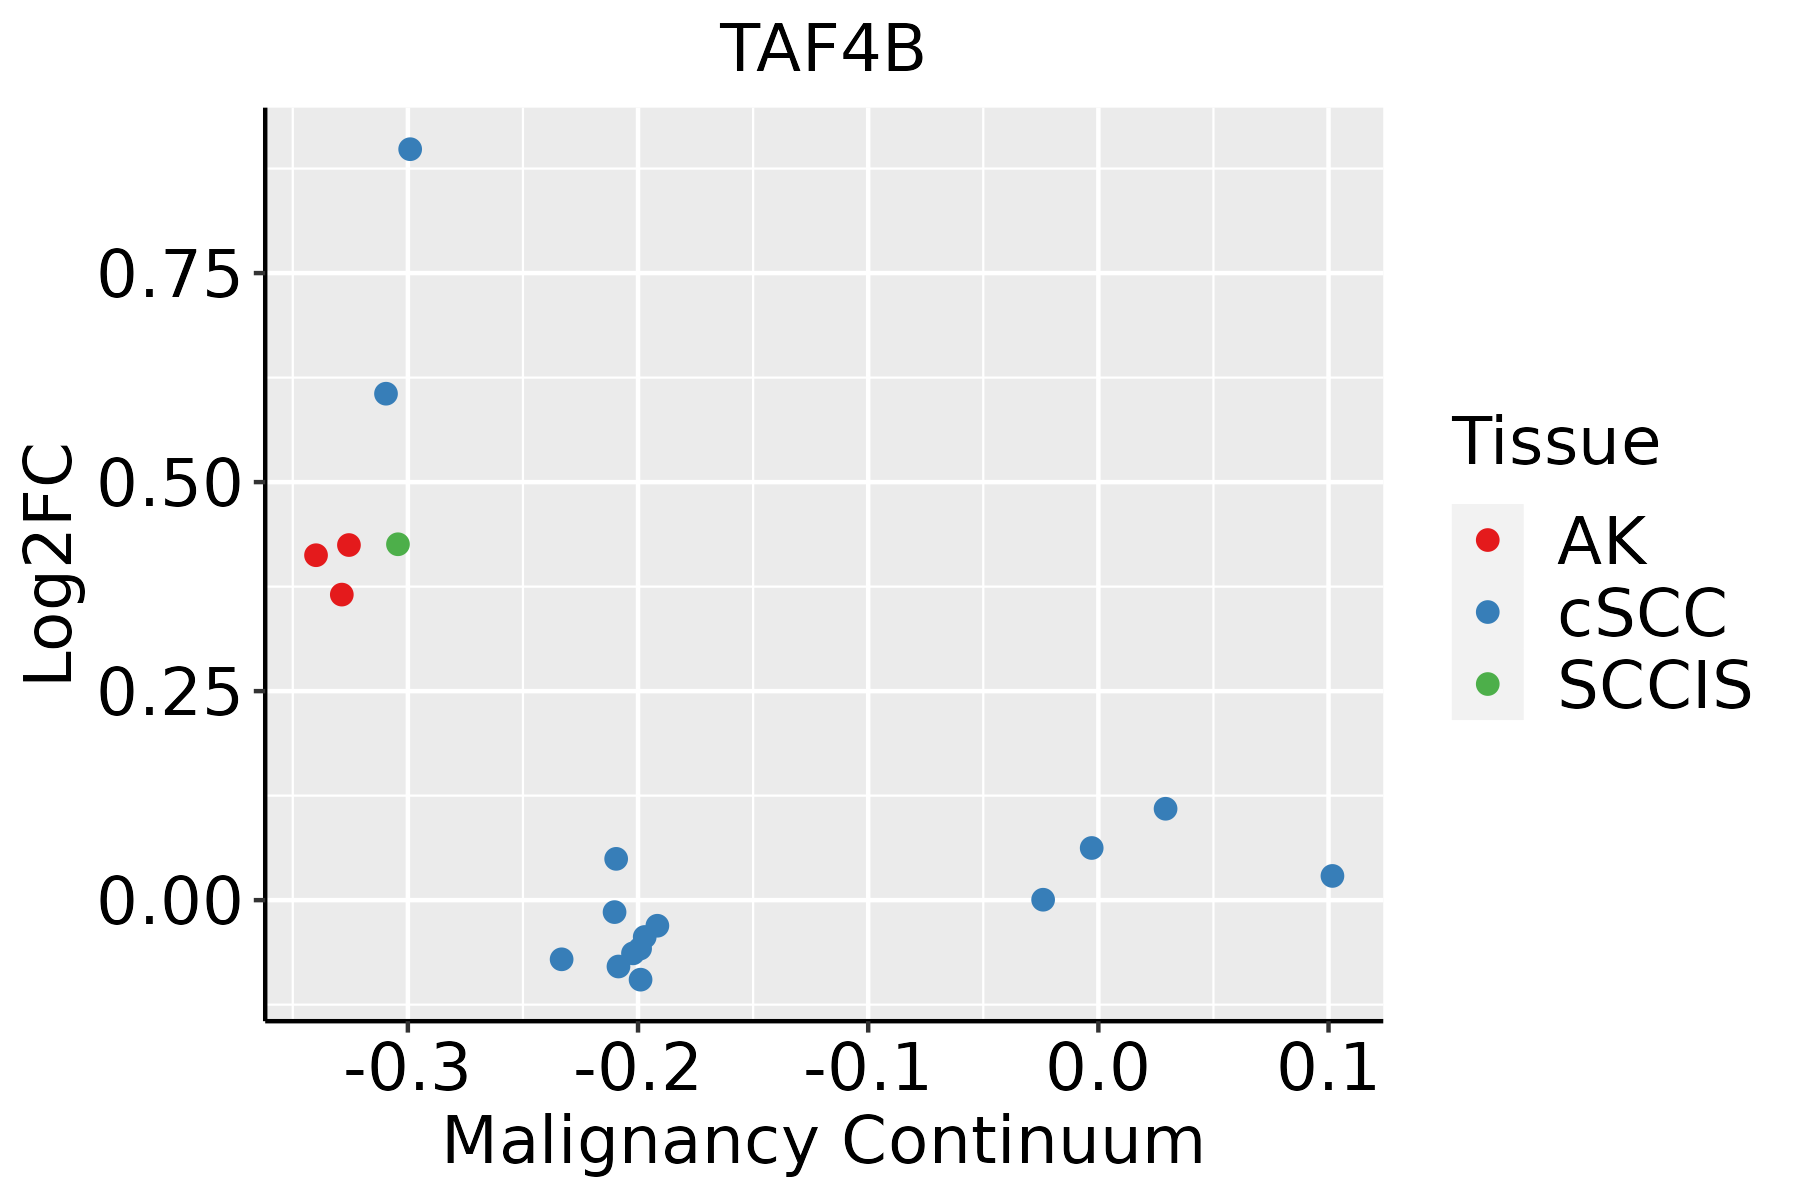 | AK: Actinic keratosis |
| cSCC: Cutaneous squamous cell carcinoma | ||
| SCCIS:squamous cell carcinoma in situ |
| ∗log2FC in expression of this searched gene in stem-like cells from each diseased tissue sample relative to stem-like cells in normal samples in each tissue plotted against the malignancy continuum. Samples are colored based on if they are from different disease stage. |
Top |
Malignant transformation related pathway analysis |
| Find out the enriched GO biological processes and KEGG pathways involved in transition from healthy to precancer to cancer |
| Tissue | Disease Stage | Enriched GO biological Processes |
| Colorectum | AD |  |
| Colorectum | SER |  |
| Colorectum | MSS |  |
| Colorectum | MSI-H |  |
| Colorectum | FAP |  |
| ∗Top 15 enriched GO BP terms are showed in the bar plot of each disease state in each tissue. Each row represents a significant GO biological process which is colored according to the -log10(p.adjust). |
| Page: 1 2 3 4 5 6 7 8 9 |
| GO ID | Tissue | Disease Stage | Description | Gene Ratio | Bg Ratio | pvalue | p.adjust | Count |
| GO:00063673 | Esophagus | ESCC | transcription initiation from RNA polymerase II promoter | 56/8552 | 77/18723 | 1.30e-06 | 1.59e-05 | 56 |
| GO:000635211 | Esophagus | ESCC | DNA-templated transcription, initiation | 86/8552 | 130/18723 | 1.88e-06 | 2.19e-05 | 86 |
| GO:00063524 | Skin | AK | DNA-templated transcription, initiation | 23/1910 | 130/18723 | 6.10e-03 | 3.29e-02 | 23 |
| GO:000635212 | Skin | cSCC | DNA-templated transcription, initiation | 57/4864 | 130/18723 | 7.28e-06 | 1.01e-04 | 57 |
| GO:00063674 | Skin | cSCC | transcription initiation from RNA polymerase II promoter | 37/4864 | 77/18723 | 2.53e-05 | 2.87e-04 | 37 |
| Page: 1 |
| Pathway ID | Tissue | Disease Stage | Description | Gene Ratio | Bg Ratio | pvalue | p.adjust | qvalue | Count |
| hsa0501620 | Endometrium | AEH | Huntington disease | 118/1197 | 306/8465 | 3.00e-27 | 2.44e-25 | 1.78e-25 | 118 |
| hsa05016110 | Endometrium | AEH | Huntington disease | 118/1197 | 306/8465 | 3.00e-27 | 2.44e-25 | 1.78e-25 | 118 |
| hsa0501625 | Endometrium | EEC | Huntington disease | 120/1237 | 306/8465 | 3.86e-27 | 4.23e-25 | 3.15e-25 | 120 |
| hsa0501635 | Endometrium | EEC | Huntington disease | 120/1237 | 306/8465 | 3.86e-27 | 4.23e-25 | 3.15e-25 | 120 |
| hsa05016210 | Esophagus | ESCC | Huntington disease | 226/4205 | 306/8465 | 1.38e-18 | 8.72e-17 | 4.46e-17 | 226 |
| hsa0501638 | Esophagus | ESCC | Huntington disease | 226/4205 | 306/8465 | 1.38e-18 | 8.72e-17 | 4.46e-17 | 226 |
| Page: 1 |
Top |
Cell-cell communication analysis |
| Identification of potential cell-cell interactions between two cell types and their ligand-receptor pairs for different disease states |
| Ligand | Receptor | LRpair | Pathway | Tissue | Disease Stage |
| Page: 1 |
Top |
Single-cell gene regulatory network inference analysis |
| Find out the significant the regulons (TFs) and the target genes of each regulon across cell types for different disease states |
| TF | Cell Type | Tissue | Disease Stage | Target Gene | RSS | Regulon Activity |
| ∗The dot plots of a searched regulon are shown for all cell subpopulations in each disease state of each tissue based on the regulon specific score inferred using pySCENIC and by calculating the average expression. |
| Page: 1 |
Top |
Somatic mutation of malignant transformation related genes |
| Annotation of somatic variants for genes involved in malignant transformation |
| Hugo Symbol | Variant Class | Variant Classification | dbSNP RS | HGVSc | HGVSp | HGVSp Short | SWISSPROT | BIOTYPE | SIFT | PolyPhen | Tumor Sample Barcode | Tissue | Histology | Sex | Age | Stage | Therapy Types | Drugs | Outcome |
| TAF4B | SNV | Missense_Mutation | c.445N>T | p.Ala149Ser | p.A149S | protein_coding | tolerated(0.33) | benign(0.044) | TCGA-A2-A25A-01 | Breast | breast invasive carcinoma | Female | <65 | I/II | Unspecific | Cytoxan | SD | ||
| TAF4B | SNV | Missense_Mutation | c.1738N>T | p.Pro580Ser | p.P580S | protein_coding | tolerated(0.15) | benign(0.021) | TCGA-AN-A0FN-01 | Breast | breast invasive carcinoma | Female | <65 | I/II | Unknown | Unknown | SD | ||
| TAF4B | SNV | Missense_Mutation | c.2282N>G | p.Ser761Cys | p.S761C | protein_coding | deleterious(0.03) | benign(0.105) | TCGA-AR-A1AV-01 | Breast | breast invasive carcinoma | Male | >=65 | I/II | Chemotherapy | cytoxan | SD | ||
| TAF4B | SNV | Missense_Mutation | rs567210583 | c.544N>T | p.Ala182Ser | p.A182S | protein_coding | tolerated(0.41) | benign(0.03) | TCGA-B6-A0WX-01 | Breast | breast invasive carcinoma | Female | <65 | III/IV | Unknown | Unknown | PD | |
| TAF4B | SNV | Missense_Mutation | rs202073070 | c.758N>T | p.Pro253Leu | p.P253L | protein_coding | deleterious(0.05) | benign(0.045) | TCGA-BH-A0HF-01 | Breast | breast invasive carcinoma | Female | >=65 | I/II | Hormone Therapy | arimidex | SD | |
| TAF4B | SNV | Missense_Mutation | novel | c.1820T>C | p.Ile607Thr | p.I607T | protein_coding | deleterious(0) | benign(0.253) | TCGA-BH-A8FY-01 | Breast | breast invasive carcinoma | Female | >=65 | I/II | Unknown | Unknown | SD | |
| TAF4B | SNV | Missense_Mutation | novel | c.2245N>A | p.Glu749Lys | p.E749K | protein_coding | deleterious(0) | probably_damaging(0.995) | TCGA-PE-A5DE-01 | Breast | breast invasive carcinoma | Female | <65 | I/II | Chemotherapy | taxotere | CR | |
| TAF4B | insertion | Frame_Shift_Ins | novel | c.2108_2109insTATAGAC | p.Lys703AsnfsTer19 | p.K703Nfs*19 | protein_coding | TCGA-A7-A26I-01 | Breast | breast invasive carcinoma | Female | >=65 | I/II | Chemotherapy | cytoxan | SD | |||
| TAF4B | deletion | In_Frame_Del | novel | c.1003_1005delNNN | p.Pro335del | p.P335del | protein_coding | TCGA-AC-A3W5-01 | Breast | breast invasive carcinoma | Female | >=65 | I/II | Chemotherapy | docetaxel | CR | |||
| TAF4B | SNV | Missense_Mutation | c.1948N>A | p.Leu650Ile | p.L650I | protein_coding | tolerated(0.15) | benign(0.06) | TCGA-2W-A8YY-01 | Cervix | cervical & endocervical cancer | Female | <65 | I/II | Chemotherapy | cisplatin | CR |
| Page: 1 2 3 4 5 6 7 8 |
Top |
Related drugs of malignant transformation related genes |
| Identification of chemicals and drugs interact with genes involved in malignant transfromation |
| (DGIdb 4.0) |
| Entrez ID | Symbol | Category | Interaction Types | Drug Claim Name | Drug Name | PMIDs |
| Page: 1 |

Copyright 2023-Present -The University of Texas Health Science Center at Houston |