
|
|||||
|
 | |
| |
| |
| |
| |
| |
|
Gene: TAF2 |
Gene summary for TAF2 |
| Gene information | Species | Human | Gene symbol | TAF2 | Gene ID | 6873 |
| Gene name | TATA-box binding protein associated factor 2 | |
| Gene Alias | CIF150 | |
| Cytomap | 8q24.12 | |
| Gene Type | protein-coding | GO ID | GO:0000086 | UniProtAcc | B3KMD8 |
Top |
Malignant transformation analysis |
| Identification of the aberrant gene expression in precancerous and cancerous lesions by comparing the gene expression of stem-like cells in diseased tissues with normal stem cells |
| Entrez ID | Symbol | Replicates | Species | Organ | Tissue | Adj P-value | Log2FC | Malignancy |
| 6873 | TAF2 | CCI_1 | Human | Cervix | CC | 3.01e-04 | 5.02e-01 | 0.528 |
| 6873 | TAF2 | CCI_2 | Human | Cervix | CC | 7.07e-12 | 1.34e+00 | 0.5249 |
| 6873 | TAF2 | CCI_3 | Human | Cervix | CC | 6.44e-06 | 5.52e-01 | 0.516 |
| 6873 | TAF2 | LZE4T | Human | Esophagus | ESCC | 6.38e-16 | 5.20e-01 | 0.0811 |
| 6873 | TAF2 | LZE5T | Human | Esophagus | ESCC | 6.91e-05 | 3.16e-01 | 0.0514 |
| 6873 | TAF2 | LZE7T | Human | Esophagus | ESCC | 4.07e-13 | 4.19e-01 | 0.0667 |
| 6873 | TAF2 | LZE8T | Human | Esophagus | ESCC | 3.98e-11 | 2.44e-01 | 0.067 |
| 6873 | TAF2 | LZE20T | Human | Esophagus | ESCC | 6.93e-05 | 2.19e-01 | 0.0662 |
| 6873 | TAF2 | LZE24T | Human | Esophagus | ESCC | 3.86e-19 | 4.39e-01 | 0.0596 |
| 6873 | TAF2 | LZE6T | Human | Esophagus | ESCC | 3.17e-05 | 1.93e-01 | 0.0845 |
| 6873 | TAF2 | P1T-E | Human | Esophagus | ESCC | 1.21e-08 | 3.09e-01 | 0.0875 |
| 6873 | TAF2 | P2T-E | Human | Esophagus | ESCC | 7.25e-30 | 4.32e-01 | 0.1177 |
| 6873 | TAF2 | P4T-E | Human | Esophagus | ESCC | 5.55e-18 | 3.54e-01 | 0.1323 |
| 6873 | TAF2 | P5T-E | Human | Esophagus | ESCC | 5.13e-17 | 3.55e-01 | 0.1327 |
| 6873 | TAF2 | P8T-E | Human | Esophagus | ESCC | 4.04e-17 | 2.87e-01 | 0.0889 |
| 6873 | TAF2 | P9T-E | Human | Esophagus | ESCC | 4.67e-10 | 1.74e-01 | 0.1131 |
| 6873 | TAF2 | P10T-E | Human | Esophagus | ESCC | 5.15e-22 | 3.67e-01 | 0.116 |
| 6873 | TAF2 | P11T-E | Human | Esophagus | ESCC | 1.61e-08 | 3.29e-01 | 0.1426 |
| 6873 | TAF2 | P12T-E | Human | Esophagus | ESCC | 6.10e-27 | 5.37e-01 | 0.1122 |
| 6873 | TAF2 | P15T-E | Human | Esophagus | ESCC | 2.66e-22 | 4.53e-01 | 0.1149 |
| Page: 1 2 3 4 5 6 |
| Tissue | Expression Dynamics | Abbreviation |
| Cervix | 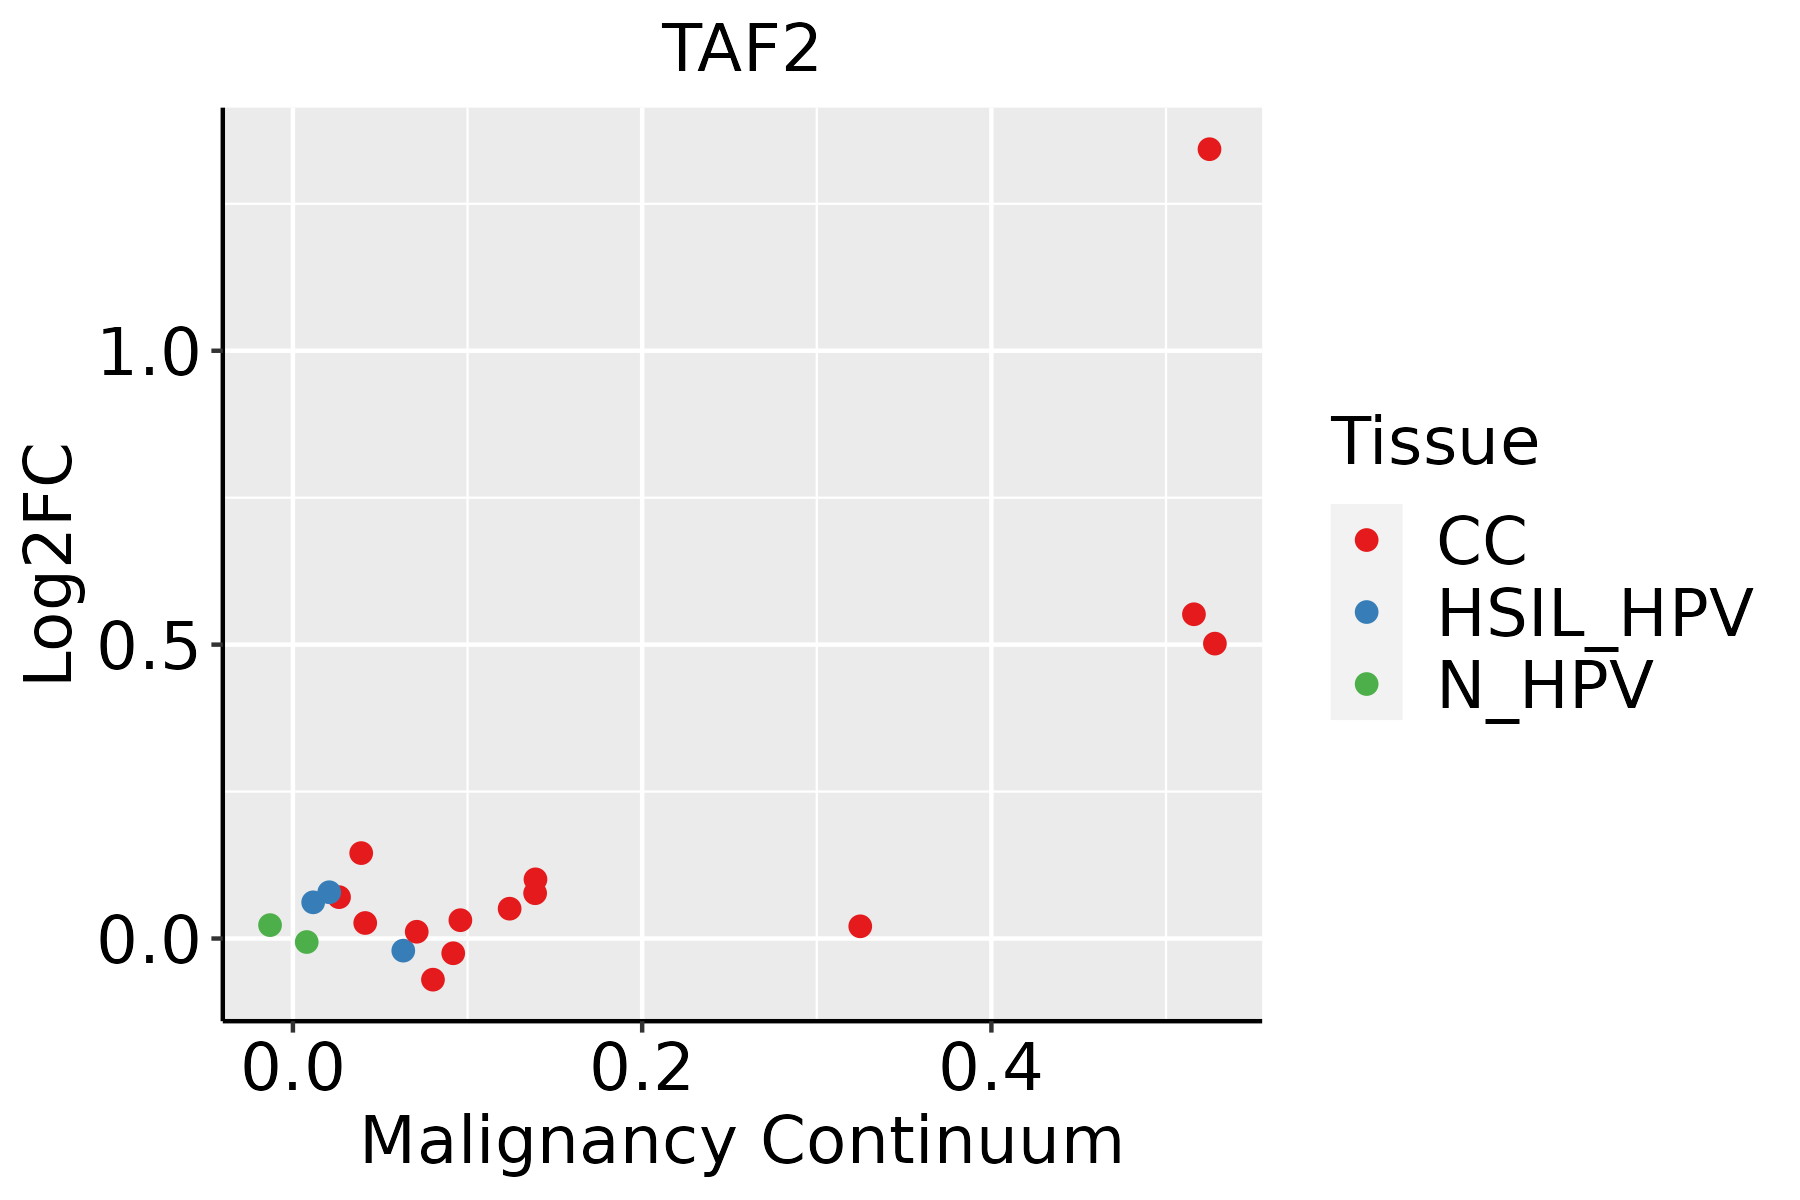 | CC: Cervix cancer |
| HSIL_HPV: HPV-infected high-grade squamous intraepithelial lesions | ||
| N_HPV: HPV-infected normal cervix | ||
| Esophagus | 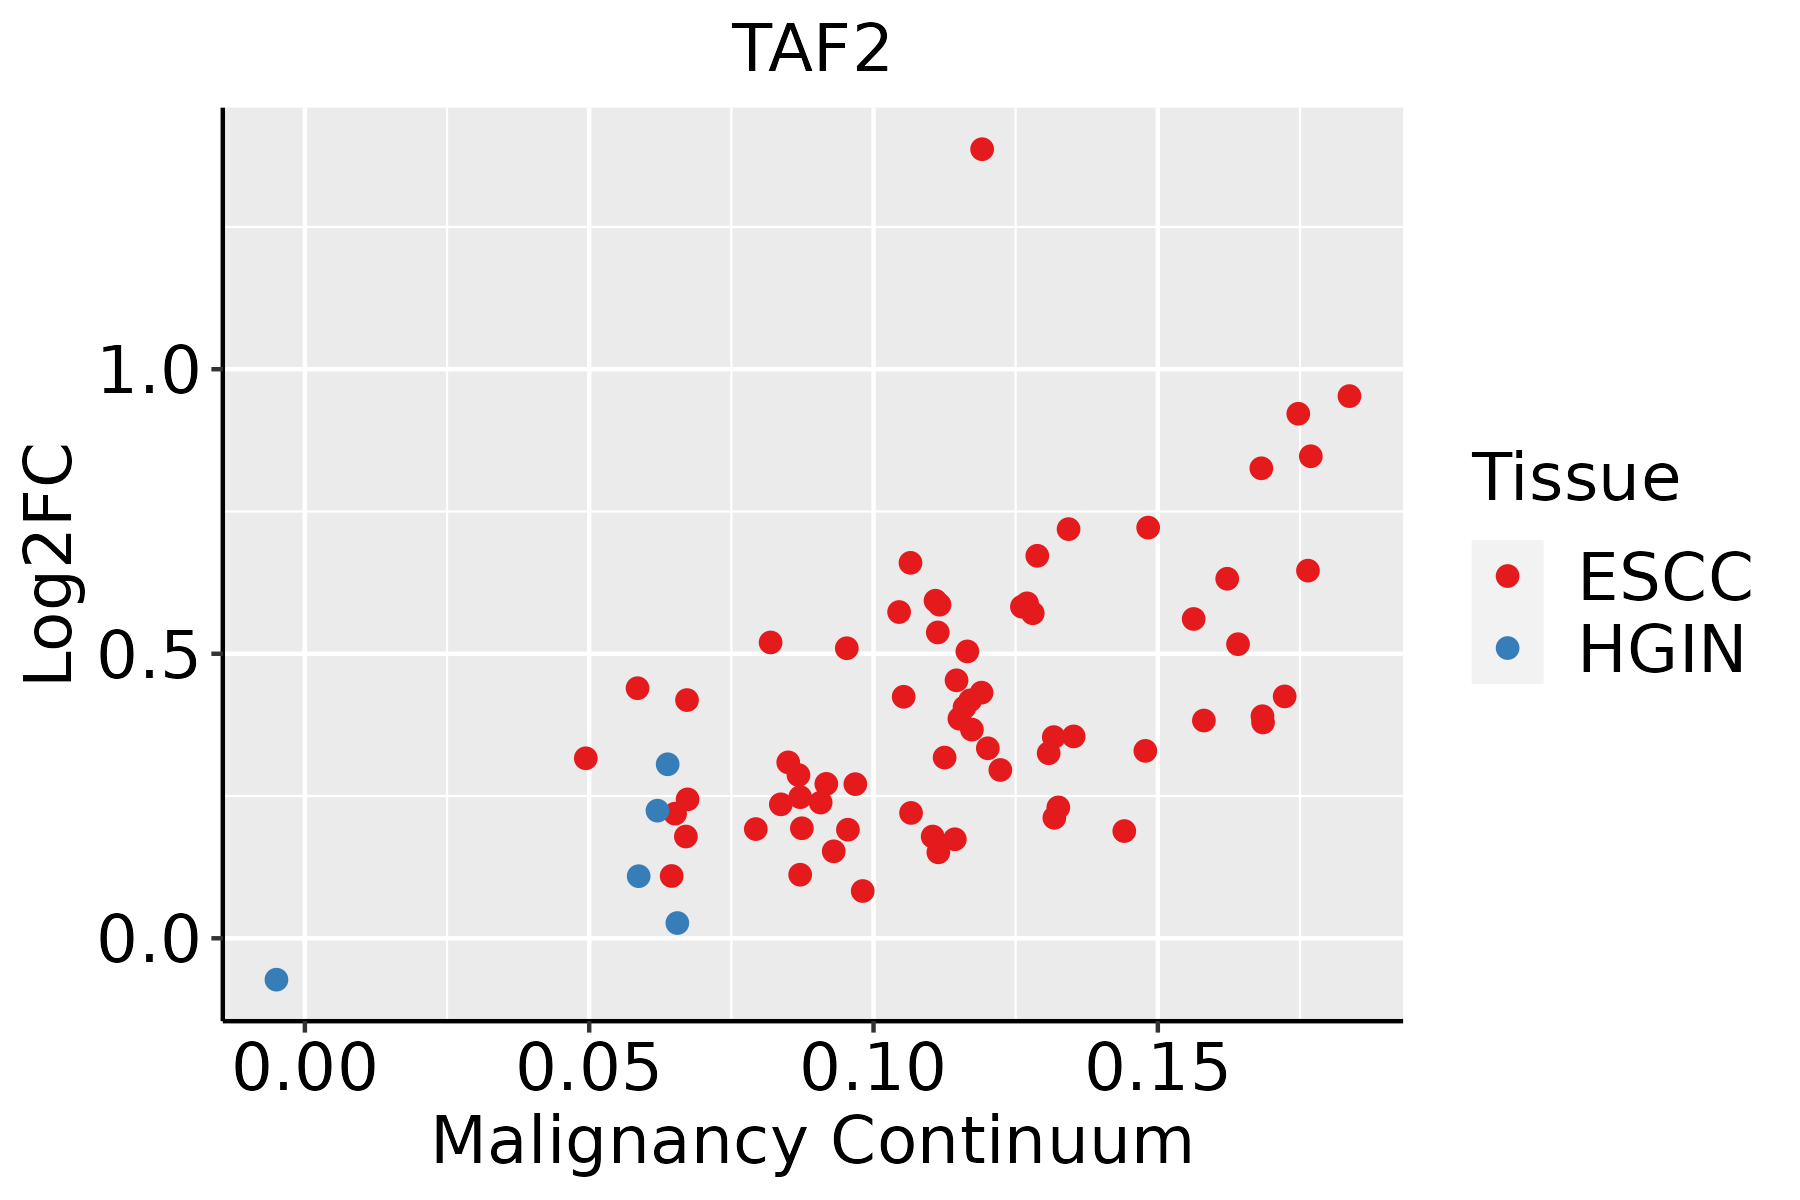 | ESCC: Esophageal squamous cell carcinoma |
| HGIN: High-grade intraepithelial neoplasias | ||
| LGIN: Low-grade intraepithelial neoplasias | ||
| Liver |  | HCC: Hepatocellular carcinoma |
| NAFLD: Non-alcoholic fatty liver disease | ||
| Lung | 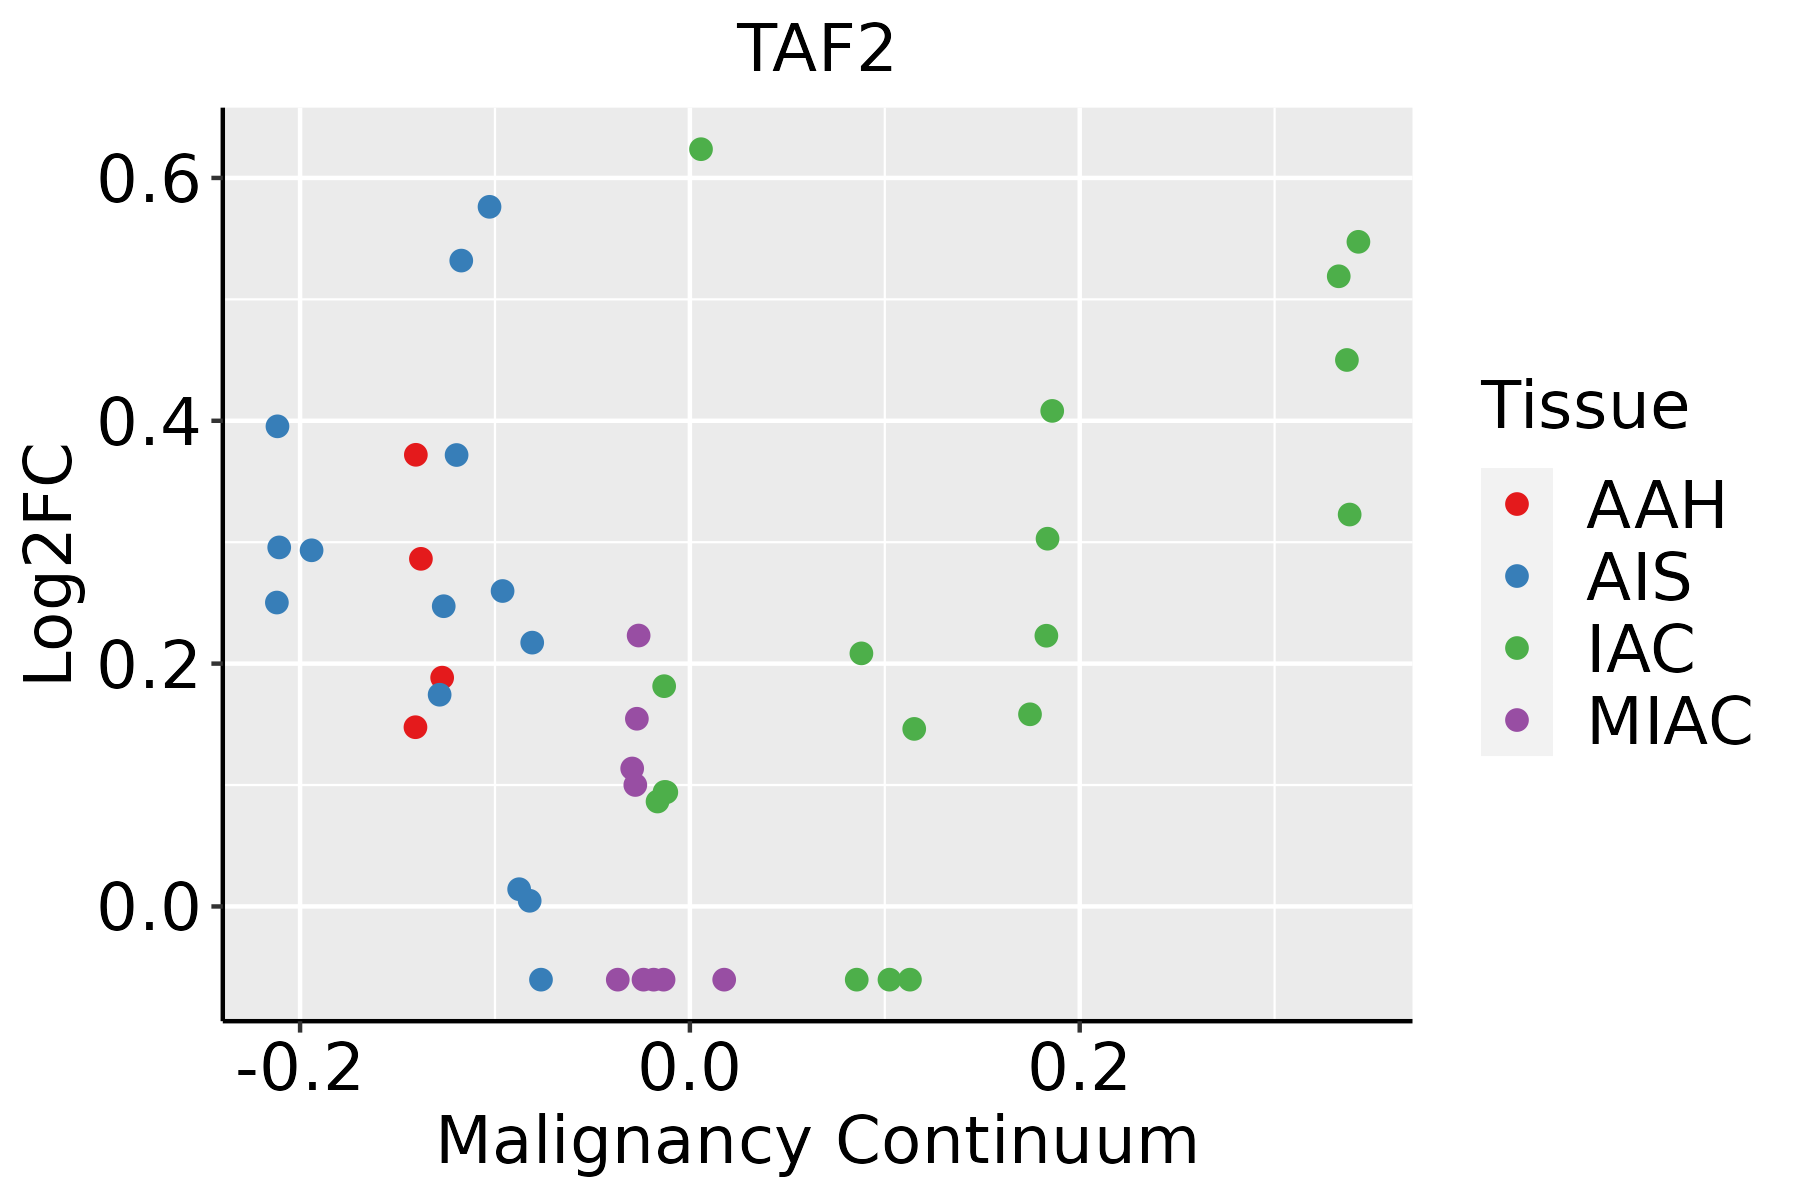 | AAH: Atypical adenomatous hyperplasia |
| AIS: Adenocarcinoma in situ | ||
| IAC: Invasive lung adenocarcinoma | ||
| MIA: Minimally invasive adenocarcinoma | ||
| Oral Cavity | 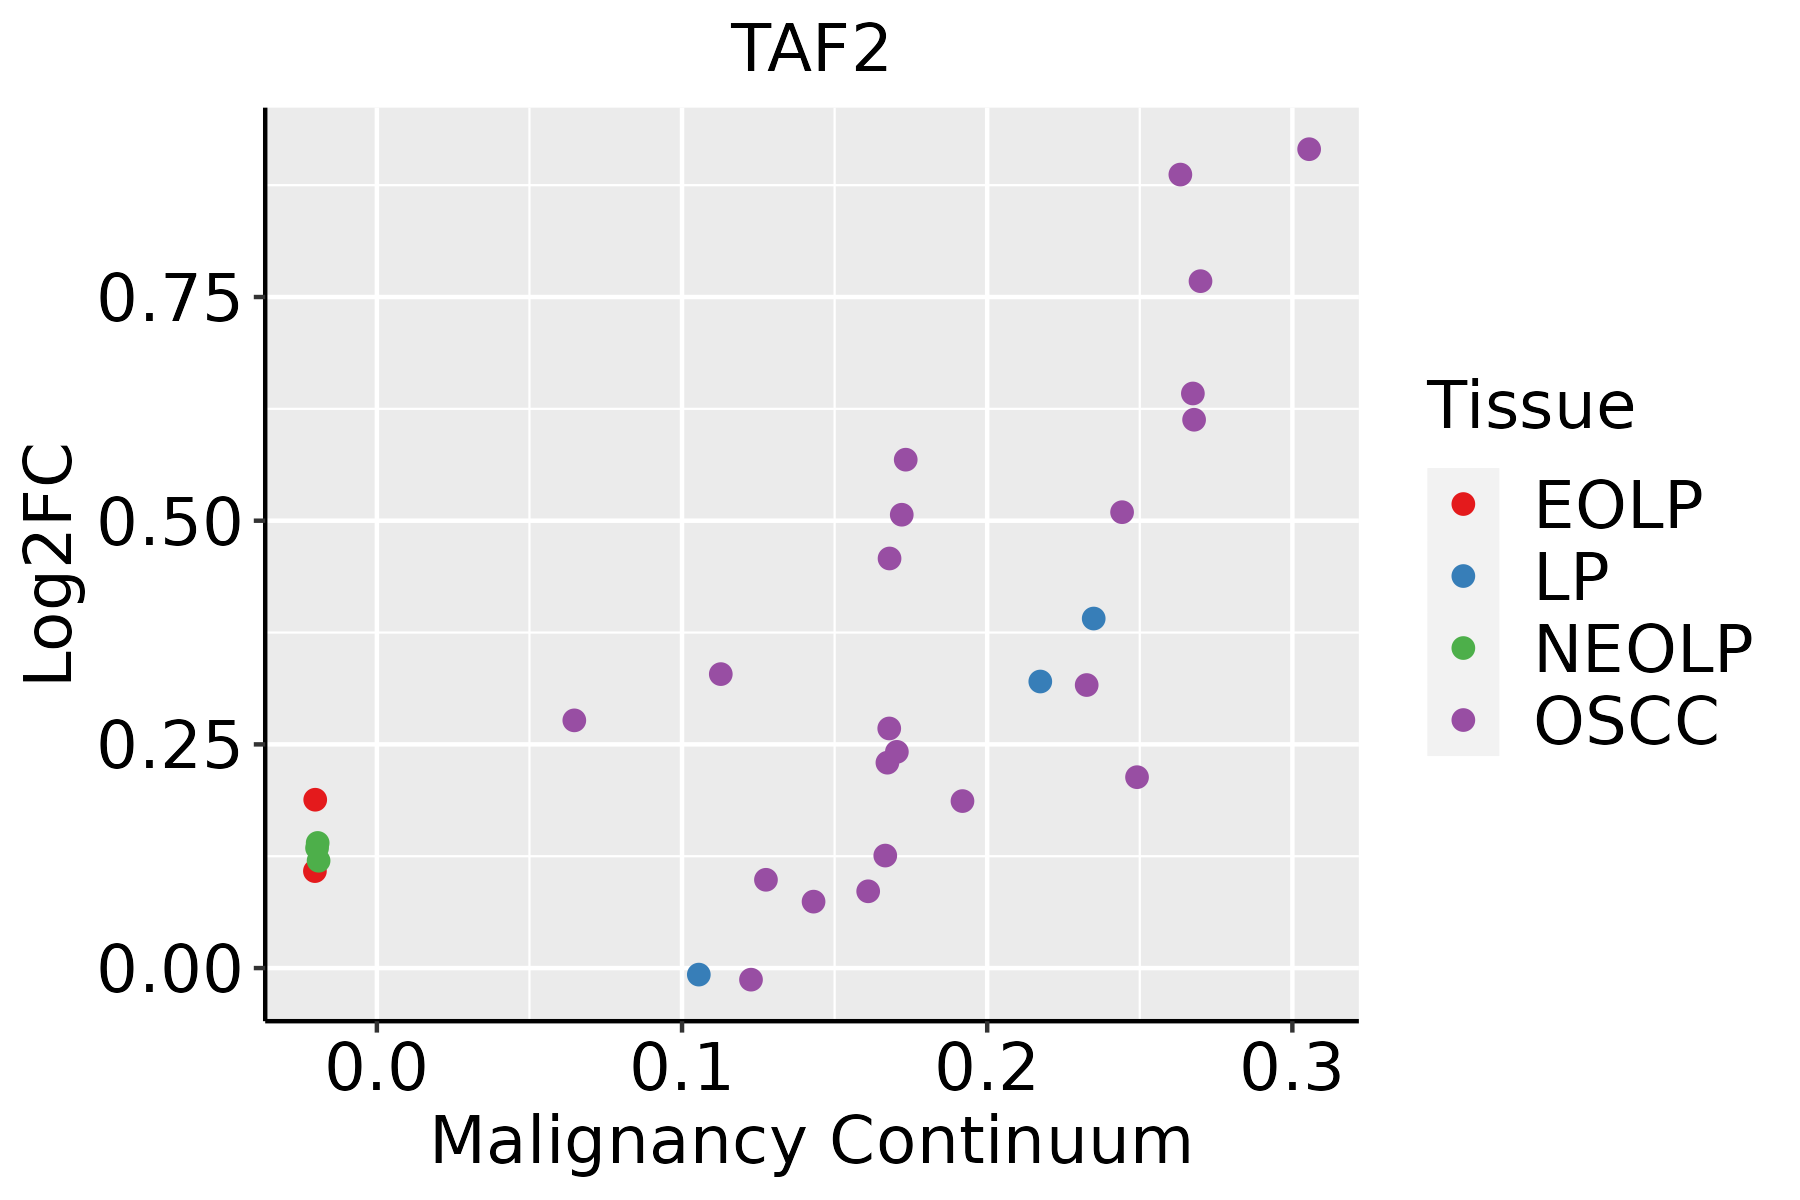 | EOLP: Erosive Oral lichen planus |
| LP: leukoplakia | ||
| NEOLP: Non-erosive oral lichen planus | ||
| OSCC: Oral squamous cell carcinoma | ||
| Skin | 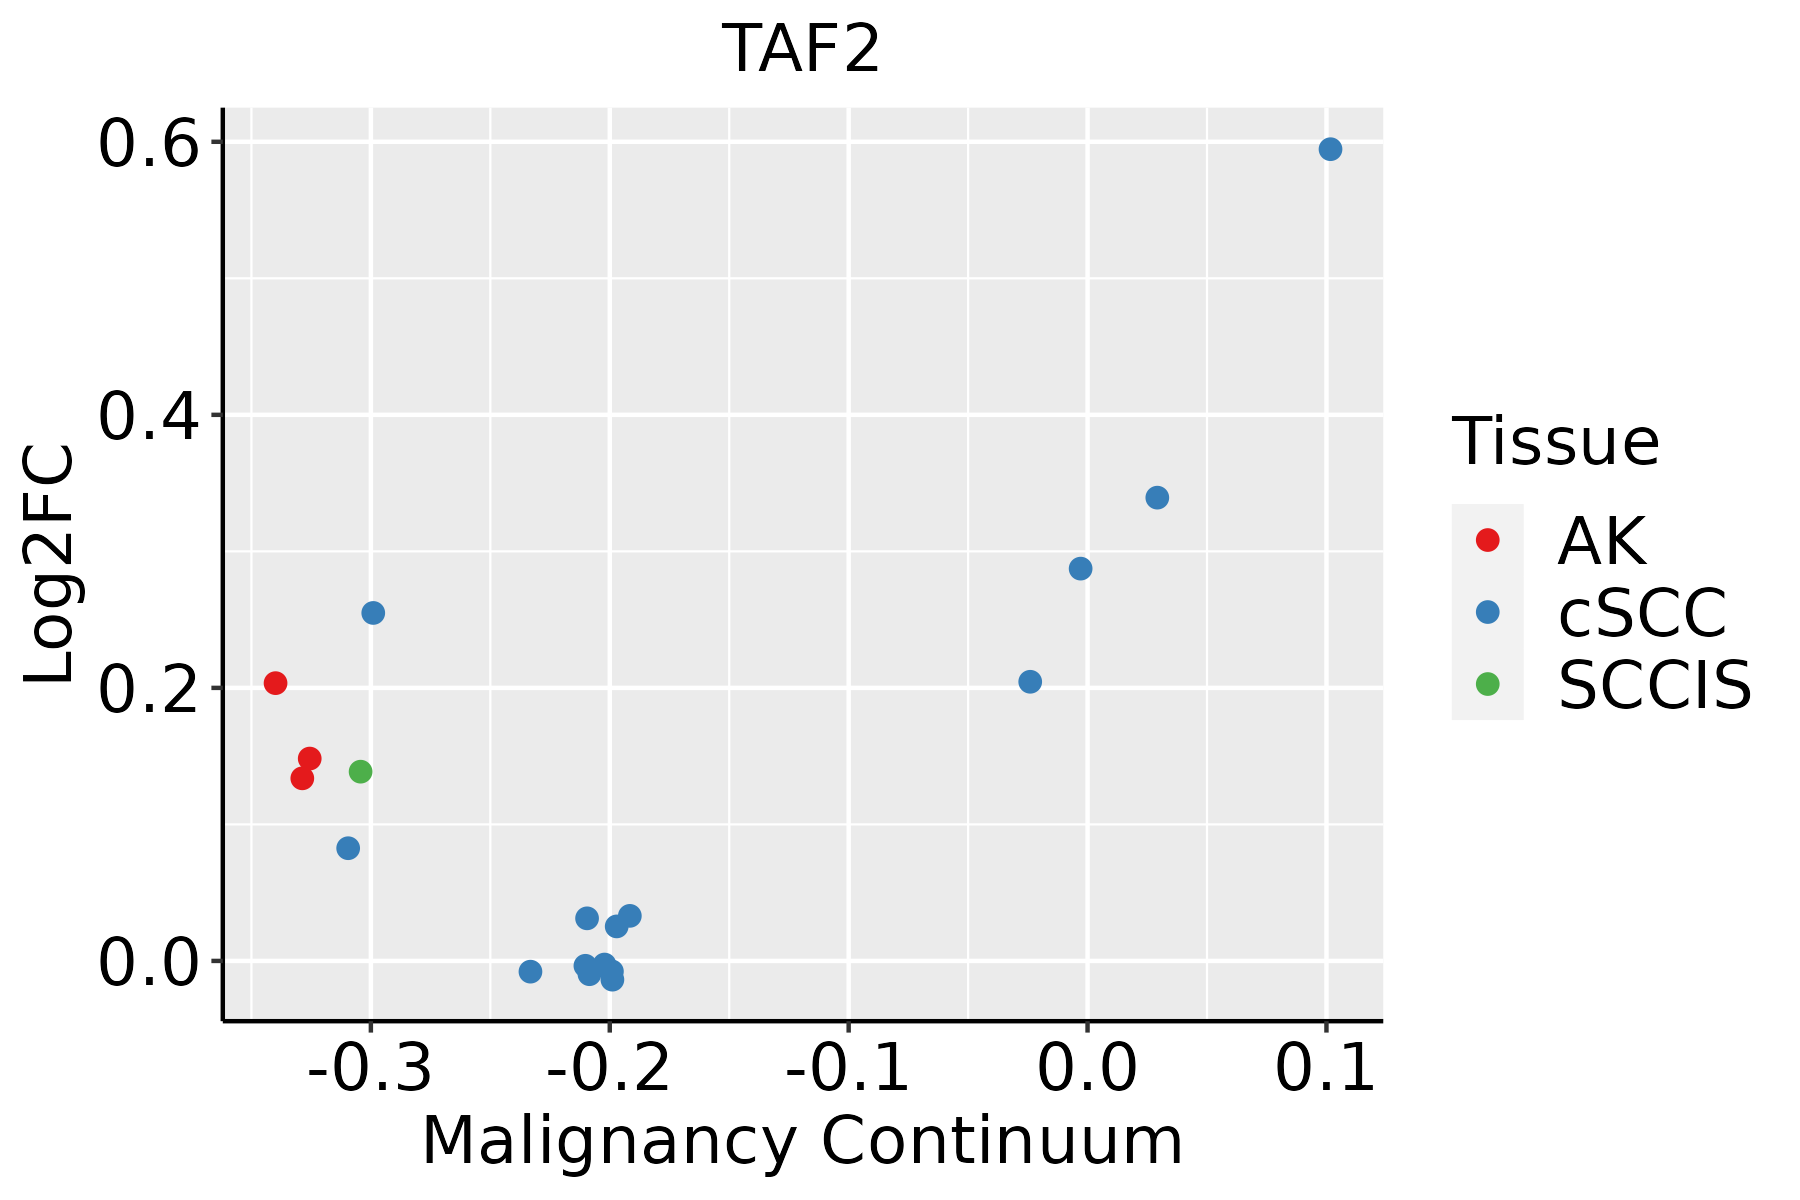 | AK: Actinic keratosis |
| cSCC: Cutaneous squamous cell carcinoma | ||
| SCCIS:squamous cell carcinoma in situ |
| ∗log2FC in expression of this searched gene in stem-like cells from each diseased tissue sample relative to stem-like cells in normal samples in each tissue plotted against the malignancy continuum. Samples are colored based on if they are from different disease stage. |
Top |
Malignant transformation related pathway analysis |
| Find out the enriched GO biological processes and KEGG pathways involved in transition from healthy to precancer to cancer |
| Tissue | Disease Stage | Enriched GO biological Processes |
| Colorectum | AD |  |
| Colorectum | SER |  |
| Colorectum | MSS |  |
| Colorectum | MSI-H |  |
| Colorectum | FAP |  |
| ∗Top 15 enriched GO BP terms are showed in the bar plot of each disease state in each tissue. Each row represents a significant GO biological process which is colored according to the -log10(p.adjust). |
| Page: 1 2 3 4 5 6 7 8 9 |
| GO ID | Tissue | Disease Stage | Description | Gene Ratio | Bg Ratio | pvalue | p.adjust | Count |
| GO:00447725 | Cervix | CC | mitotic cell cycle phase transition | 89/2311 | 424/18723 | 2.70e-07 | 1.12e-05 | 89 |
| GO:00448392 | Cervix | CC | cell cycle G2/M phase transition | 31/2311 | 148/18723 | 2.07e-03 | 1.51e-02 | 31 |
| GO:00000862 | Cervix | CC | G2/M transition of mitotic cell cycle | 29/2311 | 137/18723 | 2.40e-03 | 1.70e-02 | 29 |
| GO:004477216 | Esophagus | ESCC | mitotic cell cycle phase transition | 281/8552 | 424/18723 | 4.63e-18 | 4.45e-16 | 281 |
| GO:00448394 | Esophagus | ESCC | cell cycle G2/M phase transition | 103/8552 | 148/18723 | 3.09e-09 | 6.67e-08 | 103 |
| GO:00000864 | Esophagus | ESCC | G2/M transition of mitotic cell cycle | 96/8552 | 137/18723 | 6.00e-09 | 1.23e-07 | 96 |
| GO:00063673 | Esophagus | ESCC | transcription initiation from RNA polymerase II promoter | 56/8552 | 77/18723 | 1.30e-06 | 1.59e-05 | 56 |
| GO:000635211 | Esophagus | ESCC | DNA-templated transcription, initiation | 86/8552 | 130/18723 | 1.88e-06 | 2.19e-05 | 86 |
| GO:0044772 | Liver | NAFLD | mitotic cell cycle phase transition | 67/1882 | 424/18723 | 1.25e-04 | 2.39e-03 | 67 |
| GO:00447722 | Liver | HCC | mitotic cell cycle phase transition | 240/7958 | 424/18723 | 2.47e-09 | 6.84e-08 | 240 |
| GO:00063671 | Liver | HCC | transcription initiation from RNA polymerase II promoter | 52/7958 | 77/18723 | 7.87e-06 | 9.27e-05 | 52 |
| GO:0006352 | Liver | HCC | DNA-templated transcription, initiation | 78/7958 | 130/18723 | 4.19e-05 | 4.11e-04 | 78 |
| GO:0000086 | Liver | HCC | G2/M transition of mitotic cell cycle | 75/7958 | 137/18723 | 2.52e-03 | 1.22e-02 | 75 |
| GO:0044839 | Liver | HCC | cell cycle G2/M phase transition | 79/7958 | 148/18723 | 4.82e-03 | 2.03e-02 | 79 |
| GO:00447723 | Lung | IAC | mitotic cell cycle phase transition | 85/2061 | 424/18723 | 2.69e-08 | 3.20e-06 | 85 |
| GO:00448391 | Lung | IAC | cell cycle G2/M phase transition | 29/2061 | 148/18723 | 1.44e-03 | 1.55e-02 | 29 |
| GO:00000861 | Lung | IAC | G2/M transition of mitotic cell cycle | 27/2061 | 137/18723 | 1.88e-03 | 1.92e-02 | 27 |
| GO:004477211 | Lung | AIS | mitotic cell cycle phase transition | 69/1849 | 424/18723 | 2.23e-05 | 7.42e-04 | 69 |
| GO:00447728 | Oral cavity | OSCC | mitotic cell cycle phase transition | 255/7305 | 424/18723 | 5.29e-19 | 6.98e-17 | 255 |
| GO:00000863 | Oral cavity | OSCC | G2/M transition of mitotic cell cycle | 84/7305 | 137/18723 | 9.99e-08 | 1.70e-06 | 84 |
| Page: 1 2 |
| Pathway ID | Tissue | Disease Stage | Description | Gene Ratio | Bg Ratio | pvalue | p.adjust | qvalue | Count |
| hsa030222 | Esophagus | ESCC | Basal transcription factors | 35/4205 | 45/8465 | 1.01e-04 | 4.06e-04 | 2.08e-04 | 35 |
| hsa0302211 | Esophagus | ESCC | Basal transcription factors | 35/4205 | 45/8465 | 1.01e-04 | 4.06e-04 | 2.08e-04 | 35 |
| hsa03022 | Oral cavity | OSCC | Basal transcription factors | 28/3704 | 45/8465 | 9.53e-03 | 2.11e-02 | 1.08e-02 | 28 |
| hsa030221 | Oral cavity | OSCC | Basal transcription factors | 28/3704 | 45/8465 | 9.53e-03 | 2.11e-02 | 1.08e-02 | 28 |
| Page: 1 |
Top |
Cell-cell communication analysis |
| Identification of potential cell-cell interactions between two cell types and their ligand-receptor pairs for different disease states |
| Ligand | Receptor | LRpair | Pathway | Tissue | Disease Stage |
| Page: 1 |
Top |
Single-cell gene regulatory network inference analysis |
| Find out the significant the regulons (TFs) and the target genes of each regulon across cell types for different disease states |
| TF | Cell Type | Tissue | Disease Stage | Target Gene | RSS | Regulon Activity |
| ∗The dot plots of a searched regulon are shown for all cell subpopulations in each disease state of each tissue based on the regulon specific score inferred using pySCENIC and by calculating the average expression. |
| Page: 1 |
Top |
Somatic mutation of malignant transformation related genes |
| Annotation of somatic variants for genes involved in malignant transformation |
| Hugo Symbol | Variant Class | Variant Classification | dbSNP RS | HGVSc | HGVSp | HGVSp Short | SWISSPROT | BIOTYPE | SIFT | PolyPhen | Tumor Sample Barcode | Tissue | Histology | Sex | Age | Stage | Therapy Types | Drugs | Outcome |
| TAF2 | SNV | Missense_Mutation | novel | c.354C>A | p.Asp118Glu | p.D118E | Q6P1X5 | protein_coding | tolerated(0.1) | probably_damaging(0.928) | TCGA-AC-A23C-01 | Breast | breast invasive carcinoma | Female | <65 | I/II | Chemotherapy | chemo | CR |
| TAF2 | SNV | Missense_Mutation | c.3121N>G | p.Gln1041Glu | p.Q1041E | Q6P1X5 | protein_coding | tolerated_low_confidence(0.28) | benign(0.015) | TCGA-AC-A23H-01 | Breast | breast invasive carcinoma | Female | >=65 | I/II | Unknown | Unknown | PD | |
| TAF2 | SNV | Missense_Mutation | novel | c.2371N>T | p.Asp791Tyr | p.D791Y | Q6P1X5 | protein_coding | deleterious(0) | probably_damaging(0.984) | TCGA-AC-A3QQ-01 | Breast | breast invasive carcinoma | Female | <65 | I/II | Unknown | Unknown | SD |
| TAF2 | SNV | Missense_Mutation | novel | c.3119N>A | p.Ser1040Tyr | p.S1040Y | Q6P1X5 | protein_coding | tolerated_low_confidence(0.24) | benign(0.094) | TCGA-AN-A046-01 | Breast | breast invasive carcinoma | Female | >=65 | I/II | Unknown | Unknown | SD |
| TAF2 | SNV | Missense_Mutation | novel | c.721N>T | p.Pro241Ser | p.P241S | Q6P1X5 | protein_coding | deleterious(0) | probably_damaging(1) | TCGA-AN-A046-01 | Breast | breast invasive carcinoma | Female | >=65 | I/II | Unknown | Unknown | SD |
| TAF2 | SNV | Missense_Mutation | novel | c.1743N>G | p.Ile581Met | p.I581M | Q6P1X5 | protein_coding | deleterious(0) | probably_damaging(0.969) | TCGA-B6-A0RG-01 | Breast | breast invasive carcinoma | Female | <65 | I/II | Unknown | Unknown | SD |
| TAF2 | SNV | Missense_Mutation | rs780483670 | c.1234N>A | p.Val412Ile | p.V412I | Q6P1X5 | protein_coding | tolerated(1) | benign(0.026) | TCGA-BH-A0HF-01 | Breast | breast invasive carcinoma | Female | >=65 | I/II | Hormone Therapy | arimidex | SD |
| TAF2 | SNV | Missense_Mutation | novel | c.514N>A | p.Glu172Lys | p.E172K | Q6P1X5 | protein_coding | tolerated(0.12) | possibly_damaging(0.511) | TCGA-PE-A5DE-01 | Breast | breast invasive carcinoma | Female | <65 | I/II | Chemotherapy | taxotere | CR |
| TAF2 | insertion | Frame_Shift_Ins | novel | c.2368_2369insATAAGAA | p.Ser790TyrfsTer5 | p.S790Yfs*5 | Q6P1X5 | protein_coding | TCGA-AC-A3QQ-01 | Breast | breast invasive carcinoma | Female | <65 | I/II | Unknown | Unknown | SD | ||
| TAF2 | SNV | Missense_Mutation | rs557455884 | c.405G>C | p.Trp135Cys | p.W135C | Q6P1X5 | protein_coding | tolerated(0.15) | probably_damaging(0.935) | TCGA-VS-A8EK-01 | Cervix | cervical & endocervical cancer | Female | >=65 | I/II | Chemotherapy | cisplatin | PD |
| Page: 1 2 3 4 5 6 7 8 9 10 11 |
Top |
Related drugs of malignant transformation related genes |
| Identification of chemicals and drugs interact with genes involved in malignant transfromation |
| (DGIdb 4.0) |
| Entrez ID | Symbol | Category | Interaction Types | Drug Claim Name | Drug Name | PMIDs |
| Page: 1 |

Copyright 2023-Present -The University of Texas Health Science Center at Houston |